
Darling Ingredients (DAR)
We’re wary of Darling Ingredients. Not only is its demand weak but also its falling returns on capital suggest it’s becoming less profitable.― StockStory Analyst Team
1. News


2. Summary
Why We Think Darling Ingredients Will Underperform
Turning what others consider waste into valuable resources, Darling Ingredients (NYSE:DAR) collects and transforms animal by-products, used cooking oil, and other bio-nutrients into valuable ingredients for food, feed, fuel, and industrial applications.
- Products have few die-hard fans as sales have declined by 2.1% annually over the last three years
- Sales were less profitable over the last three years as its earnings per share fell by 41.3% annually, worse than its revenue declines
- One positive is that its high free cash flow margin compared to the broader industry gives it optionality


Darling Ingredients doesn’t meet our quality criteria. We’re redirecting our focus to better businesses.
Why There Are Better Opportunities Than Darling Ingredients


Darling Ingredients is trading at $49.70 per share, or 18.3x forward P/E. This multiple is quite expensive for the quality you get.
Paying a premium for high-quality companies with strong long-term earnings potential is preferable to owning challenged businesses with questionable prospects. That helps the prudent investor sleep well at night.
3. Darling Ingredients (DAR) Research Report: Q4 CY2025 Update
Sustainable ingredients producer Darling Ingredients (NYSE:DAR) announced better-than-expected revenue in Q4 CY2025, with sales up 20.6% year on year to $1.71 billion. Its GAAP profit of $0.35 per share was in line with analysts’ consensus estimates.
Darling Ingredients (DAR) Q4 CY2025 Highlights:
- Revenue: $1.71 billion vs analyst estimates of $1.53 billion (20.6% year-on-year growth, 11.8% beat)
- EPS (GAAP): $0.35 vs analyst estimates of $0.35 (in line)
- Adjusted EBITDA: $336.1 million vs analyst estimates of $274.7 million (19.7% margin, 22.4% beat)
- Operating Margin: 5.7%, down from 8.6% in the same quarter last year
- Market Capitalization: $7.7 billion
Company Overview
Turning what others consider waste into valuable resources, Darling Ingredients (NYSE:DAR) collects and transforms animal by-products, used cooking oil, and other bio-nutrients into valuable ingredients for food, feed, fuel, and industrial applications.
The company operates through three segments: Feed Ingredients, Food Ingredients, and Fuel Ingredients. In its Feed Ingredients segment, Darling processes animal by-products into proteins and fats used in pet food, animal feed, and industrial applications. It also collects used cooking oil from approximately 173,000 locations across North America and processes bakery residuals into animal feed ingredients.
The Food Ingredients segment includes the Rousselot and Gelnex collagen businesses, which produce ingredients for pharmaceutical, nutraceutical, and food applications. Through its CTH business, Darling processes natural casings for the sausage industry, while its Sonac operations produce specialty ingredients like edible fats, bone products, and heparin for pharmaceutical use.
A significant part of Darling's business is its Diamond Green Diesel (DGD) joint venture with Valero Energy, which operates two renewable diesel plants in Louisiana and Texas with a combined capacity of 1.2 billion gallons annually. These facilities convert fats and oils into renewable diesel, a low-carbon transportation fuel interchangeable with petroleum diesel. In Europe, the company's Ecoson business produces biogas from organic sludge and food waste, while Rendac collects and processes animal waste into low-grade energy sources.
Darling's business model exemplifies circular economy principles by converting materials that would otherwise be discarded into sustainable, value-added products. For instance, a restaurant's used cooking oil collected by Darling might be converted into renewable diesel at a DGD facility, helping to reduce carbon emissions in transportation. Similarly, meat processing by-products might be transformed into collagen peptides used in nutritional supplements promoting joint and skin health.
4. Ingredients, Flavors & Fragrances
Ingredients, flavors, and fragrances companies supply essential components to food, beverage, personal care, and household product manufacturers. These firms develop proprietary formulations that enhance taste, scent, and texture, creating customer stickiness through specialized expertise and regulatory-approved ingredient portfolios. Tailwinds include growing consumer demand for natural and clean-label products, expansion in emerging markets, and innovation in plant-based and functional ingredients. However, headwinds persist from volatile raw material costs, particularly for agricultural and petrochemical inputs. Regulatory scrutiny over synthetic additives and fragrance allergens poses compliance challenges, while consolidation among major customers increases pricing pressure and negotiating leverage against suppliers.
Darling Ingredients' competitors in the rendering and ingredients space include Cargill, Tyson Foods, and JBS. In renewable fuels, it competes with other biofuel producers such as Renewable Energy Group (acquired by Chevron), Neste, and traditional petroleum refiners expanding into renewable fuels.
5. Revenue Growth
A company’s long-term sales performance can indicate its overall quality. Any business can put up a good quarter or two, but many enduring ones grow for years.
With $6.14 billion in revenue over the past 12 months, Darling Ingredients carries some recognizable products but is a mid-sized consumer staples company. Its size could bring disadvantages compared to larger competitors benefiting from better brand awareness and economies of scale.
As you can see below, Darling Ingredients’s revenue declined by 2.1% per year over the last three years, a tough starting point for our analysis.
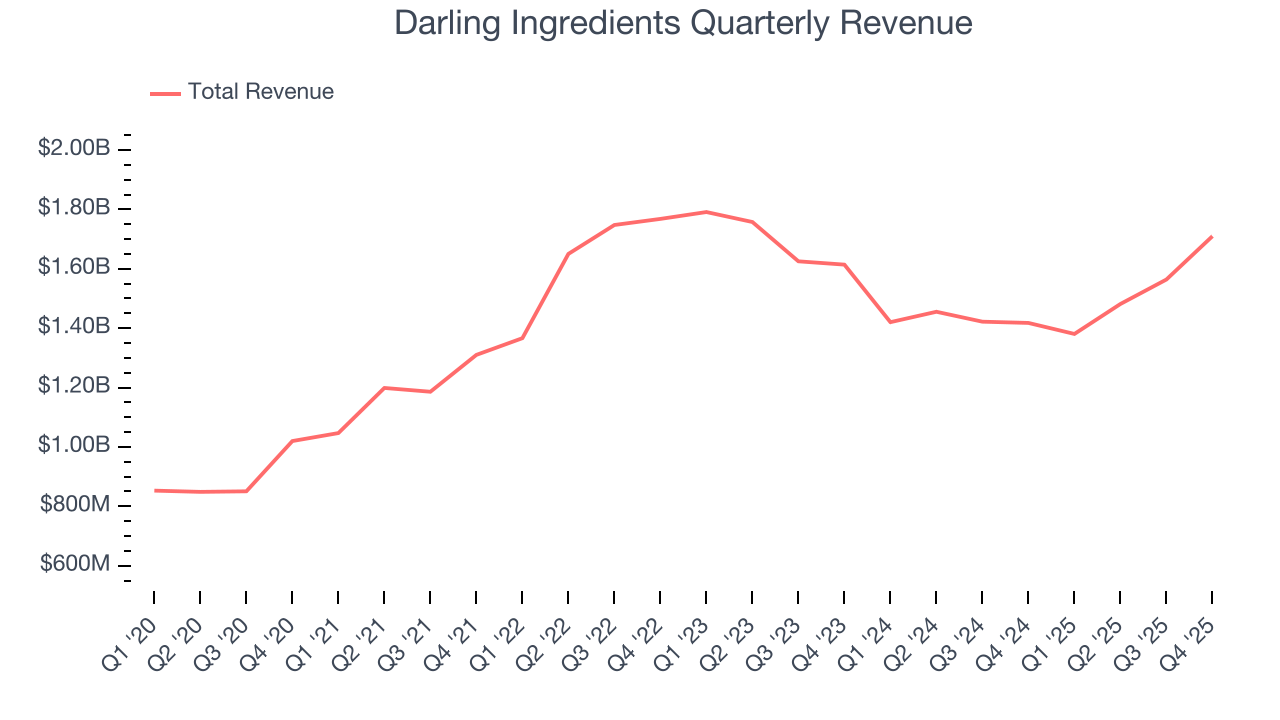
This quarter, Darling Ingredients reported robust year-on-year revenue growth of 20.6%, and its $1.71 billion of revenue topped Wall Street estimates by 11.8%.
Looking ahead, sell-side analysts expect revenue to grow 1.8% over the next 12 months. While this projection implies its newer products will catalyze better top-line performance, it is still below the sector average.
6. Gross Margin & Pricing Power
All else equal, we prefer higher gross margins because they usually indicate that a company sells more differentiated products, has a stronger brand, and commands pricing power.
Darling Ingredients has bad unit economics for a consumer staples company, giving it less room to reinvest and develop new products. As you can see below, it averaged a 23.2% gross margin over the last two years. That means Darling Ingredients paid its suppliers a lot of money ($76.78 for every $100 in revenue) to run its business. 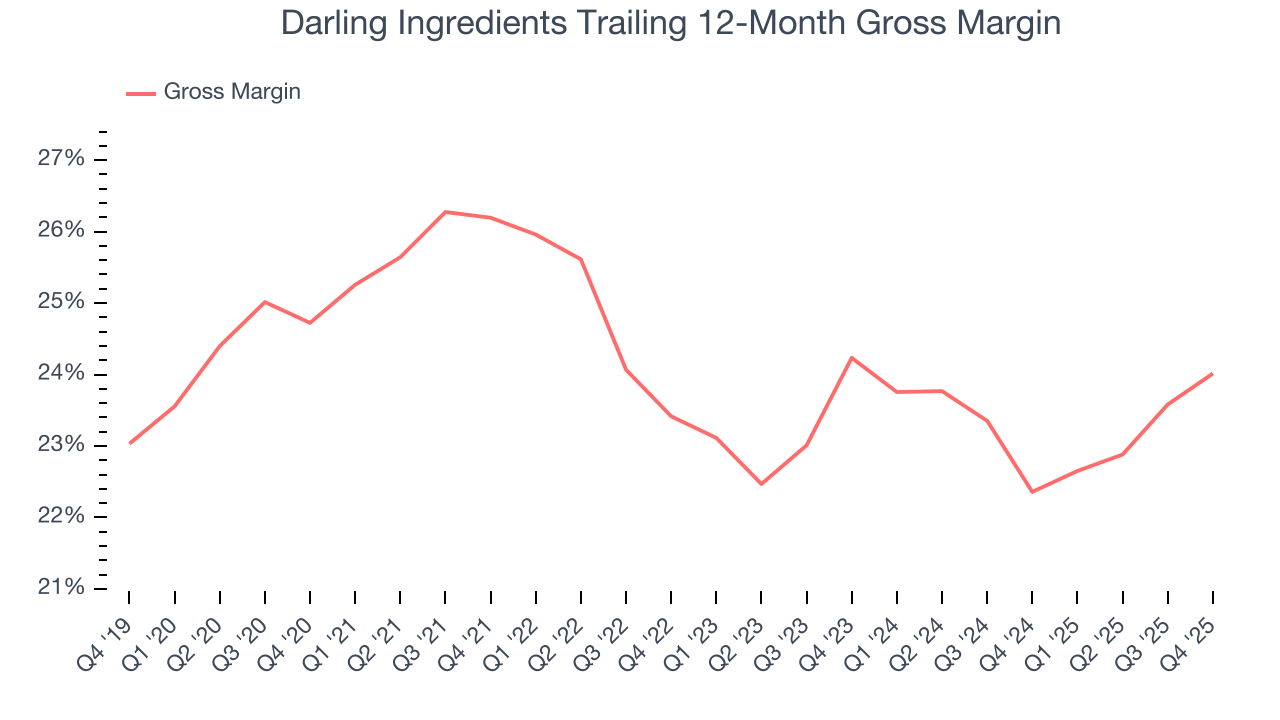
Darling Ingredients produced a 25.1% gross profit margin in Q4 , marking a 1.6 percentage point increase from 23.5% in the same quarter last year. Darling Ingredients’s full-year margin has also been trending up over the past 12 months, increasing by 1.7 percentage points. If this move continues, it could suggest better unit economics due to more leverage from its growing sales on the fixed portion of its cost of goods sold (such as manufacturing expenses).
7. Operating Margin
Darling Ingredients was profitable over the last two years but held back by its large cost base. Its average operating margin of 6.3% was weak for a consumer staples business. This result isn’t too surprising given its low gross margin as a starting point.
Analyzing the trend in its profitability, Darling Ingredients’s operating margin decreased by 3.7 percentage points over the last year. Darling Ingredients’s performance was poor no matter how you look at it - it shows that costs were rising and it couldn’t pass them onto its customers.
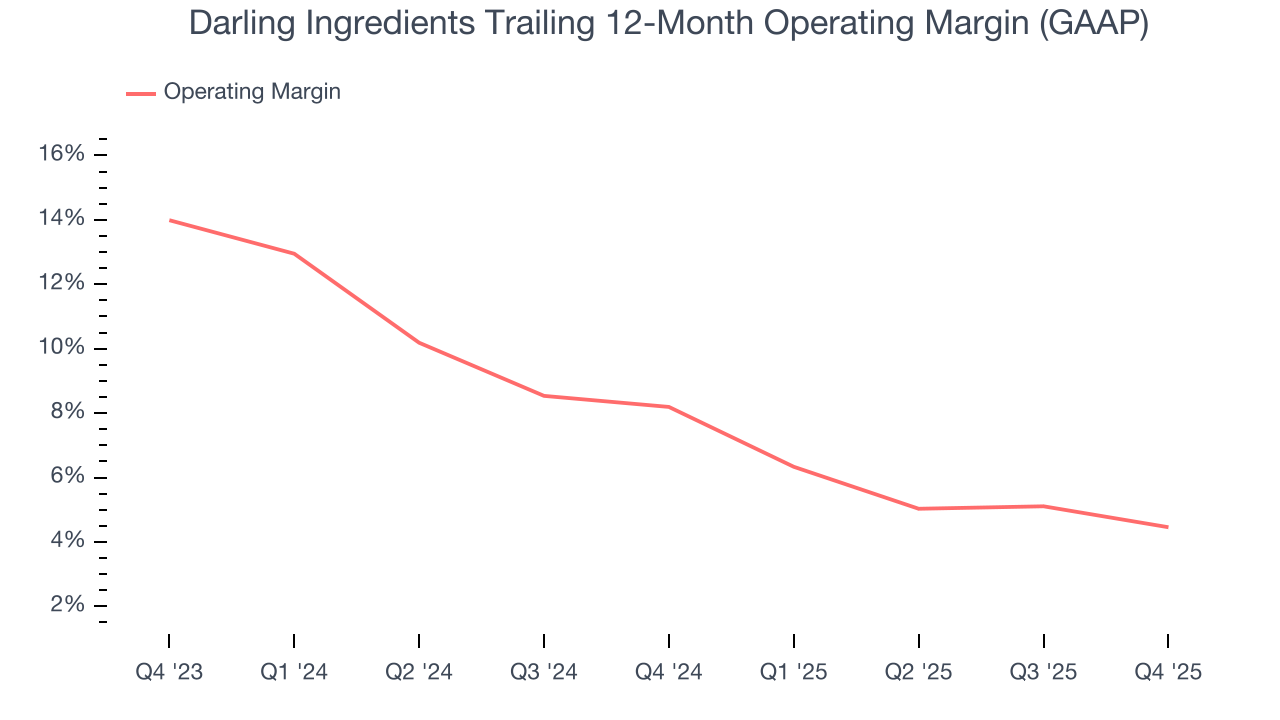
This quarter, Darling Ingredients generated an operating margin profit margin of 5.7%, down 2.9 percentage points year on year. Conversely, its revenue and gross margin actually rose, so we can assume it was less efficient because its operating expenses like marketing, and administrative overhead grew faster than its revenue.
8. Earnings Per Share
Revenue trends explain a company’s historical growth, but the long-term change in earnings per share (EPS) points to the profitability of that growth – for example, a company could inflate its sales through excessive spending on advertising and promotions.
Sadly for Darling Ingredients, its EPS declined by 55.9% annually over the last three years, more than its revenue. This tells us the company struggled because its fixed cost base made it difficult to adjust to shrinking demand.
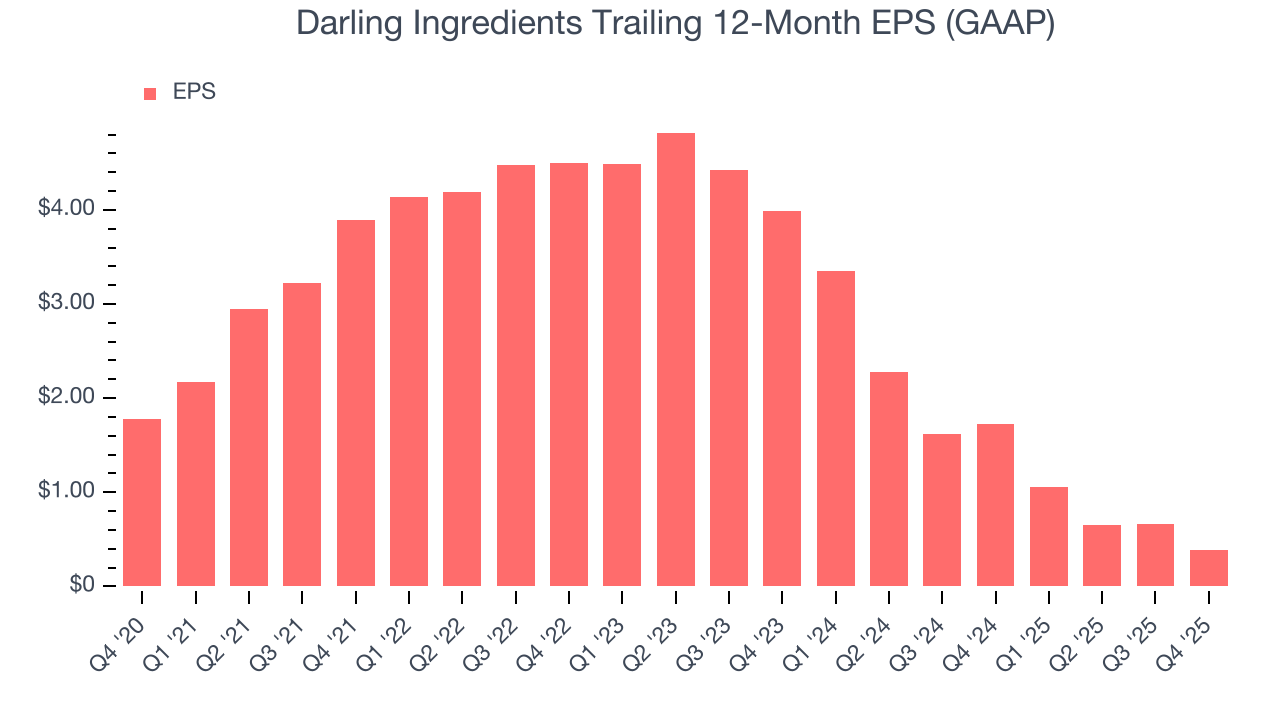
In Q4, Darling Ingredients reported EPS of $0.35, down from $0.63 in the same quarter last year. This print was close to analysts’ estimates. Over the next 12 months, Wall Street expects Darling Ingredients’s full-year EPS of $0.39 to grow 593%.
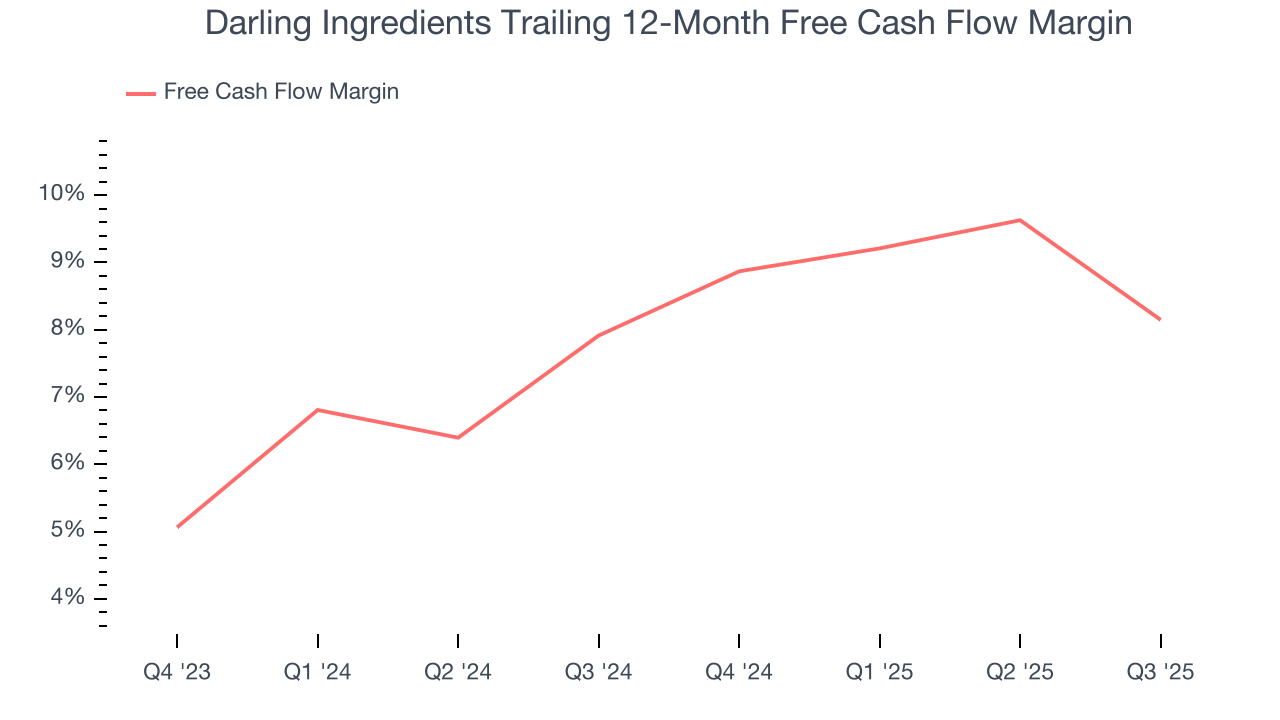
9. Cash Is King
If you’ve followed StockStory for a while, you know we emphasize free cash flow. Why, you ask? We believe that in the end, cash is king, and you can’t use accounting profits to pay the bills.
Darling Ingredients has shown impressive cash profitability, giving it the option to reinvest or return capital to investors. The company’s free cash flow margin averaged 8.9% over the last two years, better than the broader consumer staples sector. The divergence from its underwhelming operating margin stems from the add-back of non-cash charges like depreciation and stock-based compensation. GAAP operating profit expenses these line items, but free cash flow does not.
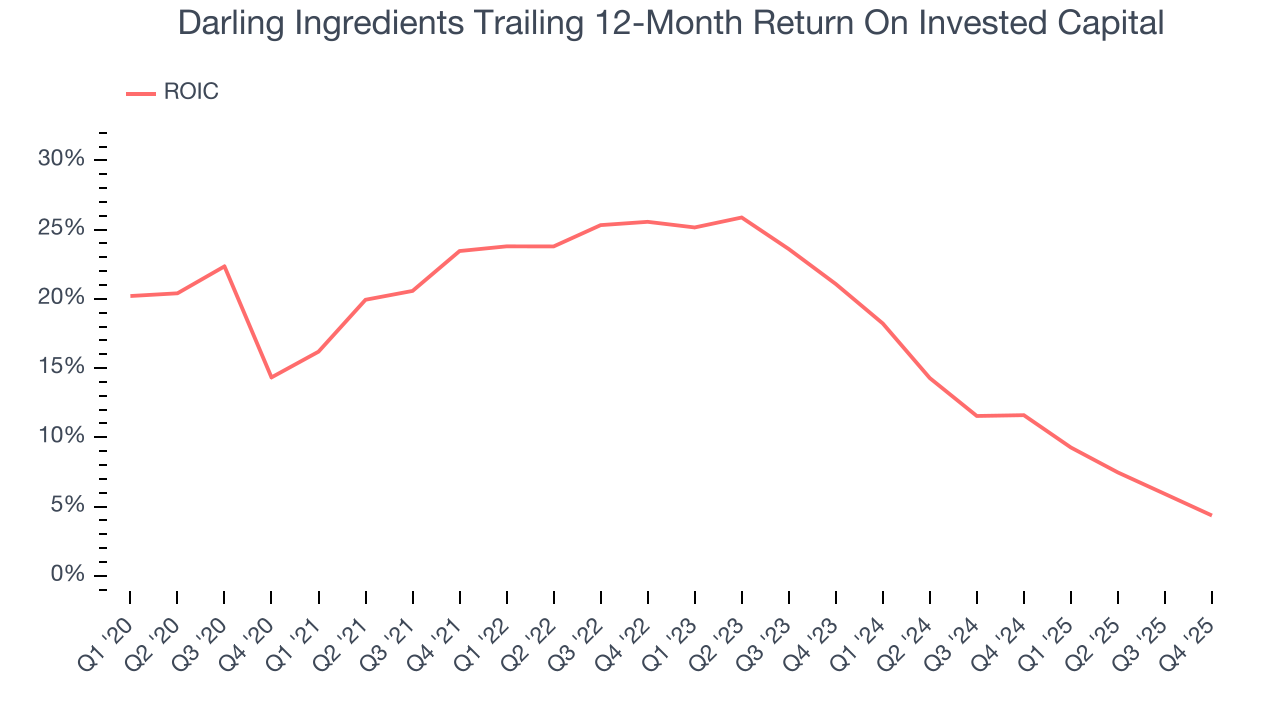
10. Return on Invested Capital (ROIC)
EPS and free cash flow tell us whether a company was profitable while growing its revenue. But was it capital-efficient? Enter ROIC, a metric showing how much operating profit a company generates relative to the money it has raised (debt and equity).
Although Darling Ingredients hasn’t been the highest-quality company lately because of its poor revenue and EPS performance, it historically found a few growth initiatives that worked. Its five-year average ROIC was 17.2%, higher than most consumer staples businesses.
11. Balance Sheet Assessment
Darling Ingredients reported $88.67 million of cash and $3.94 billion of debt on its balance sheet in the most recent quarter. As investors in high-quality companies, we primarily focus on two things: 1) that a company’s debt level isn’t too high and 2) that its interest payments are not excessively burdening the business.
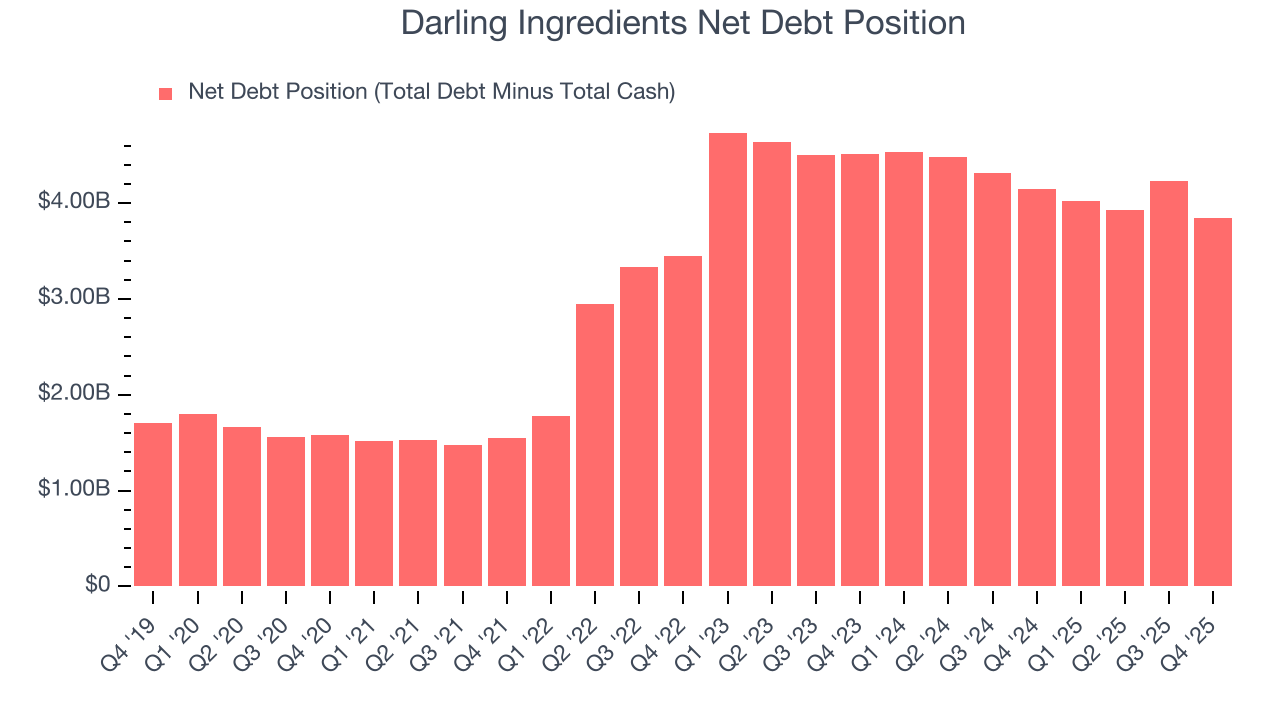
With $980.6 million of EBITDA over the last 12 months, we view Darling Ingredients’s 3.9× net-debt-to-EBITDA ratio as safe. We also see its $99.35 million of annual interest expenses as appropriate. The company’s profits give it plenty of breathing room, allowing it to continue investing in growth initiatives.
12. Key Takeaways from Darling Ingredients’s Q4 Results
We were impressed by how significantly Darling Ingredients blew past analysts’ EBITDA expectations this quarter. We were also excited its revenue outperformed Wall Street’s estimates by a wide margin. Zooming out, we think this was a good print with some key areas of upside. Investors were likely hoping for more, and shares traded down 3.1% to $48.01 immediately after reporting.
13. Is Now The Time To Buy Darling Ingredients?
Updated: February 12, 2026 at 12:06 AM EST
Before deciding whether to buy Darling Ingredients or pass, we urge investors to consider business quality, valuation, and the latest quarterly results.
Darling Ingredients isn’t a terrible business, but it doesn’t pass our quality test. First off, its revenue has declined over the last three years. While its projected EPS for the next year implies the company’s fundamentals will improve, the downside is its declining EPS over the last three years makes it a less attractive asset to the public markets. On top of that, its declining operating margin shows the business has become less efficient.
Darling Ingredients’s P/E ratio based on the next 12 months is 18.3x. Investors with a higher risk tolerance might like the company, but we think the potential downside is too great. We're fairly confident there are better investments elsewhere.
Wall Street analysts have a consensus one-year price target of $52.08 on the company (compared to the current share price of $49.70).