
Dollar General (DG)
We’re skeptical of Dollar General. Its sales have underperformed and its low returns on capital show it has few growth opportunities.― StockStory Analyst Team
1. News


2. Summary
Why We Think Dollar General Will Underperform
Appealing to the budget-conscious consumer, Dollar General (NYSE:DG) is a discount retailer that sells a wide range of household essentials, groceries, apparel/beauty products, and seasonal merchandise.
- Widely-available products (and therefore stiff competition) result in an inferior gross margin of 30.2% that must be offset through higher volumes
- Earnings per share have dipped by 13.8% annually over the past three years, which is concerning because stock prices follow EPS over the long term
- The good news is that its sizeable revenue base of $42.72 billion gives it economies of scale and offsets its poor gross margin


Dollar General is in the penalty box. We’re hunting for superior stocks elsewhere.
Why There Are Better Opportunities Than Dollar General


Dollar General’s stock price of $117.82 implies a valuation ratio of 16.1x forward P/E. While valuation is appropriate for the quality you get, we’re still not buyers.
We’d rather invest in similarly-priced but higher-quality companies with more reliable earnings growth.
3. Dollar General (DG) Research Report: Q4 CY2025 Update
Discount retailer Dollar General (NYSE:DG) announced better-than-expected revenue in Q4 CY2025, with sales up 5.9% year on year to $10.91 billion. Its GAAP profit of $1.93 per share was 17.8% above analysts’ consensus estimates.
Dollar General (DG) Q4 CY2025 Highlights:
- Revenue: $10.91 billion vs analyst estimates of $10.81 billion (5.9% year-on-year growth, 0.9% beat)
- EPS (GAAP): $1.93 vs analyst estimates of $1.64 (17.8% beat)
- Revenue guidance for the upcoming year 2026 (fiscal 2027) is 3.95% year-on-year growth, below analyst estimates
- EPS (GAAP) guidance for the upcoming year 2026 (fiscal 2027) is $7.23 at the midpoint, slightly below analyst estimates
- Operating Margin: 5.6%, up from 2.9% in the same quarter last year
- Free Cash Flow Margin: 5.3%, similar to the same quarter last year
- Locations: 20,893 at quarter end, up from 20,594 in the same quarter last year
- Same-Store Sales rose 4.3% year on year (1.2% in the same quarter last year)
- Market Capitalization: $31.88 billion
Company Overview
Appealing to the budget-conscious consumer, Dollar General (NYSE:DG) is a discount retailer that sells a wide range of household essentials, groceries, apparel/beauty products, and seasonal merchandise.
Founded in 1939 and originally called J.L. Turner & Son, the company changed its name to Dollar General in 1968. The core Dollar general customer is typically a lower-income household in underserved rural or suburban areas. Perhaps that area is not served well by large regional grocery stores or general merchandise retailers such as Walmart, which is where Dollar General sees opportunity.
Dollar General tends to sell smaller unit quantities for those who cannot afford to buy in bulk and want to instead buy for immediate need. For example, you might not be able to buy a pack of one or two paper towel rolls at Kroger or Costco, but Dollar General has you covered here.
The Dollar General store is generally less than 10,000 square feet, much smaller than traditional grocery stores or general merchandise giants such as Walmart and Costco. These Dollar General stores feature easy-to-navigate layouts. Because of smaller store sizes, there is usually less selection within categories (only two ketchup brands, for example) and fewer store employees. Dollar General sells a combination of national brands as well as private label products, but again, the selection of brands is limited.
4. Discount Grocery Store
Traditional grocery stores are go-tos for many families, but discount grocers serve those who may not have a traditional grocery store nearby or who may have different spending thresholds. Certain rural or lower-income areas simply don’t have a grocery store. Additionally, some lower-income families would prefer to buy in smaller quantities than available at most stores (think one or two paper towel rolls at a time). While online competition threatens all of retail, grocery is one of the least penetrated because of the nature of buying food. Furthermore, those buying small quantities for immediate need are even less likely to leverage e-commerce for these purposes.
Competitors that sell general merchandise and/or groceries to US consumers include Walmart (NYSE:WMT), Costco (NYSE:COST), and Kroger (NYSE:KR).
5. Revenue Growth
A company’s long-term sales performance can indicate its overall quality. Any business can put up a good quarter or two, but the best consistently grow over the long haul.
With $42.72 billion in revenue over the past 12 months, Dollar General is larger than most consumer retail companies and benefits from economies of scale, enabling it to gain more leverage on its fixed costs than smaller competitors. This also gives it the flexibility to offer lower prices. However, its scale is a double-edged sword because there is only so much real estate to build new stores, placing a ceiling on its growth. To expand meaningfully, Dollar General likely needs to tweak its prices or enter new markets.
As you can see below, Dollar General’s 4.1% annualized revenue growth over the last three years was sluggish, but to its credit, it opened new stores and increased sales at existing, established locations.
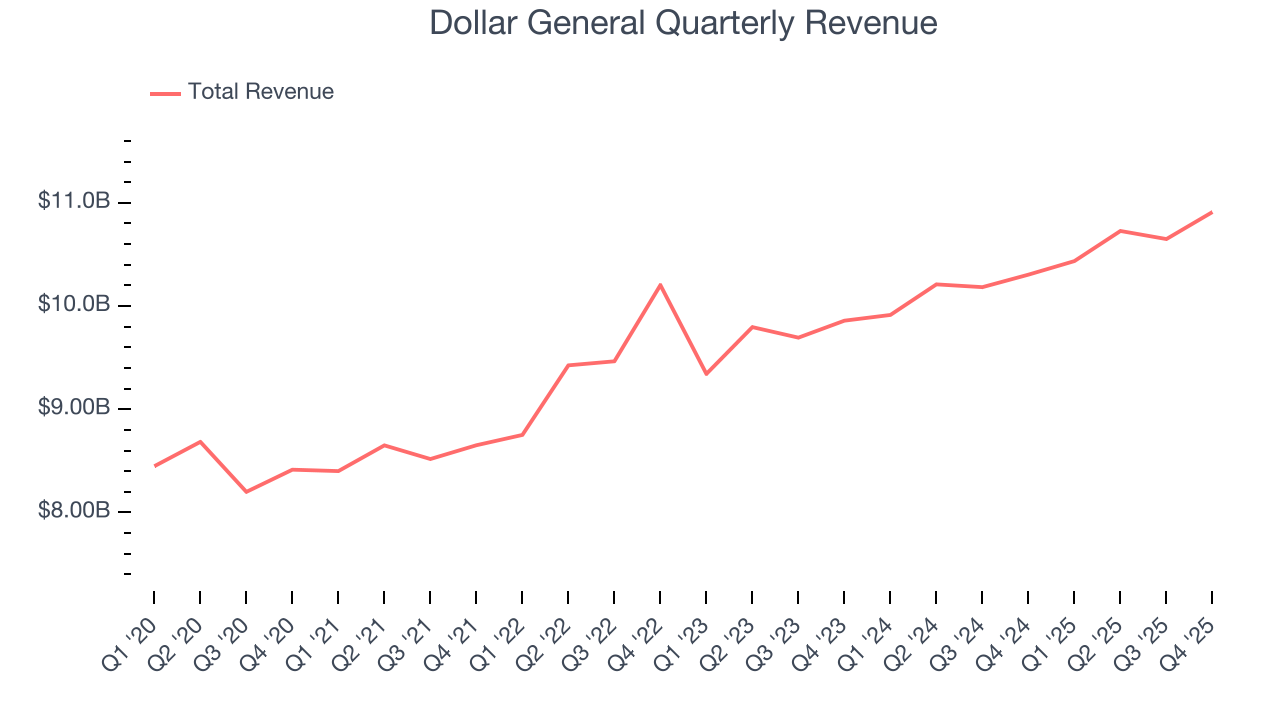
This quarter, Dollar General reported year-on-year revenue growth of 5.9%, and its $10.91 billion of revenue exceeded Wall Street’s estimates by 0.9%.
Looking ahead, sell-side analysts expect revenue to grow 4% over the next 12 months, similar to its three-year rate. This projection is above average for the sector and indicates its newer products will help sustain its historical top-line performance.
6. Store Performance
Number of Stores
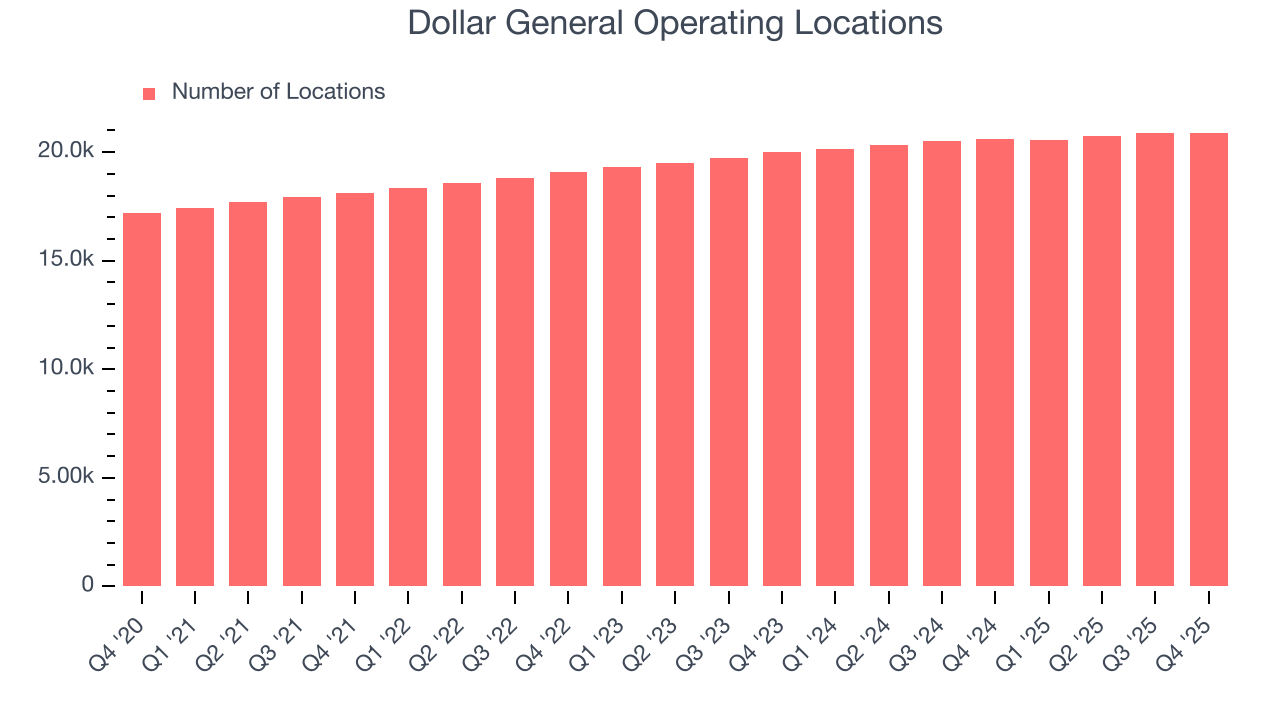
A retailer’s store count often determines how much revenue it can generate.
Dollar General sported 20,893 locations in the latest quarter. Over the last two years, it has opened new stores quickly, averaging 2.9% annual growth. This was faster than the broader consumer retail sector.
When a retailer opens new stores, it usually means it’s investing for growth because demand is greater than supply, especially in areas where consumers may not have a store within reasonable driving distance.
Same-Store Sales
The change in a company's store base only tells one side of the story. The other is the performance of its existing locations and e-commerce sales, which informs management teams whether they should expand or downsize their physical footprints. Same-store sales gives us insight into this topic because it measures organic growth for a retailer's e-commerce platform and brick-and-mortar shops that have existed for at least a year.
Dollar General’s demand rose over the last two years and slightly outpaced the industry. On average, the company’s same-store sales have grown by 2.2% per year. This performance suggests its rollout of new stores could be beneficial for shareholders. When a retailer has demand, more locations should help it reach more customers and boost revenue growth.
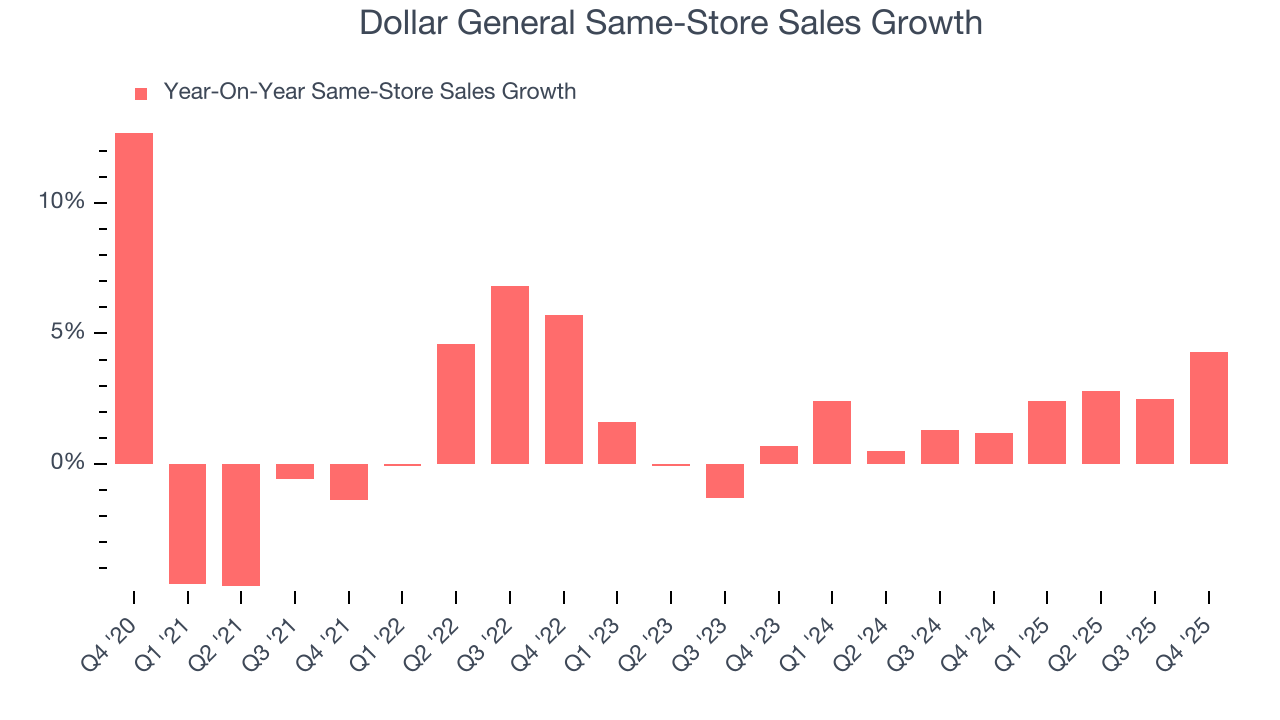
In the latest quarter, Dollar General’s same-store sales rose 4.3% year on year. This growth was an acceleration from its historical levels, which is always an encouraging sign.
7. Gross Margin & Pricing Power
We prefer higher gross margins because they not only make it easier to generate more operating profits but also indicate product differentiation, negotiating leverage, and pricing power.
Dollar General has bad unit economics for a retailer, signaling it operates in a competitive market and lacks pricing power because its inventory is sold in many places. As you can see below, it averaged a 30.1% gross margin over the last two years.
When compared to other non-discretionary retailers, however, it’s actually pretty solid. That’s because non-discretionary retailers have structurally lower gross margins; they compete on the lowest price, sell products easily found elsewhere, and have high transportation costs to move goods. We believe the best metrics to assess these companies are free cash flow margin, operating leverage, and profit volatility, which account for their scale advantages and non-cyclical demand.
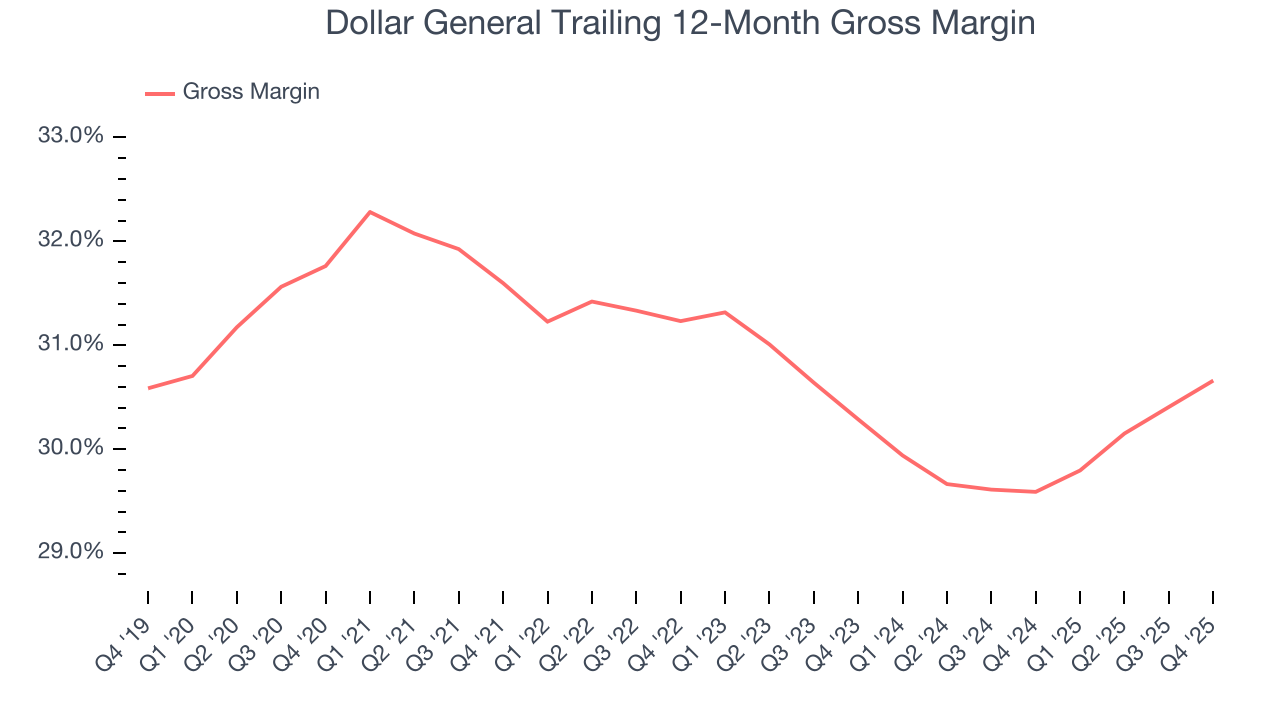
This quarter, Dollar General’s gross profit margin was 30.4%, up 1 percentage points year on year. Dollar General’s full-year margin has also been trending up over the past 12 months, increasing by 1.1 percentage points. If this move continues, it could suggest better unit economics due to more leverage from its growing sales on the fixed portion of its cost of goods sold.
8. Operating Margin
Operating margin is a key profitability metric because it accounts for all expenses necessary to run a store, including wages, inventory, rent, advertising, and other administrative costs.
Dollar General’s operating margin has generally stayed the same over the last 12 months, averaging 4.7% over the last two years. This profitability was lousy for a consumer retail business and caused by its suboptimal cost structureand low gross margin.
Looking at the trend in its profitability, Dollar General’s operating margin might fluctuated slightly but has generally stayed the same over the last year. This raises questions about the company’s expense base because its revenue growth should have given it leverage on its fixed costs, resulting in better economies of scale and profitability.
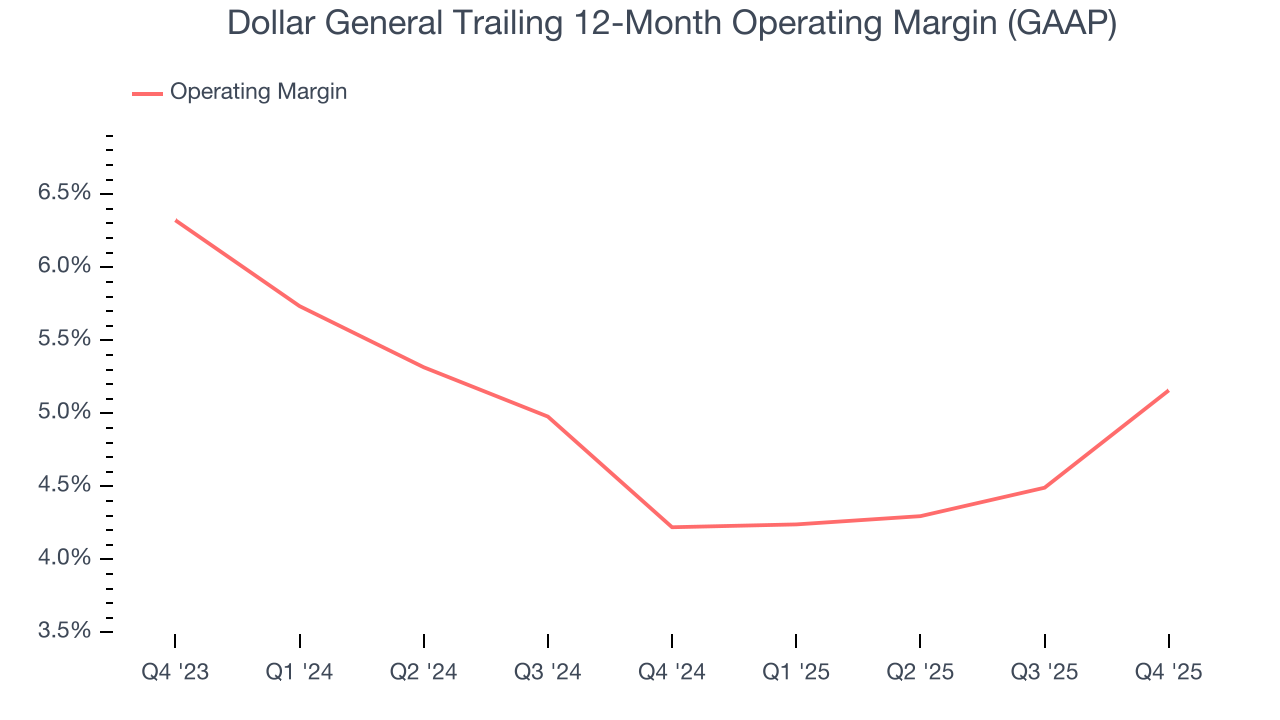
This quarter, Dollar General generated an operating margin profit margin of 5.6%, up 2.7 percentage points year on year. The increase was encouraging, and because its operating margin rose more than its gross margin, we can infer it was more efficient with expenses such as marketing, and administrative overhead.
9. Earnings Per Share
Revenue trends explain a company’s historical growth, but the long-term change in earnings per share (EPS) points to the profitability of that growth – for example, a company could inflate its sales through excessive spending on advertising and promotions.
Sadly for Dollar General, its EPS declined by 13.7% annually over the last three years while its revenue grew by 4.1%. This tells us the company became less profitable on a per-share basis as it expanded.
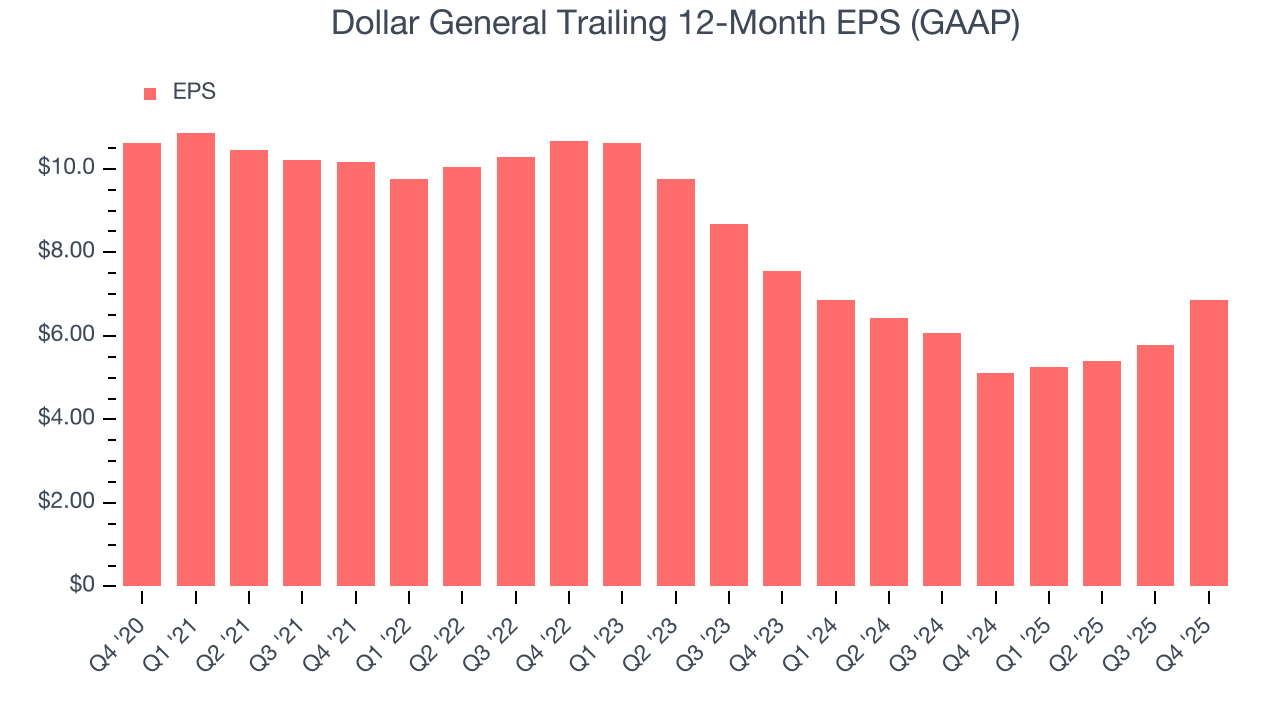
In Q4, Dollar General reported EPS of $1.93, up from $0.87 in the same quarter last year. This print easily cleared analysts’ estimates, and shareholders should be content with the results. Over the next 12 months, Wall Street expects Dollar General’s full-year EPS of $6.85 to grow 6%.
10. Cash Is King
Free cash flow isn't a prominently featured metric in company financials and earnings releases, but we think it's telling because it accounts for all operating and capital expenses, making it tough to manipulate. Cash is king.
Dollar General has shown impressive cash profitability, giving it the option to reinvest or return capital to investors. The company’s free cash flow margin averaged 4.9% over the last two years, better than the broader consumer retail sector. The divergence from its underwhelming operating margin stems from the add-back of non-cash charges like depreciation and stock-based compensation. GAAP operating profit expenses these line items, but free cash flow does not.
Taking a step back, we can see that Dollar General’s margin expanded by 1.4 percentage points over the last year. This is encouraging because it gives the company more optionality.
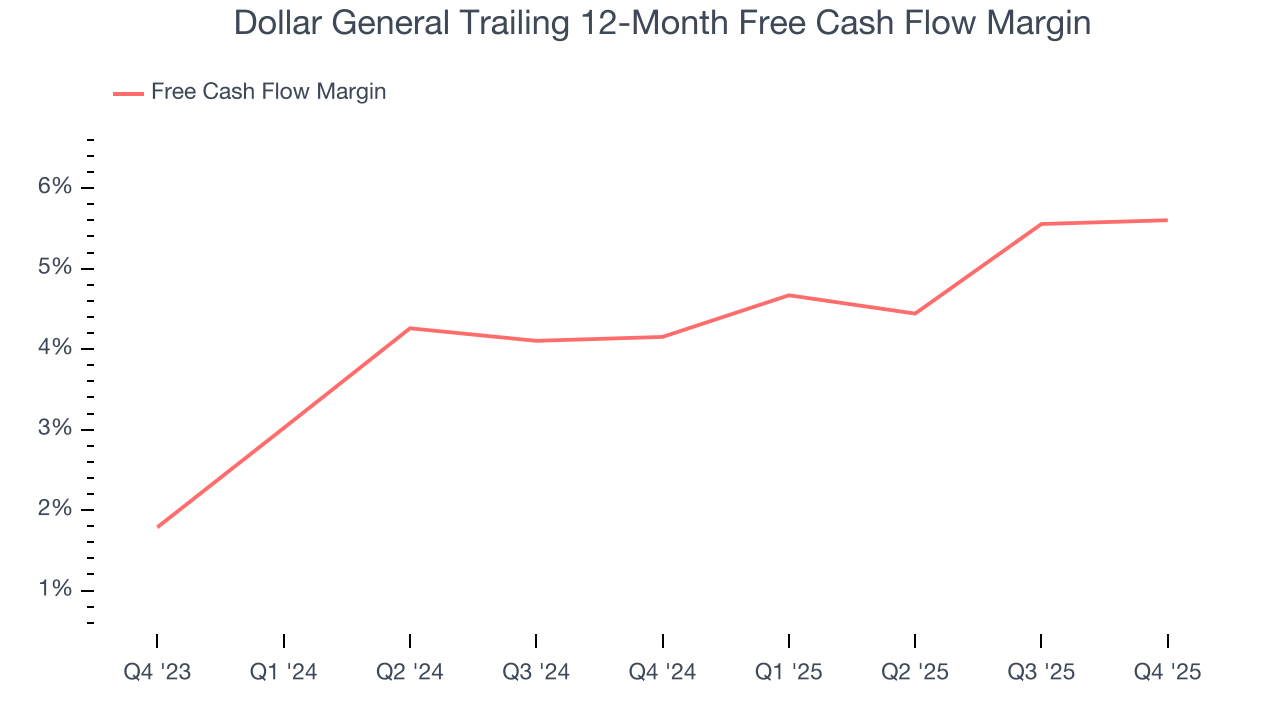
Dollar General’s free cash flow clocked in at $582 million in Q4, equivalent to a 5.3% margin. This cash profitability was in line with the comparable period last year and its two-year average.
11. Return on Invested Capital (ROIC)
EPS and free cash flow tell us whether a company was profitable while growing its revenue. But was it capital-efficient? A company’s ROIC explains this by showing how much operating profit it makes compared to the money it has raised (debt and equity).
Dollar General historically did a mediocre job investing in profitable growth initiatives. Its five-year average ROIC was 9.3%, somewhat low compared to the best consumer retail companies that consistently pump out 25%+.
12. Balance Sheet Assessment
Dollar General reported $1.14 billion of cash and $15.72 billion of debt on its balance sheet in the most recent quarter. As investors in high-quality companies, we primarily focus on two things: 1) that a company’s debt level isn’t too high and 2) that its interest payments are not excessively burdening the business.
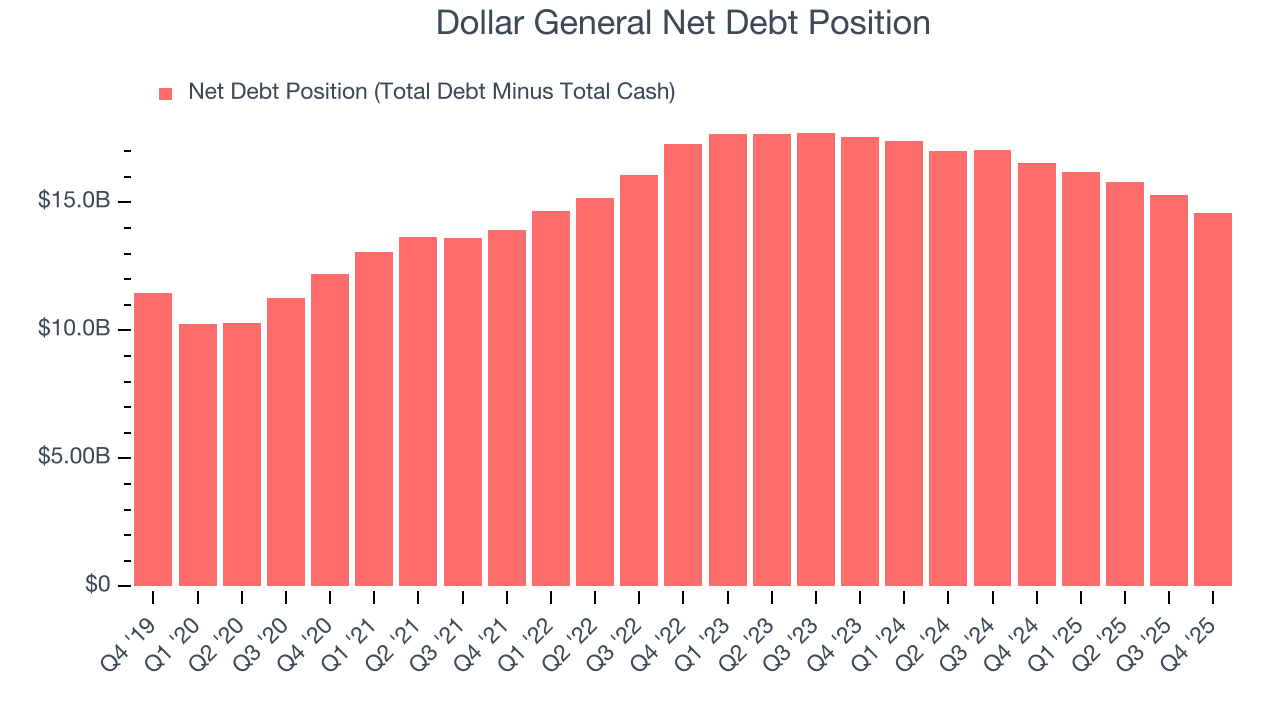
With $3.27 billion of EBITDA over the last 12 months, we view Dollar General’s 4.5× net-debt-to-EBITDA ratio as safe. We also see its $126 million of annual interest expenses as appropriate. The company’s profits give it plenty of breathing room, allowing it to continue investing in growth initiatives.
13. Key Takeaways from Dollar General’s Q4 Results
We liked how Dollar General beat analysts’ EPS expectations this quarter. On the other hand, full-year revenue growth guidance and full-year EPS guidance both came in below. This outlook is weighing on shares. Investors were likely hoping for more, and shares traded down 2.8% to $140.74 immediately following the results.
14. Is Now The Time To Buy Dollar General?
Updated: March 29, 2026 at 10:41 PM EDT
A common mistake we notice when investors are deciding whether to buy a stock or not is that they simply look at the latest earnings results. Business quality and valuation matter more, so we urge you to understand these dynamics as well.
Dollar General isn’t a terrible business, but it doesn’t pass our bar. To kick things off, its revenue growth was a little slower over the last three years, and analysts don’t see anything changing over the next 12 months. While its popular brand gives it meaningful influence over consumers’ purchasing decisions, the downside is its gross margins make it more challenging to reach positive operating profits compared to other consumer retail businesses. On top of that, its declining EPS over the last three years makes it a less attractive asset to the public markets.
Dollar General’s P/E ratio based on the next 12 months is 16.4x. While this valuation is fair, the upside isn’t great compared to the potential downside. We're fairly confident there are better investments elsewhere.
Wall Street analysts have a consensus one-year price target of $148.43 on the company (compared to the current share price of $117.24).
Although the price target is bullish, readers should exercise caution because analysts tend to be overly optimistic. The firms they work for, often big banks, have relationships with companies that extend into fundraising, M&A advisory, and other rewarding business lines. As a result, they typically hesitate to say bad things for fear they will lose out. We at StockStory do not suffer from such conflicts of interest, so we’ll always tell it like it is.