
Quest (DGX)
We aren’t fans of Quest. Its poor sales growth and falling returns on capital suggest its growth opportunities are shrinking.― StockStory Analyst Team
1. News


2. Summary
Why We Think Quest Will Underperform
Processing approximately one-third of the adult U.S. population's lab tests annually, Quest Diagnostics (NYSE:DGX) provides laboratory testing and diagnostic information services to patients, physicians, hospitals, and other healthcare providers across the United States.
- Annual earnings per share growth of 3% underperformed its revenue over the last five years, showing its incremental sales were less profitable
- Annual sales growth of 5.3% over the last five years lagged behind its healthcare peers as its large revenue base made it difficult to generate incremental demand
- One positive is that its strict cost controls contribute to a sturdy adjusted operating margin that is better than most healthcare companies


Quest’s quality doesn’t meet our hurdle. Better businesses are for sale in the market.
Why There Are Better Opportunities Than Quest


At $181.75 per share, Quest trades at 17.9x forward P/E. Quest’s multiple may seem like a great deal among healthcare peers, but we think there are valid reasons why it’s this cheap.
We’d rather pay up for companies with elite fundamentals than get a bargain on weak ones. Cheap stocks can be value traps, and as their performance deteriorates, they will stay cheap or get even cheaper.
3. Quest (DGX) Research Report: Q3 CY2025 Update
Healthcare diagnostics company Quest Diagnostics (NYSE:DGX) reported Q3 CY2025 results topping the market’s revenue expectations, with sales up 13.2% year on year to $2.82 billion. The company’s full-year revenue guidance of $10.98 billion at the midpoint came in 1% above analysts’ estimates. Its non-GAAP profit of $2.60 per share was 3.9% above analysts’ consensus estimates.
Quest (DGX) Q3 CY2025 Highlights:
- Revenue: $2.82 billion vs analyst estimates of $2.73 billion (13.2% year-on-year growth, 3.3% beat)
- Adjusted EPS: $2.60 vs analyst estimates of $2.50 (3.9% beat)
- The company lifted its revenue guidance for the full year to $10.98 billion at the midpoint from $10.86 billion, a 1.1% increase
- Management slightly raised its full-year Adjusted EPS guidance to $9.80 at the midpoint
- Operating Margin: 13.7%, in line with the same quarter last year
- Free Cash Flow Margin: 14.9%, up from 10% in the same quarter last year
- Sales Volumes rose 12.5% year on year (5.5% in the same quarter last year)
- Market Capitalization: $21.29 billion
Company Overview
Processing approximately one-third of the adult U.S. population's lab tests annually, Quest Diagnostics (NYSE:DGX) provides laboratory testing and diagnostic information services to patients, physicians, hospitals, and other healthcare providers across the United States.
Quest operates through a nationwide network of laboratories, including advanced facilities and rapid response labs that can quickly perform routine tests when fast turnaround is needed. The company maintains approximately 2,000 patient service centers, many located in retail settings for convenient access, and offers mobile phlebotomy services for in-home blood draws.
The company's testing menu spans from routine blood work to highly specialized advanced diagnostics in areas like molecular genomics, oncology, neurology, and infectious disease. For example, Quest offers tests that can detect minimal residual disease in cancer patients through its Haystack Oncology technology, which identifies tiny molecules of cancer DNA in the bloodstream. The company also provides Alzheimer's disease risk assessment through blood tests rather than more invasive procedures.
Beyond laboratory testing, Quest leverages its vast database of de-identified clinical results to provide insights that help improve healthcare outcomes. Healthcare providers use these insights to identify gaps in care, monitor population health, and make more informed treatment decisions. The company's digital platform, MyQuest, allows patients to access their test results online.
Quest generates revenue primarily through reimbursement from health insurance companies, Medicare, Medicaid, and direct payments from patients. The company also offers services to life insurance companies through its ExamOne business, which provides risk assessment services including paramedical examinations and laboratory testing for insurance applicants.
The company partners with hospitals in various ways, including managing their laboratories, acquiring their outreach lab operations, and forming joint ventures. Quest also works with pharmaceutical companies on clinical trials testing and companion diagnostics development to support personalized medicine initiatives.
4. Testing & Diagnostics Services
The testing and diagnostics services industry plays a crucial role in disease detection, monitoring, and prevention, serving hospitals, clinics, and individual consumers. This sector benefits from stable demand, driven by an aging population, increased prevalence of chronic diseases, and growing awareness of preventive healthcare. Recurring revenue streams come from routine screenings, lab tests, and diagnostic imaging, with reimbursement from Medicare, Medicaid, private insurance, and out-of-pocket payments. However, the industry faces challenges such as pricing pressures, regulatory compliance, and the need for continuous investment in new testing technologies. Looking ahead, industry tailwinds include the expansion of personalized medicine, increased adoption of at-home and rapid diagnostic tests, and advancements in AI-driven diagnostics that enhance accuracy and efficiency. However, headwinds such as reimbursement uncertainties, competition from decentralized testing solutions, and regulatory scrutiny over test validity and cost-effectiveness may impact profitability. Adapting to evolving healthcare models and integrating automation will be key for sustaining growth and maintaining operational efficiency.
Quest Diagnostics' primary competitor is Laboratory Corporation of America Holdings (NYSE: LH), commonly known as Labcorp. Other competitors include hospital-based laboratories, physician-office laboratories, and specialty testing providers like Bio-Reference Laboratories (a subsidiary of OPKO Health, NYSE: OPK).
5. Economies of Scale
Larger companies benefit from economies of scale, where fixed costs like infrastructure, technology, and administration are spread over a higher volume of goods or services, reducing the cost per unit. Scale can also lead to bargaining power with suppliers, greater brand recognition, and more investment firepower. A virtuous cycle can ensue if a scaled company plays its cards right.
With $10.85 billion in revenue over the past 12 months, Quest has decent scale. This is important as it gives the company more leverage in a heavily regulated, competitive environment that is complex and resource-intensive.
6. Revenue Growth
Reviewing a company’s long-term sales performance reveals insights into its quality. Any business can put up a good quarter or two, but many enduring ones grow for years. Unfortunately, Quest’s 5.3% annualized revenue growth over the last five years was mediocre. This was below our standard for the healthcare sector and is a tough starting point for our analysis.
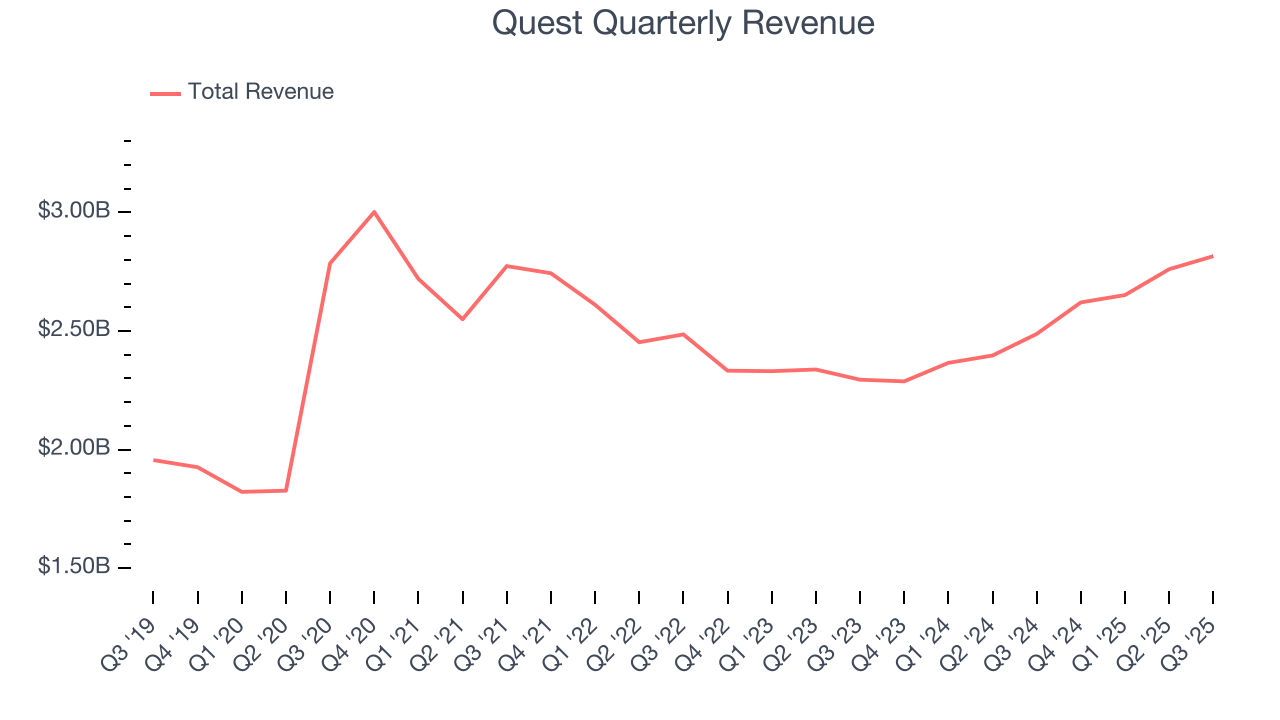
Long-term growth is the most important, but within healthcare, a half-decade historical view may miss new innovations or demand cycles. Quest’s annualized revenue growth of 8% over the last two years is above its five-year trend, suggesting some bright spots. 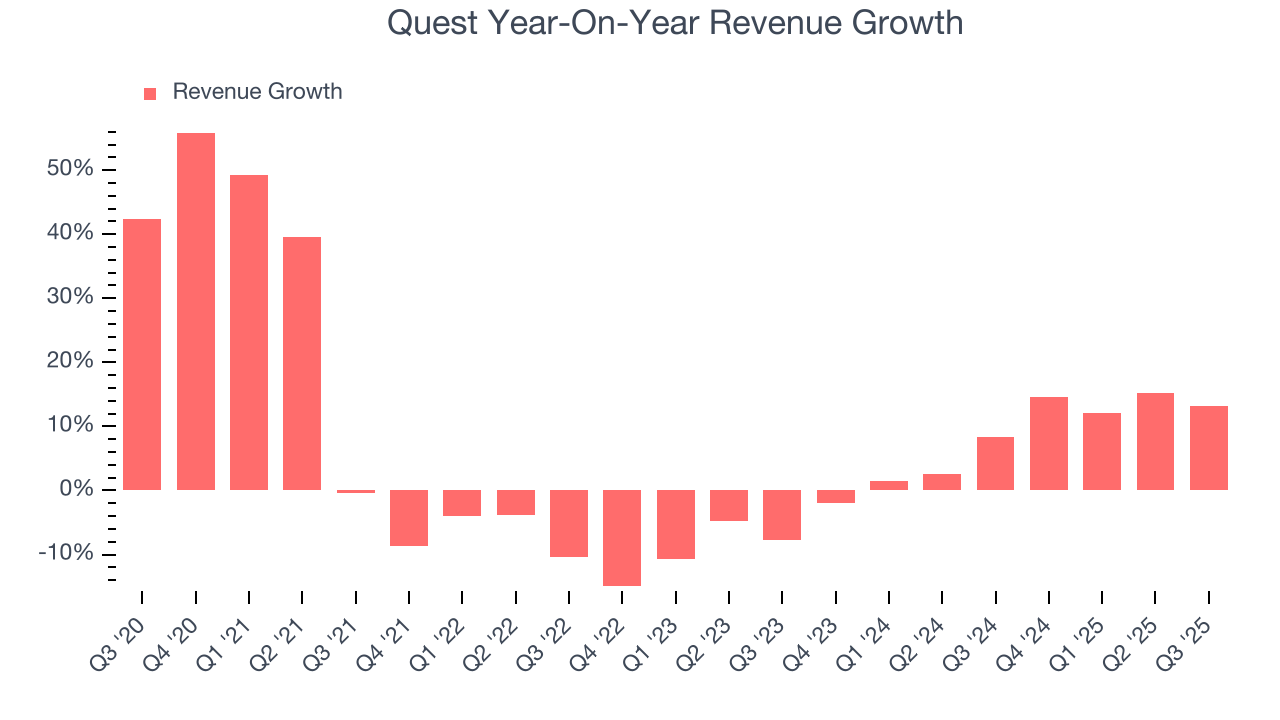
We can better understand the company’s revenue dynamics by analyzing its number of requisition volumes. Over the last two years, Quest’s requisition volumes averaged 8.1% year-on-year growth. Because this number is in line with its revenue growth, we can see the company kept its prices fairly consistent. 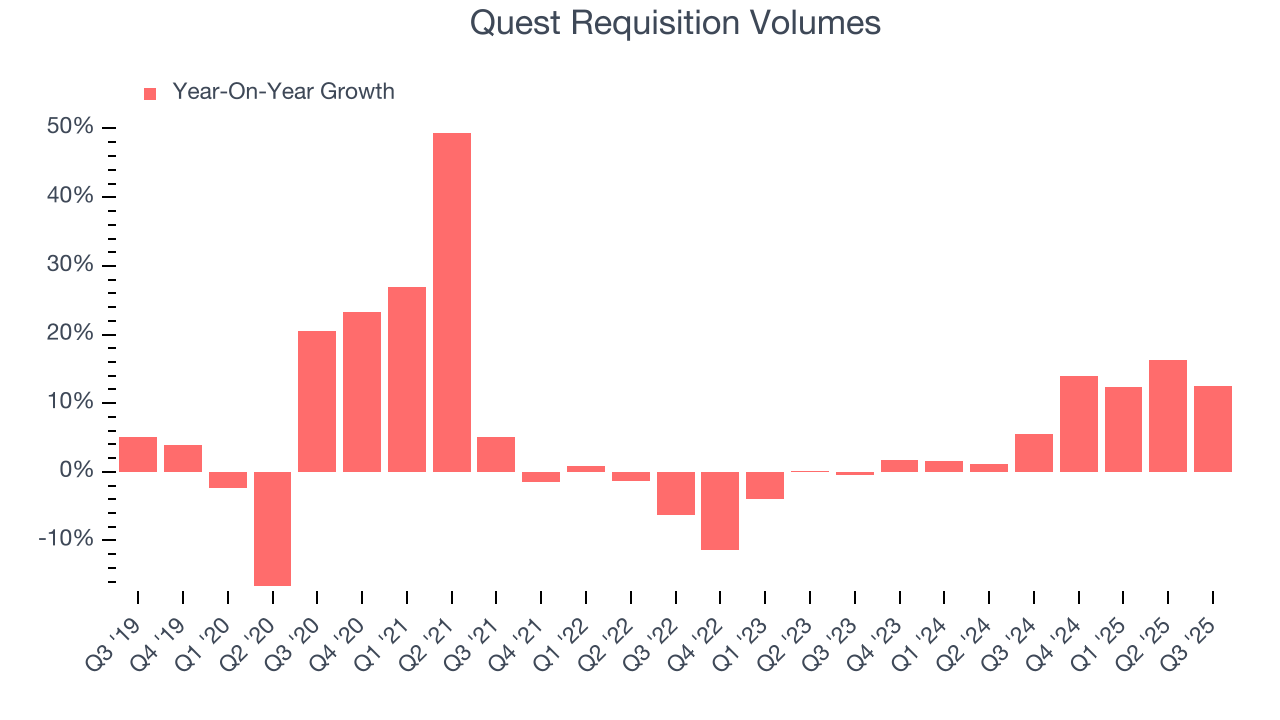
This quarter, Quest reported year-on-year revenue growth of 13.2%, and its $2.82 billion of revenue exceeded Wall Street’s estimates by 3.3%.
Looking ahead, sell-side analysts expect revenue to grow 2.7% over the next 12 months, a deceleration versus the last two years. This projection is underwhelming and implies its products and services will see some demand headwinds.
7. Operating Margin
Operating margin is one of the best measures of profitability because it tells us how much money a company takes home after subtracting all core expenses, like marketing and R&D.
Quest has managed its cost base well over the last five years. It demonstrated solid profitability for a healthcare business, producing an average operating margin of 16.4%.
Analyzing the trend in its profitability, Quest’s operating margin decreased by 9.8 percentage points over the last five years, but it rose by 2 percentage points on a two-year basis. Still, shareholders will want to see Quest become more profitable in the future.
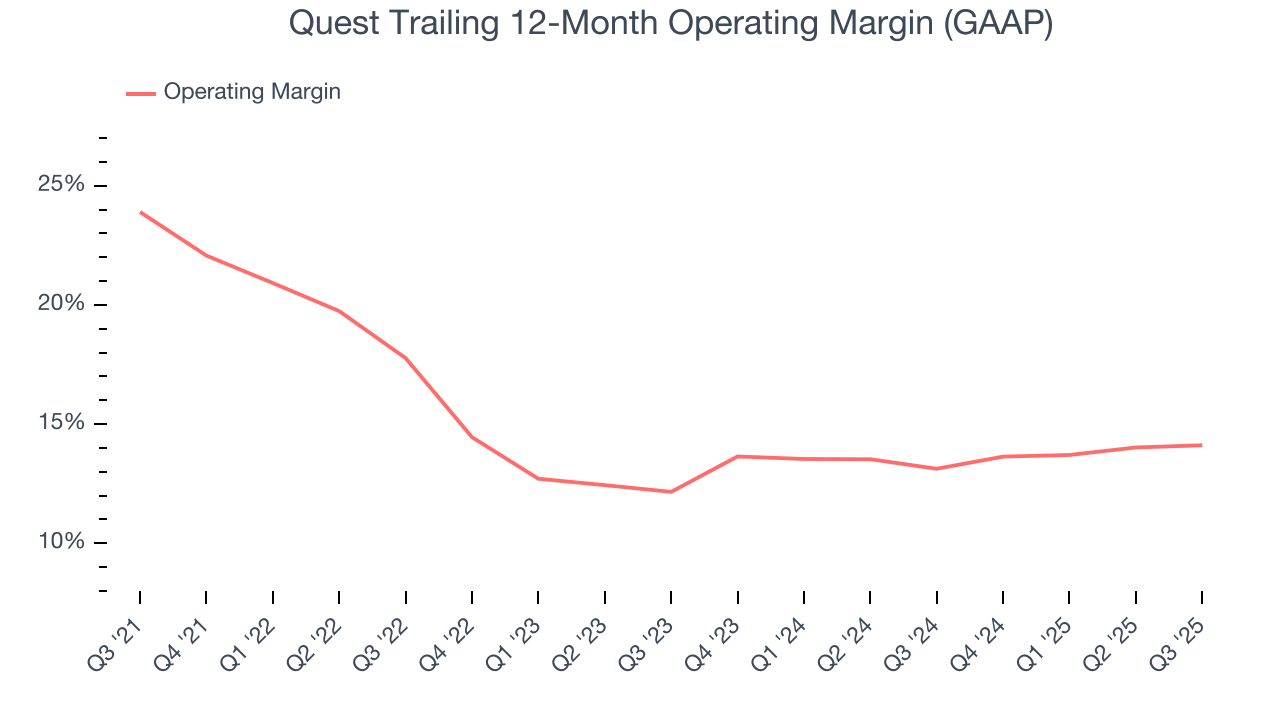
In Q3, Quest generated an operating margin profit margin of 13.7%, in line with the same quarter last year. This indicates the company’s overall cost structure has been relatively stable.
8. Earnings Per Share
We track the long-term change in earnings per share (EPS) for the same reason as long-term revenue growth. Compared to revenue, however, EPS highlights whether a company’s growth is profitable.
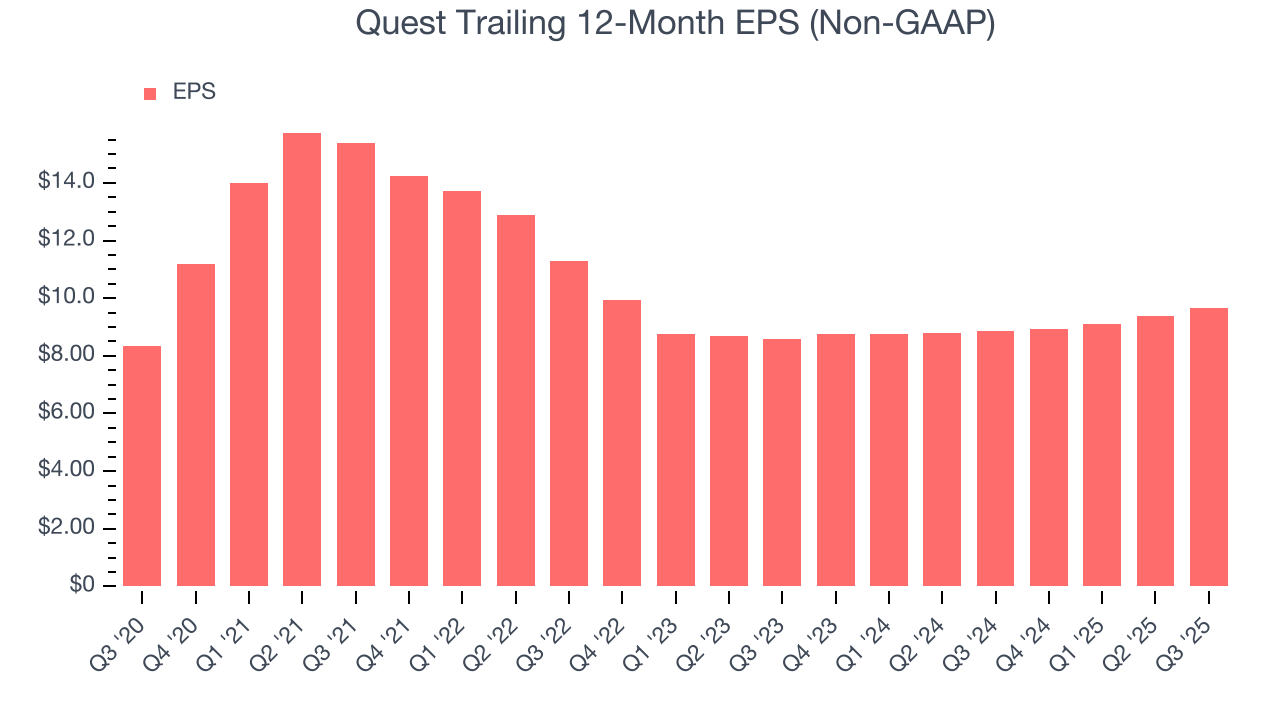
Quest’s EPS grew at an unimpressive 3% compounded annual growth rate over the last five years, lower than its 5.3% annualized revenue growth. This tells us the company became less profitable on a per-share basis as it expanded due to non-fundamental factors such as interest expenses and taxes.
We can take a deeper look into Quest’s earnings to better understand the drivers of its performance. As we mentioned earlier, Quest’s operating margin was flat this quarter but declined by 9.8 percentage points over the last five years. This was the most relevant factor (aside from the revenue impact) behind its lower earnings; interest expenses and taxes can also affect EPS but don’t tell us as much about a company’s fundamentals.
In Q3, Quest reported adjusted EPS of $2.60, up from $2.30 in the same quarter last year. This print beat analysts’ estimates by 3.9%. Over the next 12 months, Wall Street expects Quest’s full-year EPS of $9.67 to grow 4.8%.
9. Cash Is King
Free cash flow isn't a prominently featured metric in company financials and earnings releases, but we think it's telling because it accounts for all operating and capital expenses, making it tough to manipulate. Cash is king.
Quest has shown impressive cash profitability, giving it the option to reinvest or return capital to investors. The company’s free cash flow margin averaged 12.4% over the last five years, better than the broader healthcare sector.
Taking a step back, we can see that Quest’s margin dropped by 4.1 percentage points during that time. It may have ticked higher more recently, but shareholders are likely hoping for its margin to at least revert to its historical level. If the longer-term trend returns, it could signal it is in the middle of an investment cycle.
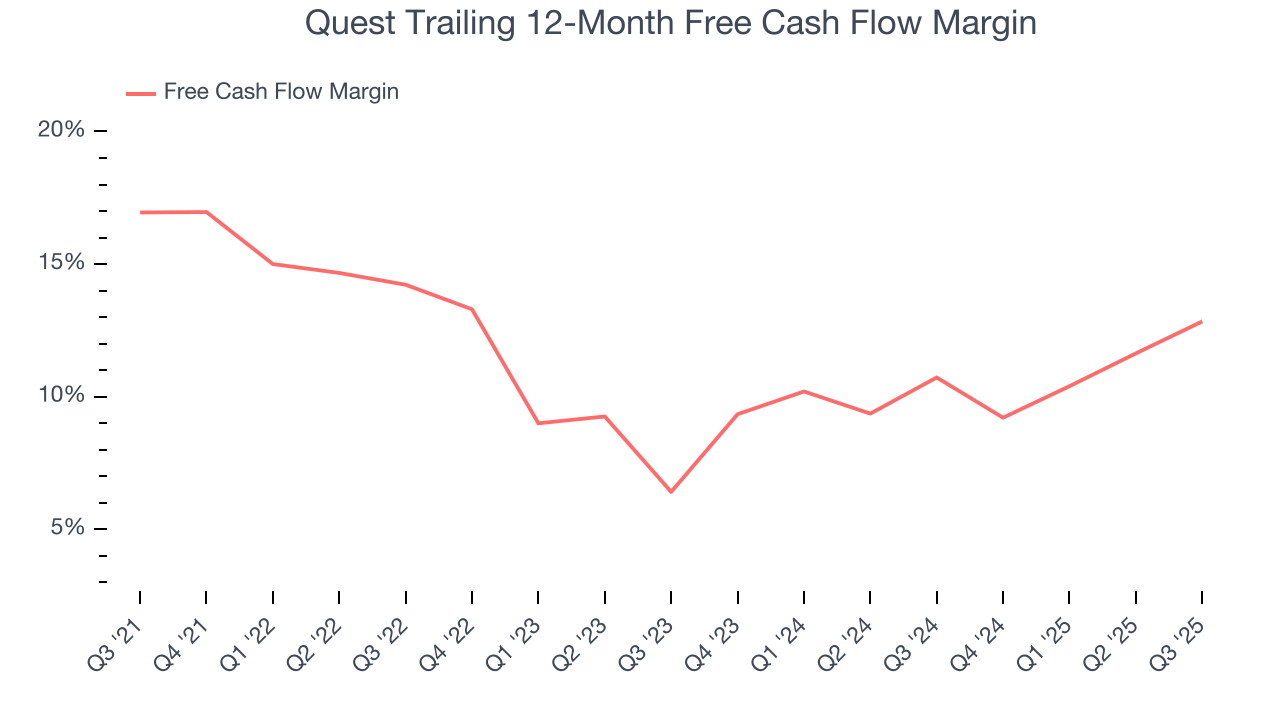
Quest’s free cash flow clocked in at $419 million in Q3, equivalent to a 14.9% margin. This result was good as its margin was 4.8 percentage points higher than in the same quarter last year, but we wouldn’t put too much weight on the short term because investment needs can be seasonal, causing temporary swings. Long-term trends are more important.
10. Return on Invested Capital (ROIC)
EPS and free cash flow tell us whether a company was profitable while growing its revenue. But was it capital-efficient? Enter ROIC, a metric showing how much operating profit a company generates relative to the money it has raised (debt and equity).
Although Quest hasn’t been the highest-quality company lately, it historically found a few growth initiatives that worked. Its five-year average ROIC was 12.3%, higher than most healthcare businesses.
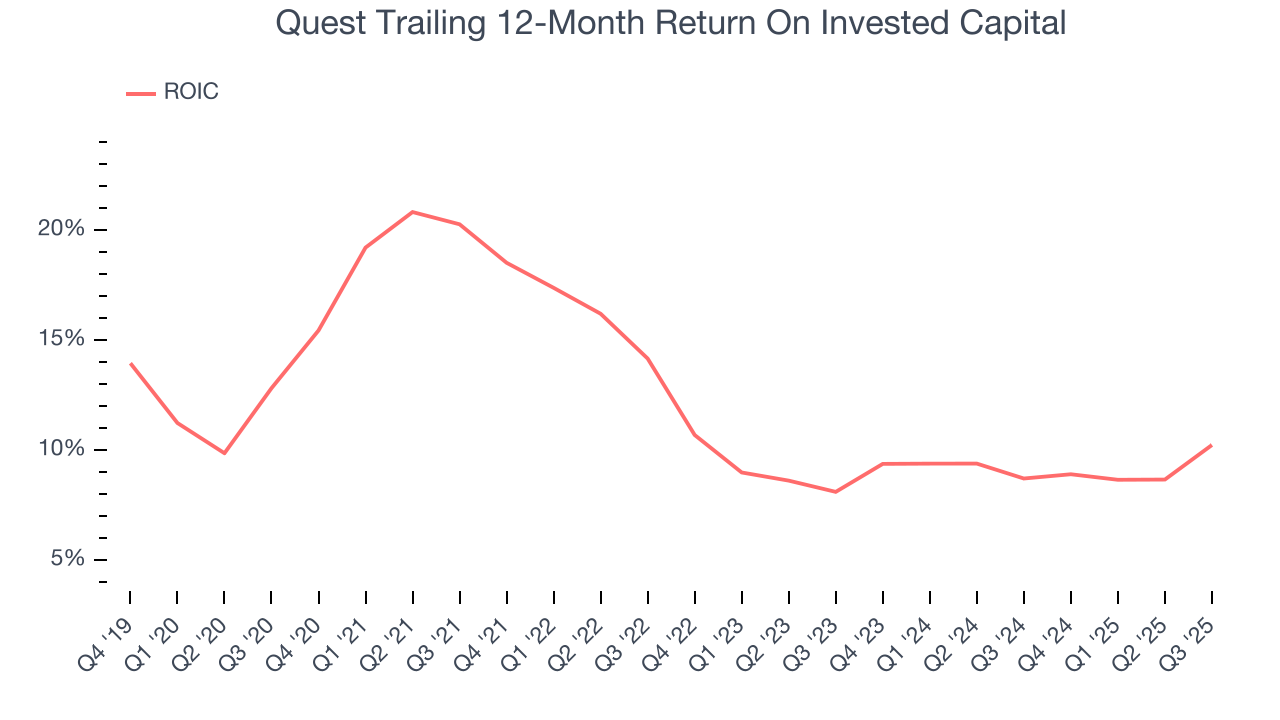
We like to invest in businesses with high returns, but the trend in a company’s ROIC is what often surprises the market and moves the stock price. Over the last few years, Quest’s ROIC has unfortunately decreased. We like what management has done in the past, but its declining returns are perhaps a symptom of fewer profitable growth opportunities.
11. Balance Sheet Assessment
Quest reported $432 million of cash and $6.38 billion of debt on its balance sheet in the most recent quarter. As investors in high-quality companies, we primarily focus on two things: 1) that a company’s debt level isn’t too high and 2) that its interest payments are not excessively burdening the business.
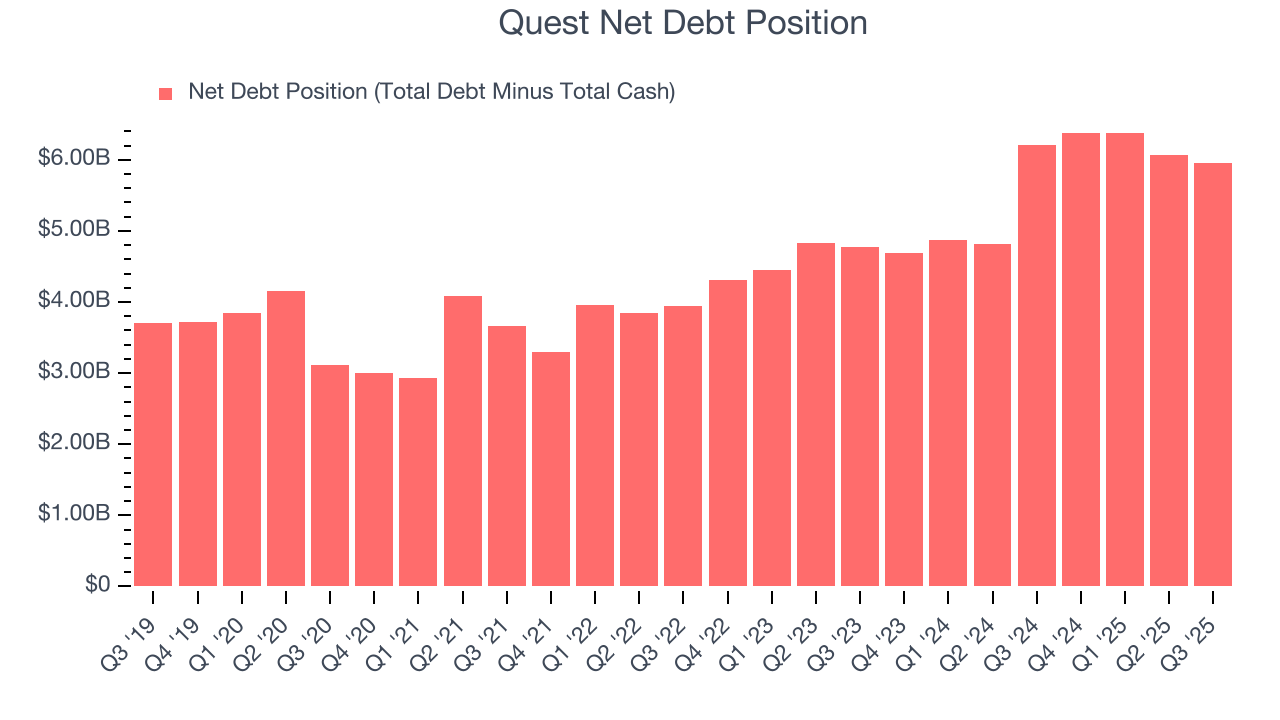
With $2.14 billion of EBITDA over the last 12 months, we view Quest’s 2.8× net-debt-to-EBITDA ratio as safe. We also see its $265 million of annual interest expenses as appropriate. The company’s profits give it plenty of breathing room, allowing it to continue investing in growth initiatives.
12. Key Takeaways from Quest’s Q3 Results
We enjoyed seeing Quest beat analysts’ revenue and EPS expectations this quarter. We were also glad its full-year revenue guidance slightly exceeded Wall Street’s estimates. Overall, we think this was a solid quarter with some key areas of upside. The stock traded up 2.4% to $195 immediately after reporting.
13. Is Now The Time To Buy Quest?
Updated: January 24, 2026 at 11:09 PM EST
Before deciding whether to buy Quest or pass, we urge investors to consider business quality, valuation, and the latest quarterly results.
Quest isn’t a terrible business, but it isn’t one of our picks. To kick things off, its revenue growth was mediocre over the last five years, and analysts expect its demand to deteriorate over the next 12 months. And while its sturdy operating margins show it has disciplined cost controls, the downside is its declining adjusted operating margin shows the business has become less efficient. On top of that, its diminishing returns show management's prior bets haven't worked out.
Quest’s P/E ratio based on the next 12 months is 17.9x. This valuation is reasonable, but the company’s shakier fundamentals present too much downside risk. We're pretty confident there are superior stocks to buy right now.
Wall Street analysts have a consensus one-year price target of $198.38 on the company (compared to the current share price of $181.75).