D.R. Horton (DHI)
We wouldn’t recommend D.R. Horton. Its poor sales growth and falling returns on capital suggest its growth opportunities are shrinking.― StockStory Analyst Team
1. News


2. Summary
Why We Think D.R. Horton Will Underperform
One of the largest homebuilding companies in the U.S., D.R. Horton (NYSE:DHI) builds a variety of new construction homes across multiple markets.
- Sales tumbled by 3.4% annually over the last two years, showing market trends are working against its favor during this cycle
- Earnings per share have contracted by 11% annually over the last two years, a headwind for returns as stock prices often echo long-term EPS performance
- Product roadmap and go-to-market strategy need to be reconsidered as its backlog has averaged 13.9% declines over the past two years


D.R. Horton doesn’t check our boxes. We believe there are better opportunities elsewhere.
Why There Are Better Opportunities Than D.R. Horton


At $150.36 per share, D.R. Horton trades at 14.6x forward P/E. Yes, this valuation multiple is lower than that of other industrials peers, but we’ll remind you that you often get what you pay for.
It’s better to pay up for high-quality businesses with higher long-term earnings potential rather than to buy lower-quality stocks because they appear cheap. These challenged businesses often don’t re-rate, a phenomenon known as a “value trap”.
3. D.R. Horton (DHI) Research Report: Q4 CY2025 Update
Homebuilder D.R. Horton (NYSE:DHI) beat Wall Street’s revenue expectations in Q4 CY2025, but sales fell by 9.5% year on year to $6.89 billion. The company expects the full year’s revenue to be around $34.25 billion, close to analysts’ estimates. Its GAAP profit of $2.03 per share was 5.9% above analysts’ consensus estimates.
D.R. Horton (DHI) Q4 CY2025 Highlights:
- Revenue: $6.89 billion vs analyst estimates of $6.66 billion (9.5% year-on-year decline, 3.4% beat)
- EPS (GAAP): $2.03 vs analyst estimates of $1.92 (5.9% beat)
- The company reconfirmed its revenue guidance for the full year of $34.25 billion at the midpoint
- Operating Margin: 10.6%, down from 13.6% in the same quarter last year
- Free Cash Flow Margin: 12%, up from 8.3% in the same quarter last year
- Backlog: $4.31 billion at quarter end, in line with the same quarter last year
- Market Capitalization: $45.55 billion
Company Overview
One of the largest homebuilding companies in the U.S., D.R. Horton (NYSE:DHI) builds a variety of new construction homes across multiple markets.
D.R. Horton, Inc. (NYSE:DHI), the largest U.S. homebuilder by homes closed, operates through its divisions in over a hundred markets across more than thirty states. Founded in the late 1970s in Fort Worth, Texas, the company has expanded and diversified its homebuilding operations geographically through investments, team building, new market entry, and acquisitions.
The company's core business, homebuilding, generates the vast majority of its consolidated revenues. D.R. Horton primarily generates revenue through the sale of completed homes and, to a lesser extent, land and lots, offering a wide range of homes for various buyer segments, including entry-level, move-up, active adult, and luxury.
D.R. Horton's operations also encompass rental (single-family and multi-family), financial services (mortgage financing and title agency services through DHI Mortgage), and a majority stake in Forestar Group Inc., a publicly traded residential lot development company that is key to the company's land and lot position strategy.
The company's success hinges on its ability to manage land acquisitions, development, and inventory to meet housing demand in each market, aiming to maintain a strong market position to minimize the impact of regional economic cycles and provide growth opportunities.
D.R. Horton routinely evaluates opportunities to profitably expand its operations, including potential acquisitions of other homebuilding or related businesses. In recent months, the company acquired the homebuilding operations of Riggins Custom Homes in Northwest Arkansas and Truland Homes in Baldwin County, Alabama, and Northwest Florida. These acquisitions align with D.R. Horton's strategy of expanding operations and maintaining a strong market position in key regions, providing immediate access to land, inventory, and local market expertise.
4. Home Builders
Traditionally, homebuilders have built competitive advantages with economies of scale that lead to advantaged purchasing and brand recognition among consumers. Aesthetic trends have always been important in the space, but more recently, energy efficiency and conservation are driving innovation. However, these companies are still at the whim of the macro, specifically interest rates that heavily impact new and existing home sales. In fact, homebuilders are one of the most cyclical subsectors within industrials.
Other homebuilders operating in D.R. Horton’s market include Lennary (NYSE:LEN), PulteGroup (NYSE:PHM), and NVR (NYSE:NVR).
5. Revenue Growth
A company’s long-term performance is an indicator of its overall quality. Any business can put up a good quarter or two, but many enduring ones grow for years. Over the last five years, D.R. Horton grew its sales at a decent 8.6% compounded annual growth rate. Its growth was slightly above the average industrials company and shows its offerings resonate with customers.
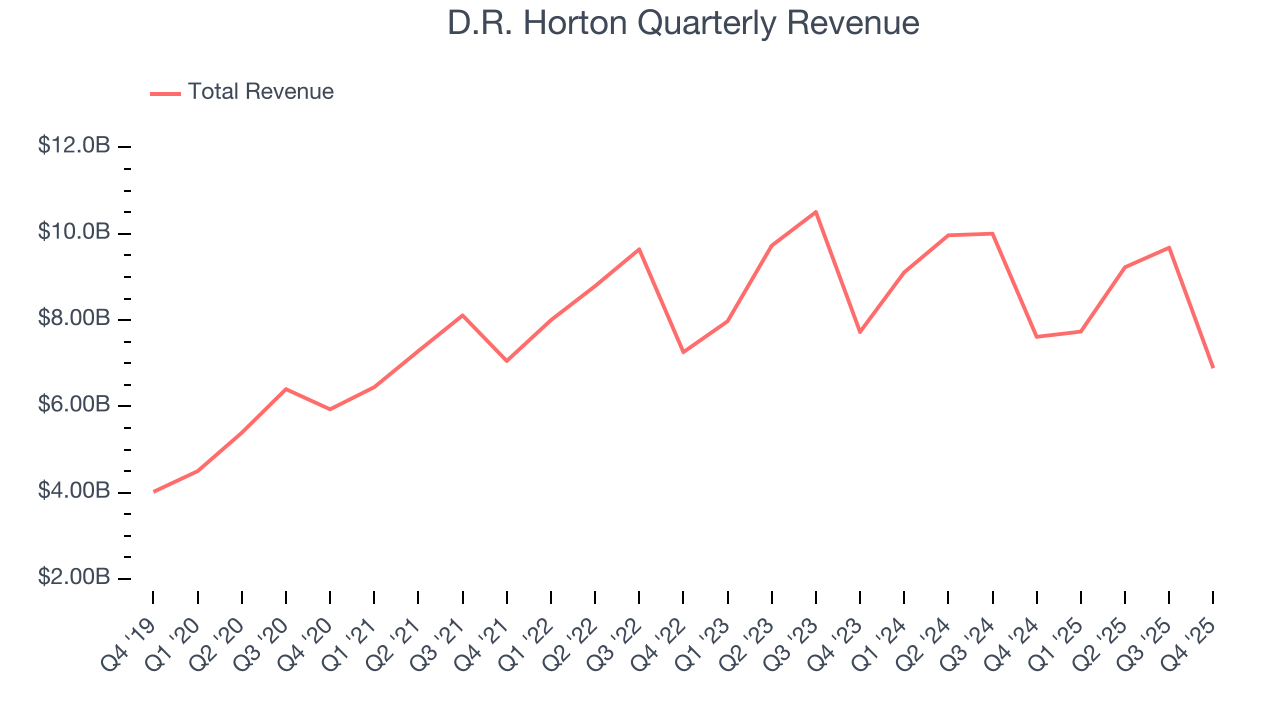
We at StockStory place the most emphasis on long-term growth, but within industrials, a half-decade historical view may miss cycles, industry trends, or a company capitalizing on catalysts such as a new contract win or a successful product line. D.R. Horton’s recent performance marks a sharp pivot from its five-year trend as its revenue has shown annualized declines of 3.4% over the last two years. 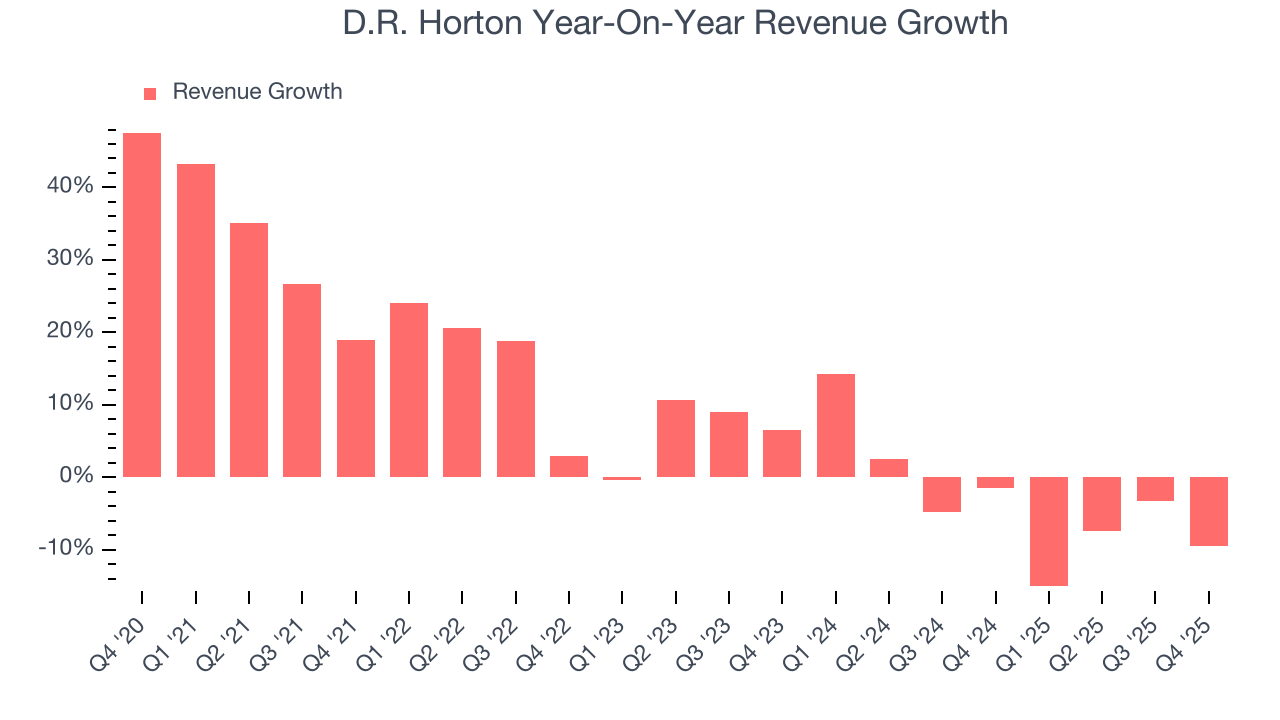
We can dig further into the company’s revenue dynamics by analyzing its backlog, or the value of its outstanding orders that have not yet been executed or delivered. D.R. Horton’s backlog reached $4.31 billion in the latest quarter and averaged 13.9% year-on-year declines over the last two years. Because this number is lower than its revenue growth, we can see the company hasn’t secured enough new orders to maintain its growth rate in the future. 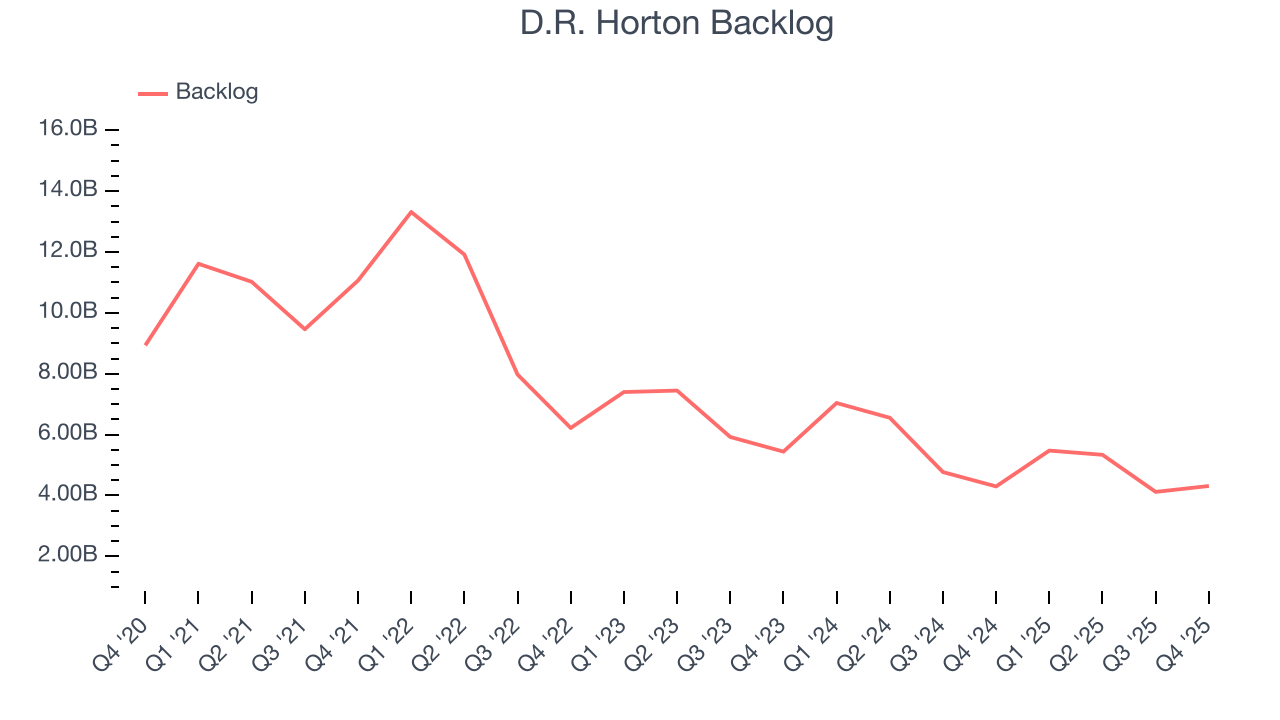
This quarter, D.R. Horton’s revenue fell by 9.5% year on year to $6.89 billion but beat Wall Street’s estimates by 3.4%.
Looking ahead, sell-side analysts expect revenue to grow 3.1% over the next 12 months. Although this projection implies its newer products and services will catalyze better top-line performance, it is still below average for the sector.
6. Gross Margin & Pricing Power
D.R. Horton has bad unit economics for an industrials company, giving it less room to reinvest and develop new offerings. As you can see below, it averaged a 25.6% gross margin over the last five years. Said differently, D.R. Horton had to pay a chunky $74.36 to its suppliers for every $100 in revenue. 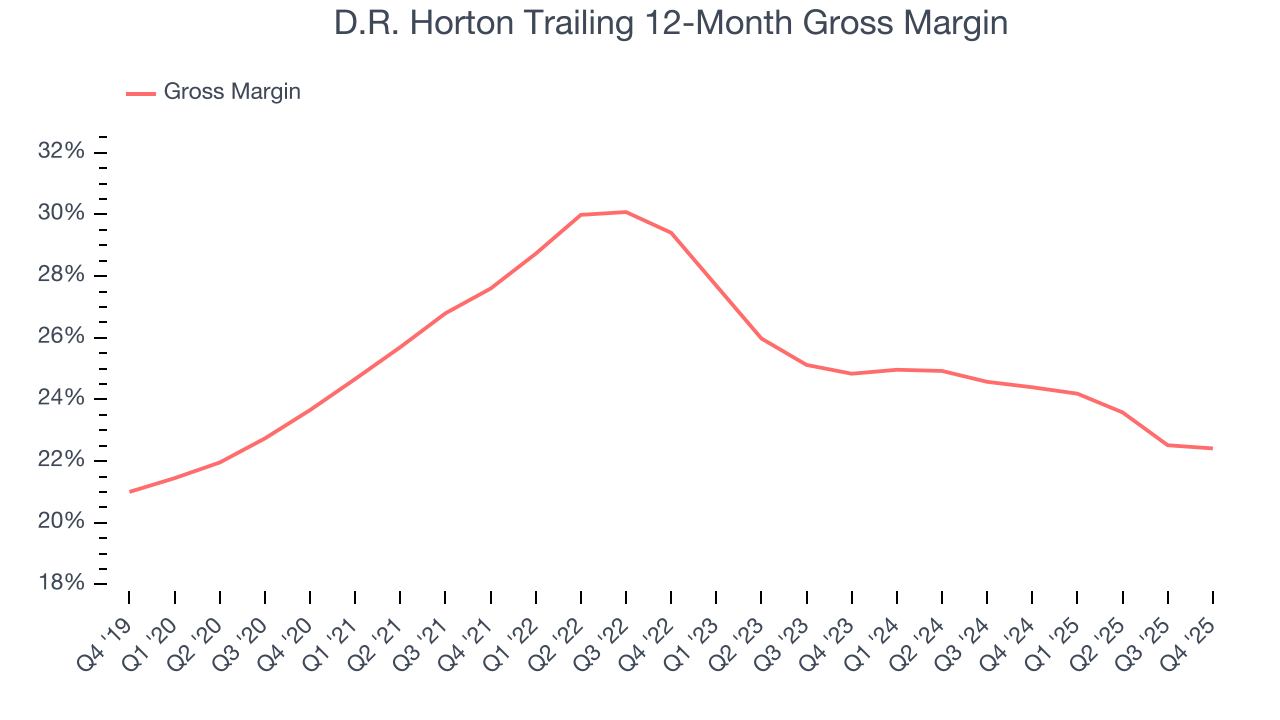
In Q4, D.R. Horton produced a 23.2% gross profit margin, in line with the same quarter last year. On a wider time horizon, D.R. Horton’s full-year margin has been trending down over the past 12 months, decreasing by 2 percentage points. If this move continues, it could suggest a more competitive environment with some pressure to lower prices and higher input costs (such as raw materials and manufacturing expenses).
7. Operating Margin
D.R. Horton has been a well-oiled machine over the last five years. It demonstrated elite profitability for an industrials business, boasting an average operating margin of 17.2%. This result was particularly impressive because of its low gross margin, which is mostly a factor of what it sells and takes huge shifts to move meaningfully. Companies have more control over their operating margins, and it’s a show of well-managed operations if they’re high when gross margins are low.
Looking at the trend in its profitability, D.R. Horton’s operating margin decreased by 7.7 percentage points over the last five years. This raises questions about the company’s expense base because its revenue growth should have given it leverage on its fixed costs, resulting in better economies of scale and profitability.
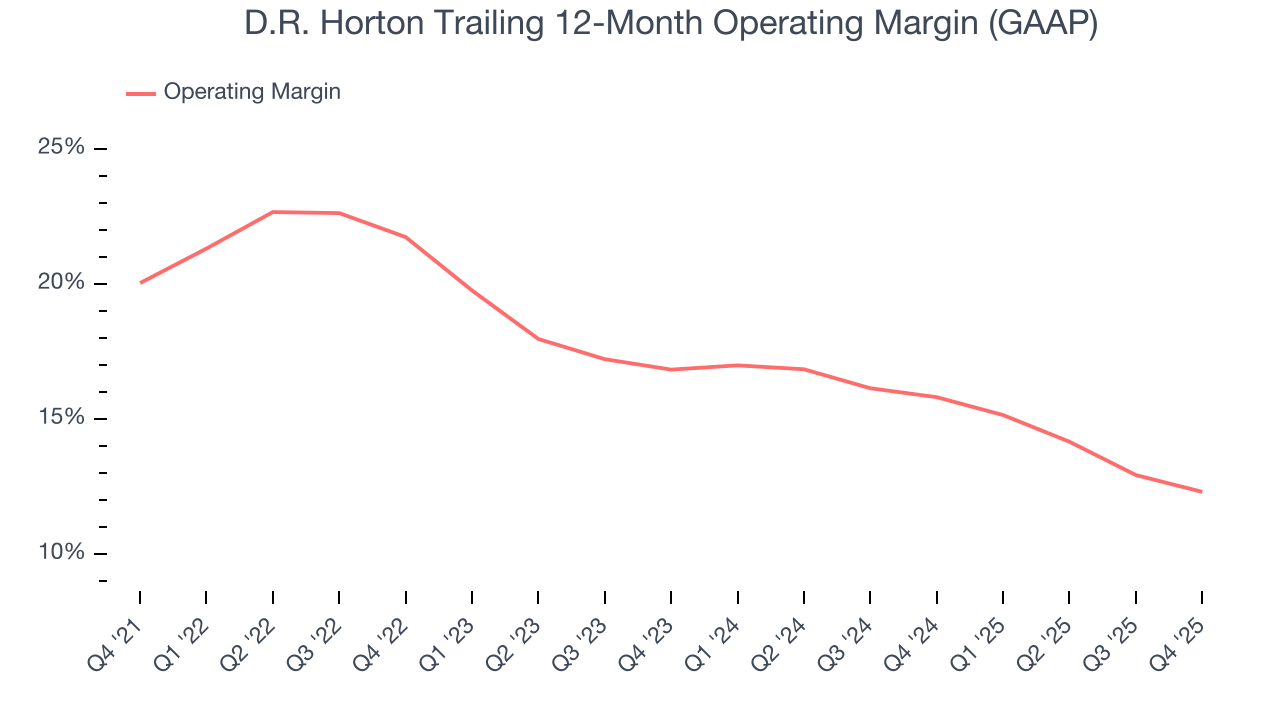
This quarter, D.R. Horton generated an operating margin profit margin of 10.6%, down 3 percentage points year on year. Since D.R. Horton’s operating margin decreased more than its gross margin, we can assume it was less efficient because expenses such as marketing, R&D, and administrative overhead increased.
8. Earnings Per Share
Revenue trends explain a company’s historical growth, but the long-term change in earnings per share (EPS) points to the profitability of that growth – for example, a company could inflate its sales through excessive spending on advertising and promotions.
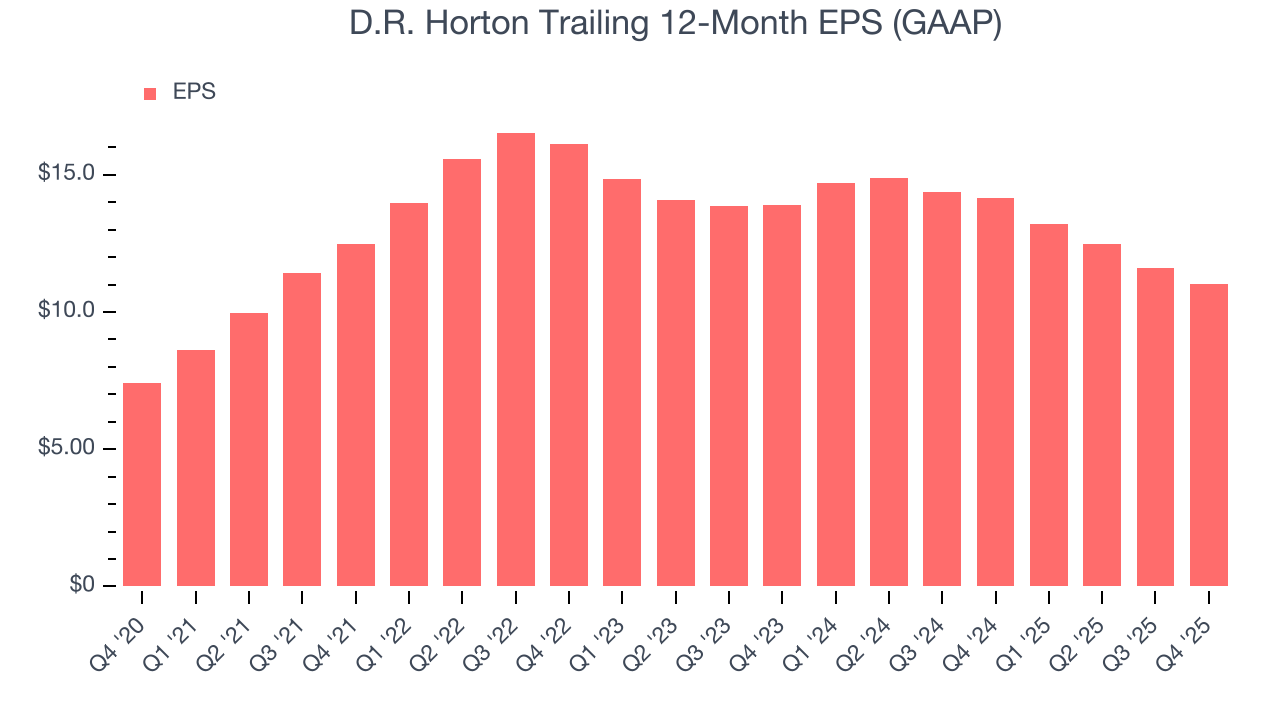
D.R. Horton’s decent 8.3% annual EPS growth over the last five years aligns with its revenue performance. This tells us it maintained its per-share profitability as it expanded.
Like with revenue, we analyze EPS over a more recent period because it can provide insight into an emerging theme or development for the business.
D.R. Horton’s two-year annual EPS declines of 11% were bad and lower than its two-year revenue losses.
We can take a deeper look into D.R. Horton’s earnings to better understand the drivers of its performance. D.R. Horton’s operating margin has declined over the last two years. This was the most relevant factor (aside from the revenue impact) behind its lower earnings; interest expenses and taxes can also affect EPS but don’t tell us as much about a company’s fundamentals.
In Q4, D.R. Horton reported EPS of $2.03, down from $2.61 in the same quarter last year. Despite falling year on year, this print beat analysts’ estimates by 5.9%. Over the next 12 months, Wall Street expects D.R. Horton’s full-year EPS of $11.02 to grow 4.3%.
9. Cash Is King
If you’ve followed StockStory for a while, you know we emphasize free cash flow. Why, you ask? We believe that in the end, cash is king, and you can’t use accounting profits to pay the bills.
D.R. Horton has shown decent cash profitability, giving it some flexibility to reinvest or return capital to investors. The company’s free cash flow margin averaged 6.7% over the last five years, slightly better than the broader industrials sector.
Taking a step back, we can see that D.R. Horton’s margin expanded by 8.9 percentage points during that time. This is encouraging, and we can see it became a less capital-intensive business because its free cash flow profitability rose while its operating profitability fell.
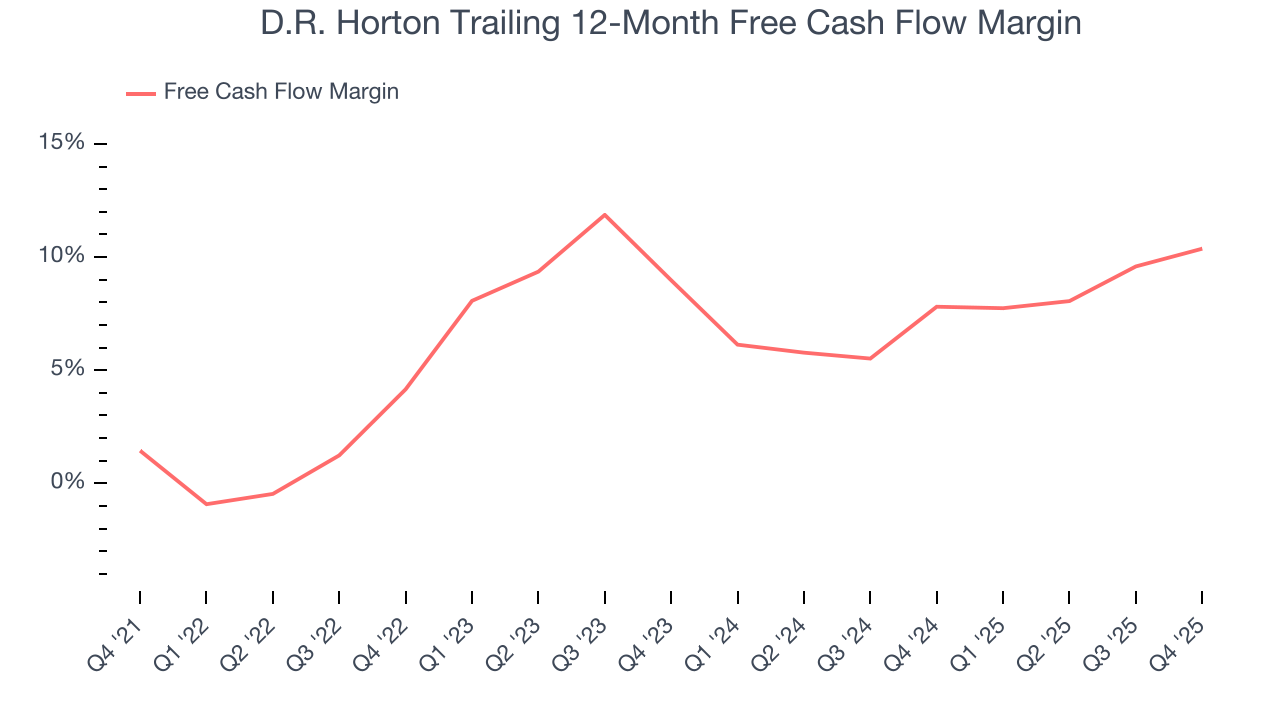
D.R. Horton’s free cash flow clocked in at $826.6 million in Q4, equivalent to a 12% margin. This result was good as its margin was 3.7 percentage points higher than in the same quarter last year, building on its favorable historical trend.
10. Return on Invested Capital (ROIC)
EPS and free cash flow tell us whether a company was profitable while growing its revenue. But was it capital-efficient? Enter ROIC, a metric showing how much operating profit a company generates relative to the money it has raised (debt and equity).
Although D.R. Horton hasn’t been the highest-quality company lately, it found a few growth initiatives in the past that worked out wonderfully. Its five-year average ROIC was 20.8%, splendid for an industrials business.
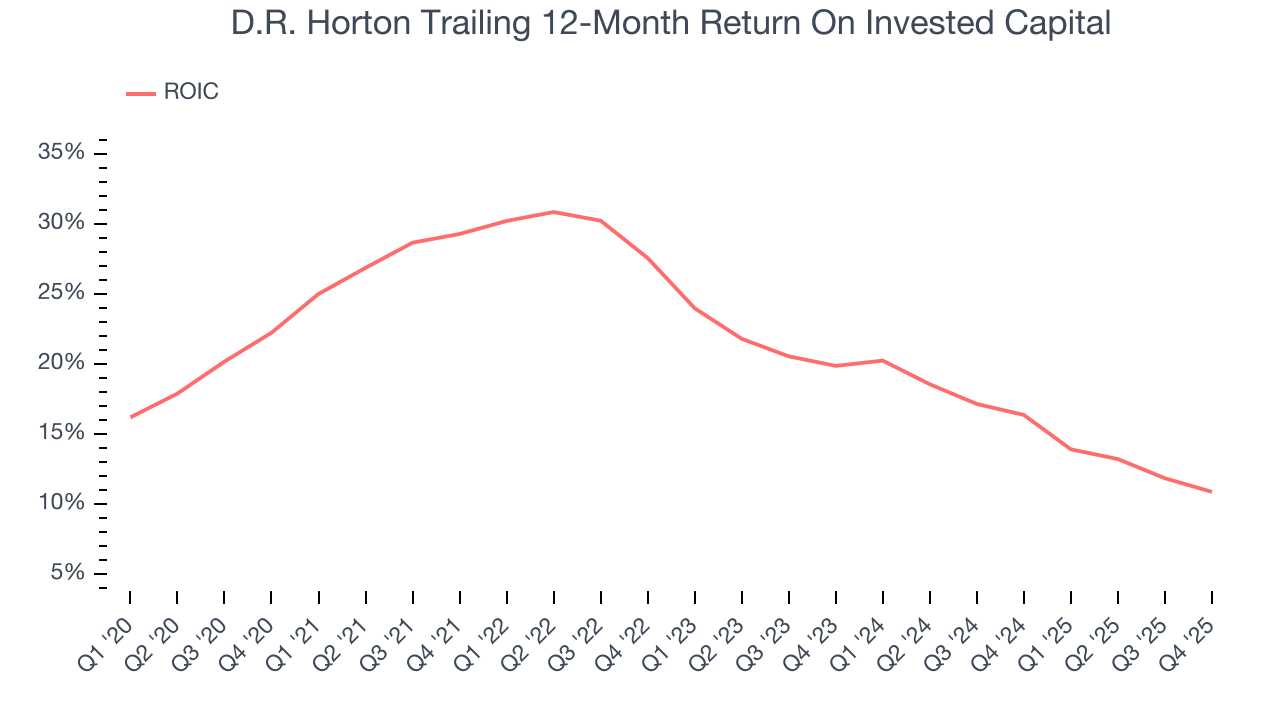
We like to invest in businesses with high returns, but the trend in a company’s ROIC is what often surprises the market and moves the stock price. Over the last few years, D.R. Horton’s ROIC has unfortunately decreased significantly. We like what management has done in the past, but its declining returns are perhaps a symptom of fewer profitable growth opportunities.
11. Balance Sheet Assessment
D.R. Horton reported $2.55 billion of cash and $5.55 billion of debt on its balance sheet in the most recent quarter. As investors in high-quality companies, we primarily focus on two things: 1) that a company’s debt level isn’t too high and 2) that its interest payments are not excessively burdening the business.
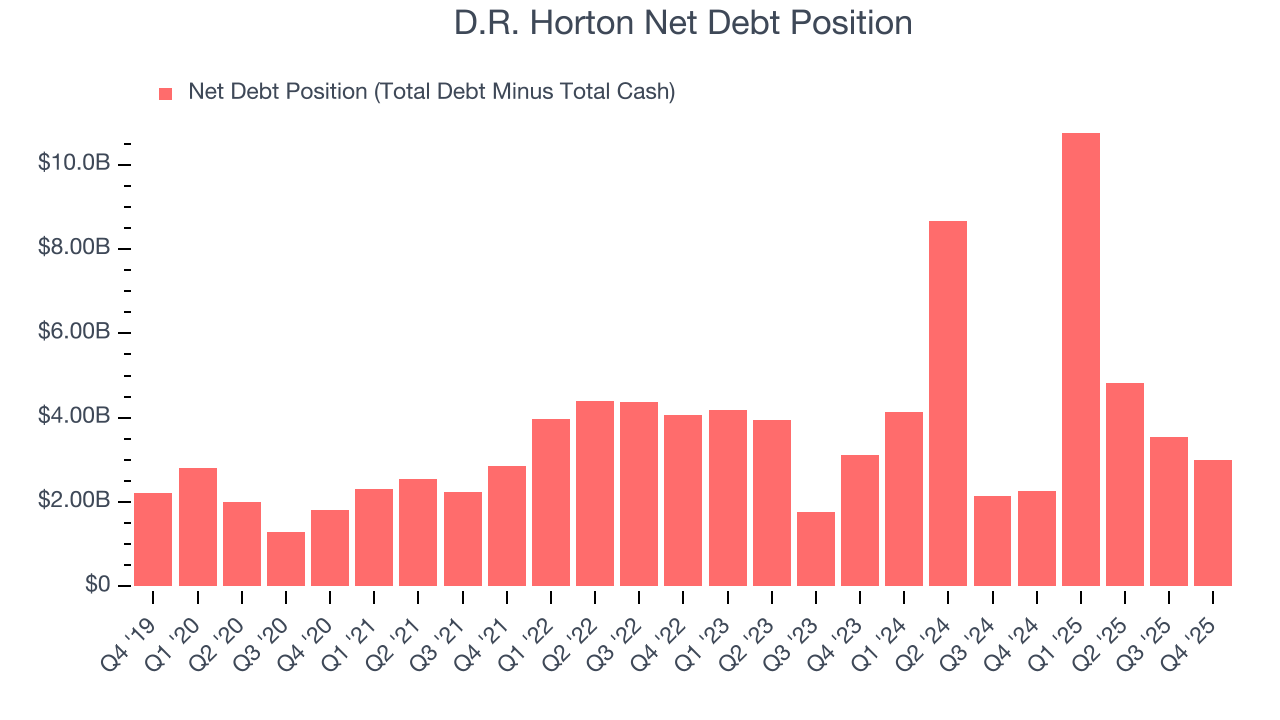
With $4.27 billion of EBITDA over the last 12 months, we view D.R. Horton’s 0.7× net-debt-to-EBITDA ratio as safe. We also see its $180.2 million of annual interest expenses as appropriate. The company’s profits give it plenty of breathing room, allowing it to continue investing in growth initiatives.
12. Key Takeaways from D.R. Horton’s Q4 Results
We enjoyed seeing D.R. Horton beat analysts’ revenue expectations this quarter. We were also glad its EPS outperformed Wall Street’s estimates. On the other hand, its backlog missed. Overall, this was still a solid quarter. The stock traded up 1.7% to $158.55 immediately after reporting.
13. Is Now The Time To Buy D.R. Horton?
Updated: January 24, 2026 at 10:16 PM EST
Before investing in or passing on D.R. Horton, we urge you to understand the company’s business quality (or lack thereof), valuation, and the latest quarterly results - in that order.
We cheer for all companies making their customers lives easier, but in the case of D.R. Horton, we’ll be cheering from the sidelines. Although its revenue growth was good over the last five years, it’s expected to deteriorate over the next 12 months and its diminishing returns show management's prior bets haven't worked out. And while the company’s rising cash profitability gives it more optionality, the downside is its projected EPS for the next year is lacking.
D.R. Horton’s P/E ratio based on the next 12 months is 14.6x. This valuation is reasonable, but the company’s shaky fundamentals present too much downside risk. There are better stocks to buy right now.
Wall Street analysts have a consensus one-year price target of $161.50 on the company (compared to the current share price of $150.36).