
Darden (DRI)
We’re not sold on Darden. Its weak revenue growth and gross margin show it not only lacks demand but also decent unit economics.― StockStory Analyst Team
1. News

2. Summary
Why Darden Is Not Exciting
Founded in 1968 as Red Lobster, Darden (NYSE:DRI) is a leading American restaurant company that owns and operates a portfolio of popular restaurant brands.
- Challenging supply chain dynamics and bad unit economics are reflected in its low gross margin of 21.7%
- The company has faced growth challenges as its 6.1% annual revenue increases over the last seven years fell short of other restaurant companies
- On the bright side, its unparalleled revenue scale of $12.76 billion offsets its poor gross margin and gives it advantageous pricing and terms with suppliers


Darden doesn’t pass our quality test. We’ve identified better opportunities elsewhere.
Why There Are Better Opportunities Than Darden


At $197.50 per share, Darden trades at 17.2x forward P/E. This multiple is lower than most restaurant companies, but for good reason.
It’s better to pay up for high-quality businesses with higher long-term earnings potential rather than to buy lower-quality stocks because they appear cheap. These challenged businesses often don’t re-rate, a phenomenon known as a “value trap”.
3. Darden (DRI) Research Report: Q1 CY2026 Update
Restaurant company Darden (NYSE:DRI) met Wall Street’s revenue expectations in Q1 CY2026, with sales up 5.9% year on year to $3.35 billion. Its non-GAAP profit of $2.95 per share was in line with analysts’ consensus estimates.
Darden (DRI) Q1 CY2026 Highlights:
- Revenue: $3.35 billion vs analyst estimates of $3.33 billion (5.9% year-on-year growth, in line)
- Adjusted EPS: $2.95 vs analyst estimates of $2.94 (in line)
- Management slightly raised its full-year Adjusted EPS guidance to $10.62 at the midpoint
- Operating Margin: 12.1%, down from 13.2% in the same quarter last year
- Free Cash Flow Margin: 13.4%, similar to the same quarter last year
- Locations: 2,196 at quarter end, up from 2,165 in the same quarter last year
- Same-Store Sales rose 4.2% year on year (0.7% in the same quarter last year)
- Market Capitalization: $23.11 billion
Company Overview
Founded in 1968 as Red Lobster, Darden (NYSE:DRI) is a leading American restaurant company that owns and operates a portfolio of popular restaurant brands.
Although it no longer owns Red Lobster (sold to private equity firm Golden Gate Capital in 2014), Darden has expanded its banners through acquisitions, including iconic full-service restaurant chains such as Olive Garden, LongHorn Steakhouse, Cheddar's Scratch Kitchen, Yard House, The Capital Grille, Seasons 52, and Bahama Breeze.
Each brand offers a unique culinary experience, showcasing a range of flavors, cuisines, and atmospheres to suit various tastes and dining preferences. For example, casual diners can indulge in unlimited breadsticks and beloved Italian classics at Olive Garden while fine diners can enjoy a perfectly grilled steak at any of The Capital Grille’s upscale locations.
Despite these differences, the unifying theme between Darden’s restaurants is a commitment to exceptional customer service. The company places great emphasis on providing warm and welcoming environments, ensuring that guests feel at home as soon as they step through its restaurants’ doors.
Darden has also embraced technology to meet the evolving demands of the modern dining landscape. Many of its banners offer online reservation systems and convenient mobile apps for easy booking and ordering. These digital innovations streamline the dining process, providing customers with greater convenience and flexibility.
4. Sit-Down Dining
Sit-down restaurants offer a complete dining experience with table service. These establishments span various cuisines and are renowned for their warm hospitality and welcoming ambiance, making them perfect for family gatherings, special occasions, or simply unwinding. Their extensive menus range from appetizers to indulgent desserts and wines and cocktails. This space is extremely fragmented and competition includes everything from publicly-traded companies owning multiple chains to single-location mom-and-pop restaurants.
Multi-brand full-service restaurant competitors include Bloomin’ Brands (NASDAQ:BLMN), Brinker International (NYSE:EAT), Dine Brands (NYSE:DIN), Texas Roadhouse (NASDAQ:TXRH), and The Cheesecake Factory (NASDAQ:CAKE).
5. Revenue Growth
A company’s long-term sales performance can indicate its overall quality. Even a bad business can shine for one or two quarters, but a top-tier one grows for years.
With $12.76 billion in revenue over the past 12 months, Darden is one of the most widely recognized restaurant chains and benefits from customer loyalty, a luxury many don’t have. Its scale also gives it negotiating leverage with suppliers, enabling it to source its ingredients at a lower cost. However, its scale is a double-edged sword because there is only so much real estate to build restaurants, placing a ceiling on its growth. To expand meaningfully, Darden likely needs to tweak its prices, start new chains, or enter new markets.
As you can see below, Darden’s sales grew at a mediocre 6.1% compounded annual growth rate over the last seven years, but to its credit, it opened new restaurants and increased sales at existing, established dining locations.
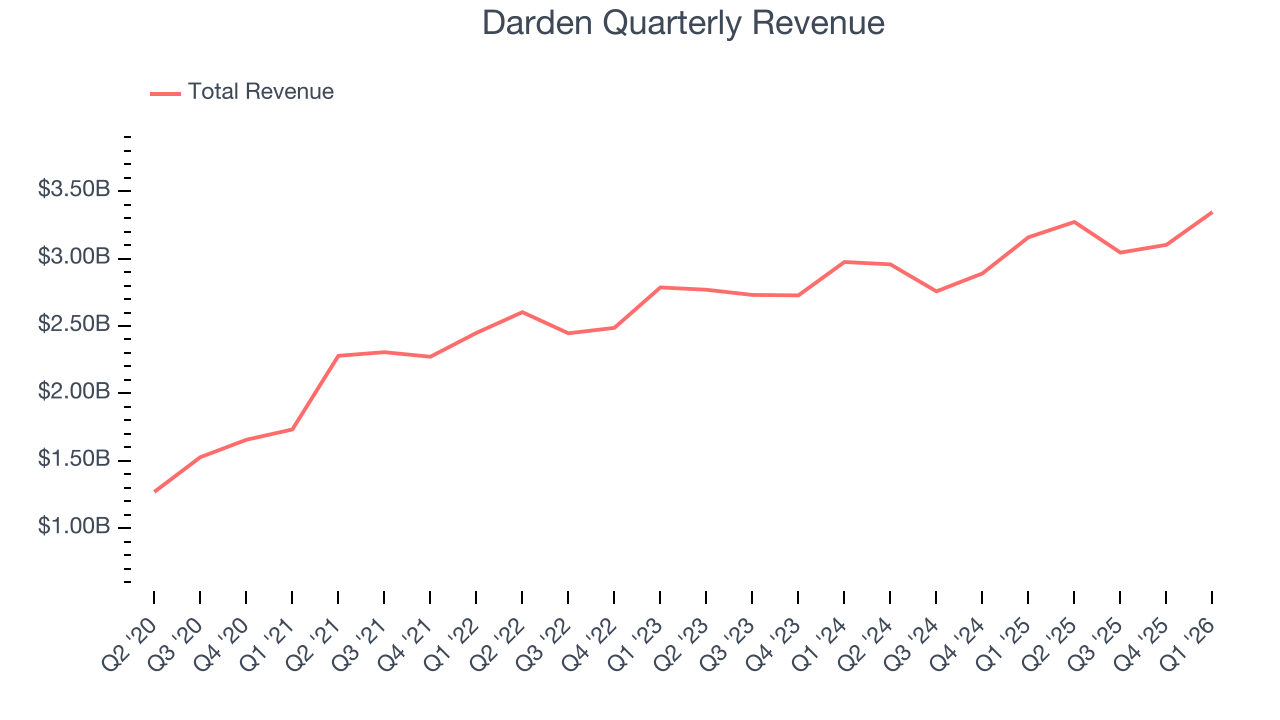
This quarter, Darden grew its revenue by 5.9% year on year, and its $3.35 billion of revenue was in line with Wall Street’s estimates.
Looking ahead, sell-side analysts expect revenue to grow 7.4% over the next 12 months, similar to its seven-year rate. This projection is above average for the sector and suggests its newer menu offerings will spur better top-line performance.
6. Restaurant Performance
Number of Restaurants
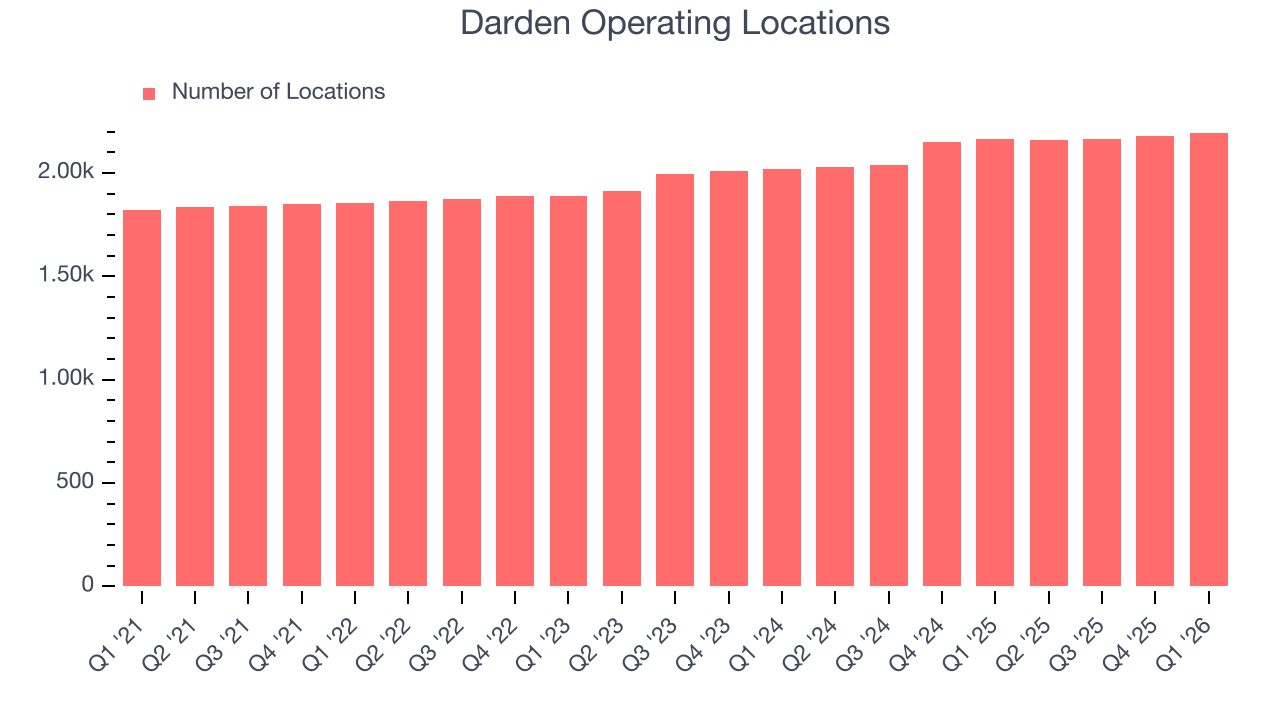
The number of dining locations a restaurant chain operates is a critical driver of how quickly company-level sales can grow.
Darden sported 2,196 locations in the latest quarter. Over the last two years, it has opened new restaurants at a rapid clip by averaging 4.7% annual growth, among the fastest in the restaurant sector.
When a chain opens new restaurants, it usually means it’s investing for growth because there’s healthy demand for its meals and there are markets where its concepts have few or no locations.
Same-Store Sales
A company's restaurant base only paints one part of the picture. When demand is high, it makes sense to open more. But when demand is low, it’s prudent to close some locations and use the money in other ways. Same-store sales gives us insight into this topic because it measures organic growth at restaurants open for at least a year.
Darden’s demand rose over the last two years and slightly outpaced the industry. On average, the company’s same-store sales have grown by 2.5% per year. This performance suggests its rollout of new restaurants could be beneficial for shareholders. When a chain has demand, more locations should help it reach more customers and boost revenue growth.
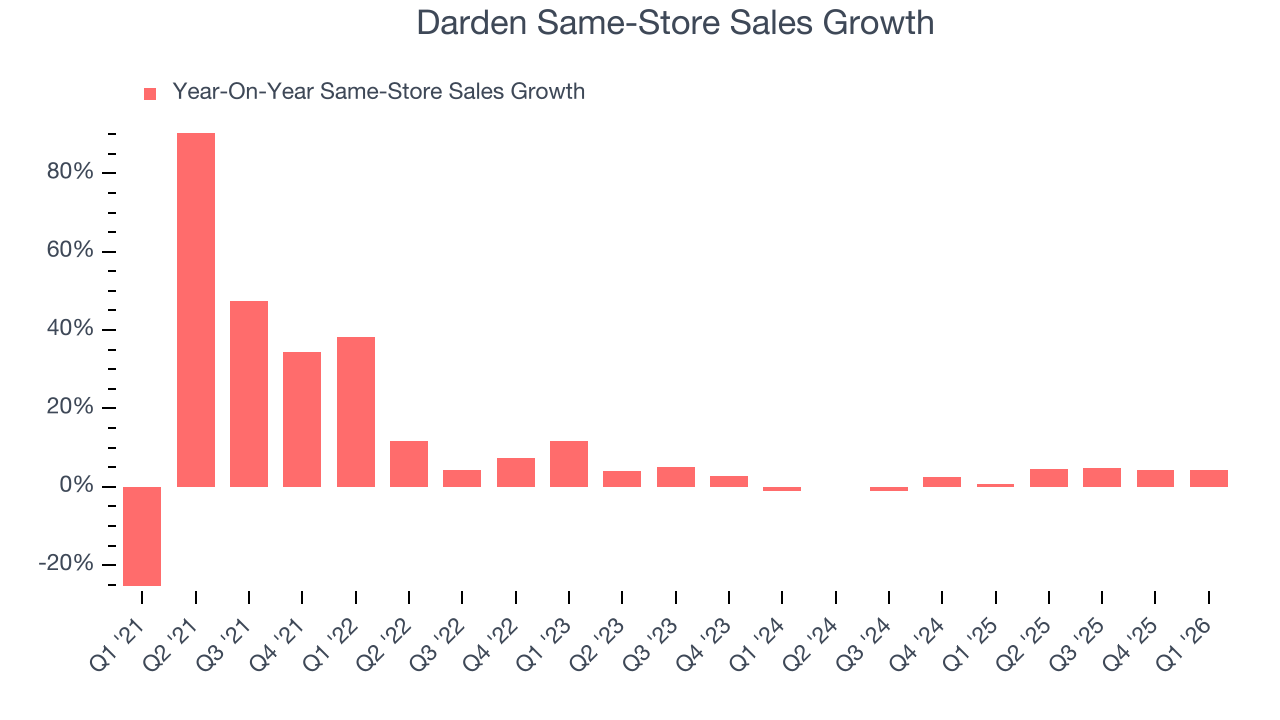
In the latest quarter, Darden’s same-store sales rose 4.2% year on year. This growth was an acceleration from its historical levels, which is always an encouraging sign.
7. Gross Margin & Pricing Power
Darden has bad unit economics for a restaurant company, giving it less room to reinvest and grow its presence. As you can see below, it averaged a 21.7% gross margin over the last two years. That means Darden paid its suppliers a lot of money ($78.27 for every $100 in revenue) to run its business. 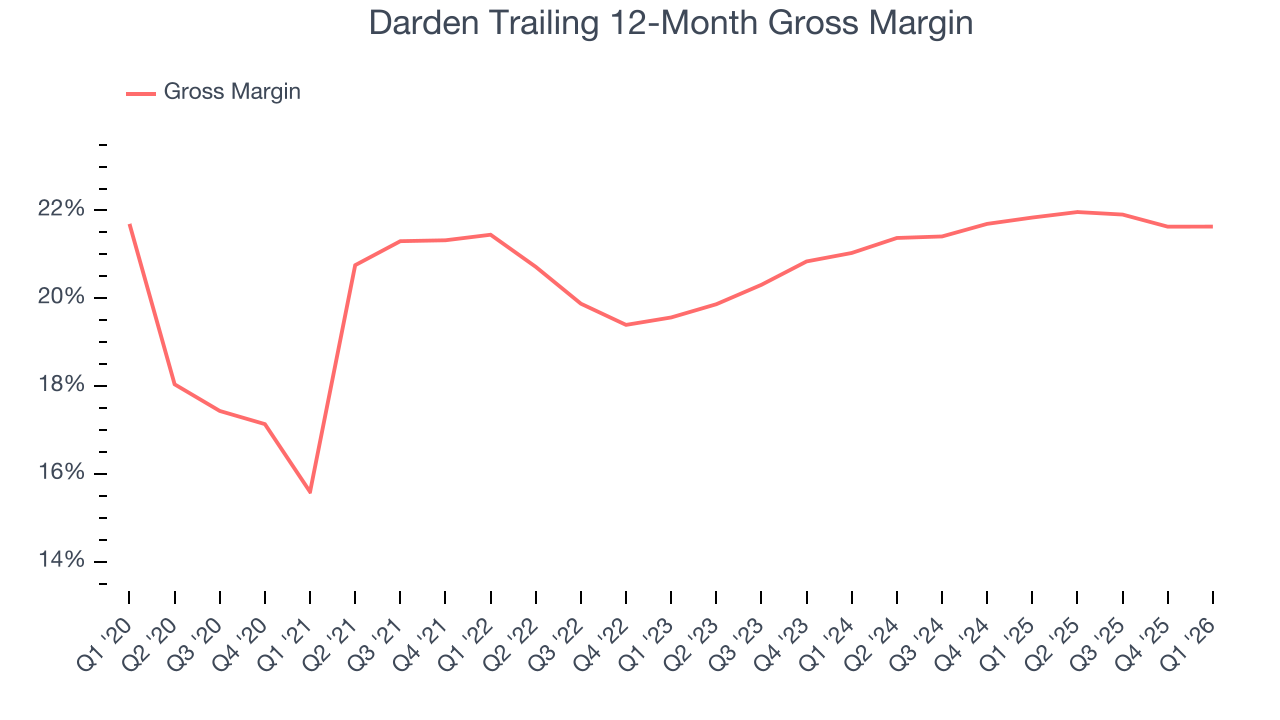
This quarter, Darden’s gross profit margin was 22.2%, in line with the same quarter last year. On a wider time horizon, the company’s full-year margin has remained steady over the past four quarters, suggesting its input costs (such as ingredients and transportation expenses) have been stable and it isn’t under pressure to lower prices.
8. Operating Margin
Darden’s operating margin has more or less stayed the same over the last 12 months , averaging 11.5% over the last two years. This profitability was solid for a restaurant business and shows it’s an efficient company that manages its expenses well. This result was particularly impressive because of its low gross margin, which is mostly a factor of what it sells and takes huge shifts to move meaningfully. Companies have more control over their operating margins, and it’s a show of well-managed operations if they’re high when gross margins are low.
Looking at the trend in its profitability, Darden’s operating margin might fluctuated slightly but has generally stayed the same over the last year. This raises questions about the company’s expense base because its revenue growth should have given it leverage on its fixed costs, resulting in better economies of scale and profitability.
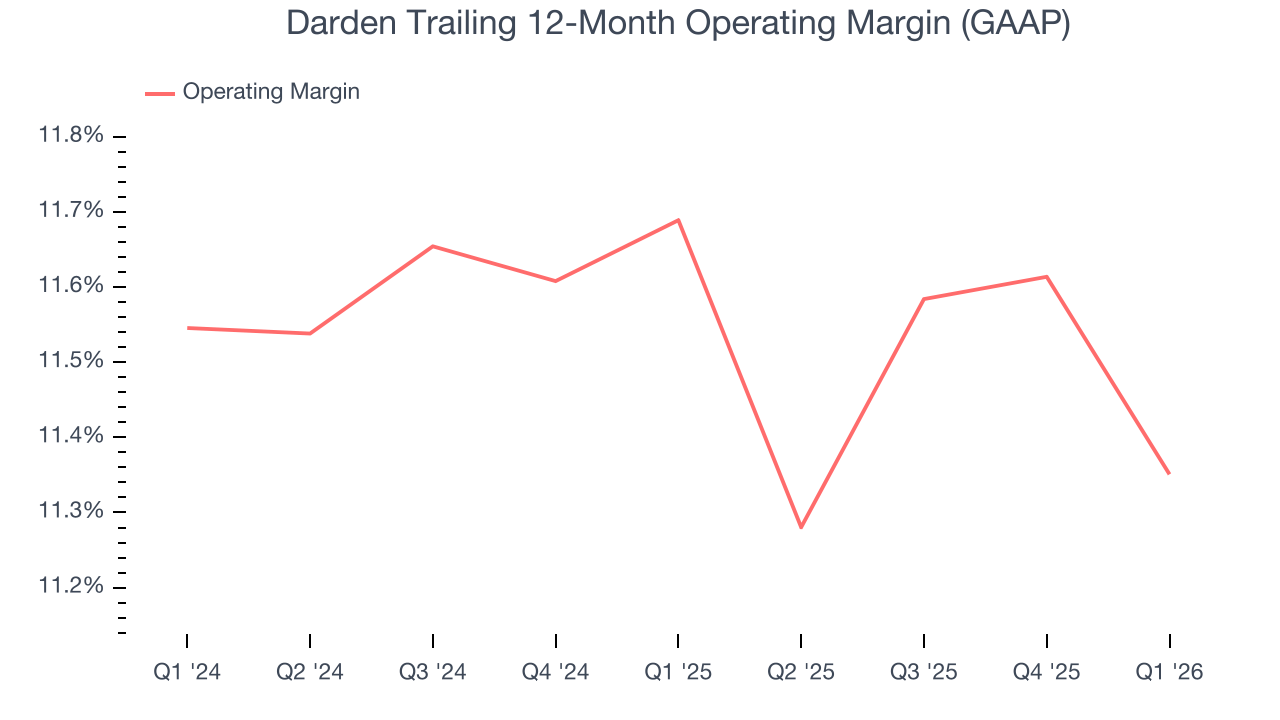
This quarter, Darden generated an operating margin profit margin of 12.1%, down 1.1 percentage points year on year. Since Darden’s operating margin decreased more than its gross margin, we can assume it was less efficient because expenses such as marketing, and administrative overhead increased.
9. Earnings Per Share
We track the long-term change in earnings per share (EPS) for the same reason as long-term revenue growth. Compared to revenue, however, EPS highlights whether a company’s growth is profitable.
Darden’s EPS grew at 9% compounded annual growth rate over the last seven years. This performance was better than its revenue growth, but we take it with a grain of salt because its operating margin improvement was less than peers and it didn’t repurchase its shares, meaning the delta came from reduced interest expenses or taxes.
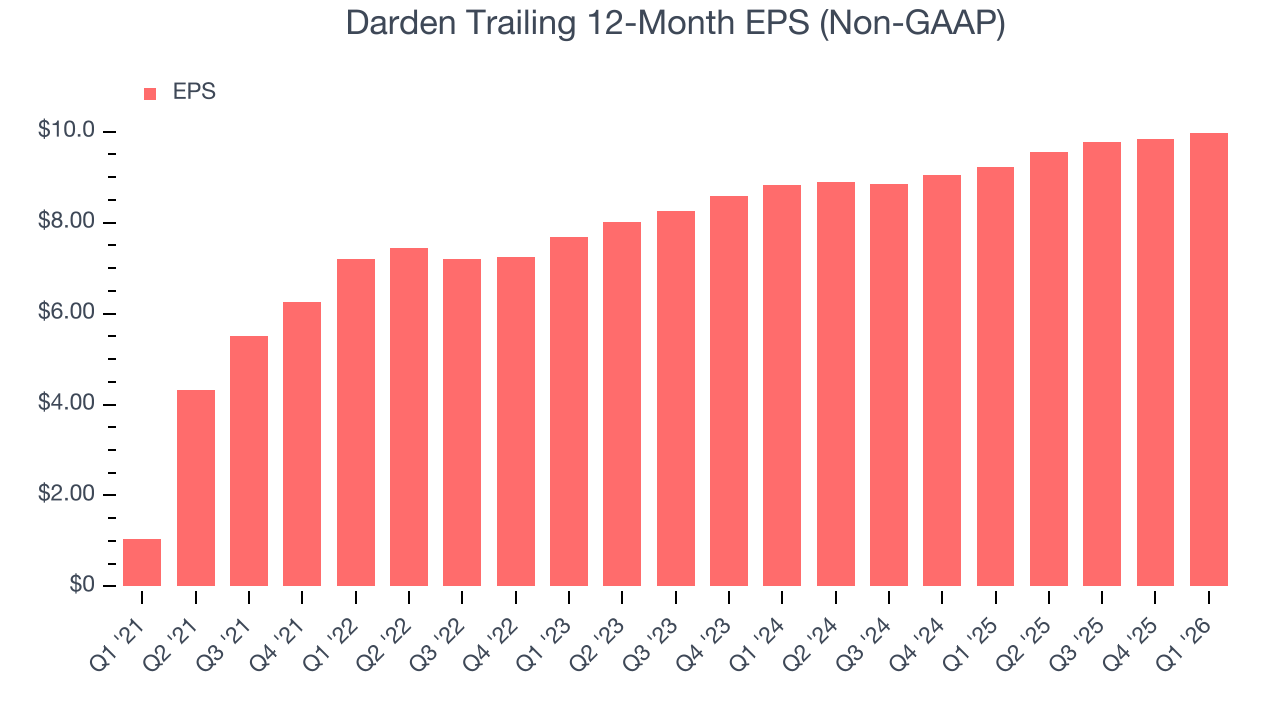
In Q1, Darden reported adjusted EPS of $2.95, up from $2.80 in the same quarter last year. This print was close to analysts’ estimates. Over the next 12 months, Wall Street expects Darden’s full-year EPS of $9.98 to grow 13.8%.
10. Cash Is King
Free cash flow isn't a prominently featured metric in company financials and earnings releases, but we think it's telling because it accounts for all operating and capital expenses, making it tough to manipulate. Cash is king.
Darden has shown robust cash profitability, giving it an edge over its competitors and the ability to reinvest or return capital to investors. The company’s free cash flow margin averaged 8.5% over the last two years, quite impressive for a restaurant business.
Taking a step back, we can see that Darden’s margin dropped by 1 percentage points over the last year. This decrease came from the higher costs associated with opening more restaurants.
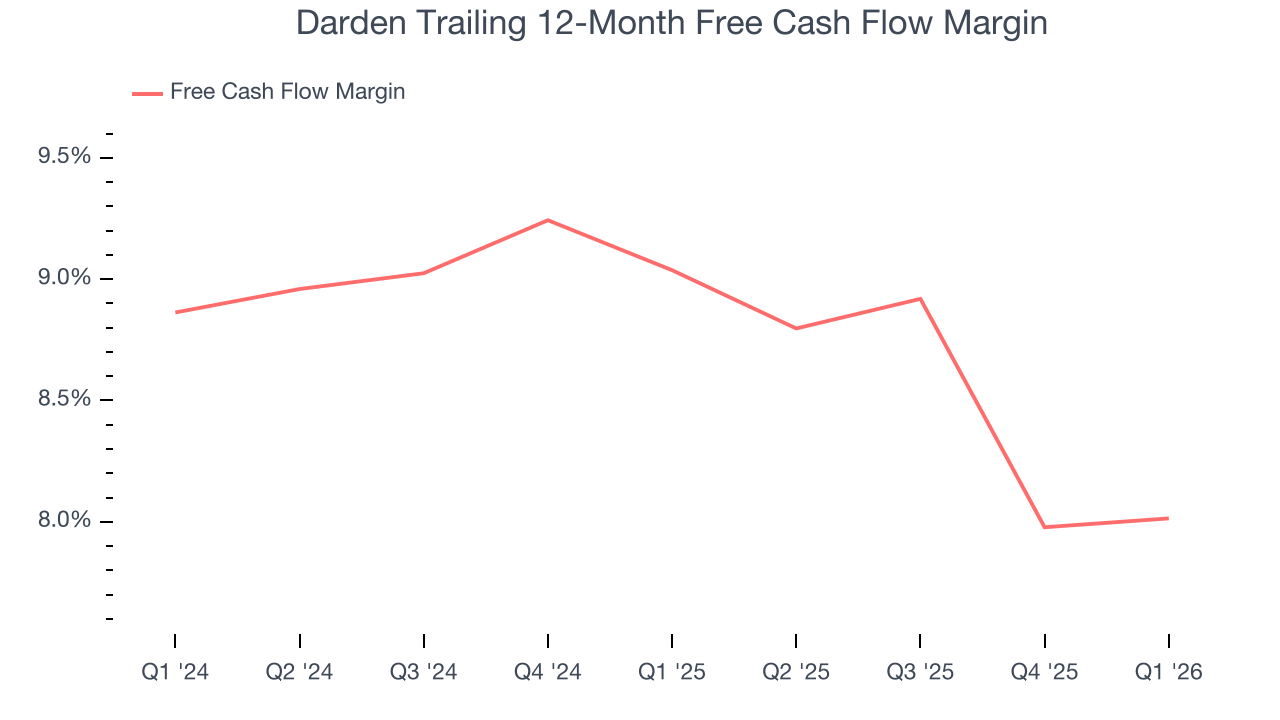
Darden’s free cash flow clocked in at $449.7 million in Q1, equivalent to a 13.4% margin. This cash profitability was in line with the comparable period last year and above its two-year average.
11. Return on Invested Capital (ROIC)
EPS and free cash flow tell us whether a company was profitable while growing its revenue. But was it capital-efficient? A company’s ROIC explains this by showing how much operating profit it makes compared to the money it has raised (debt and equity).
Although Darden hasn’t been the highest-quality company lately, it historically found a few growth initiatives that worked out well. Its five-year average ROIC was 15.4%, impressive for a restaurant business.
12. Balance Sheet Assessment
Darden reported $240.4 million of cash and $6.19 billion of debt on its balance sheet in the most recent quarter. As investors in high-quality companies, we primarily focus on two things: 1) that a company’s debt level isn’t too high and 2) that its interest payments are not excessively burdening the business.
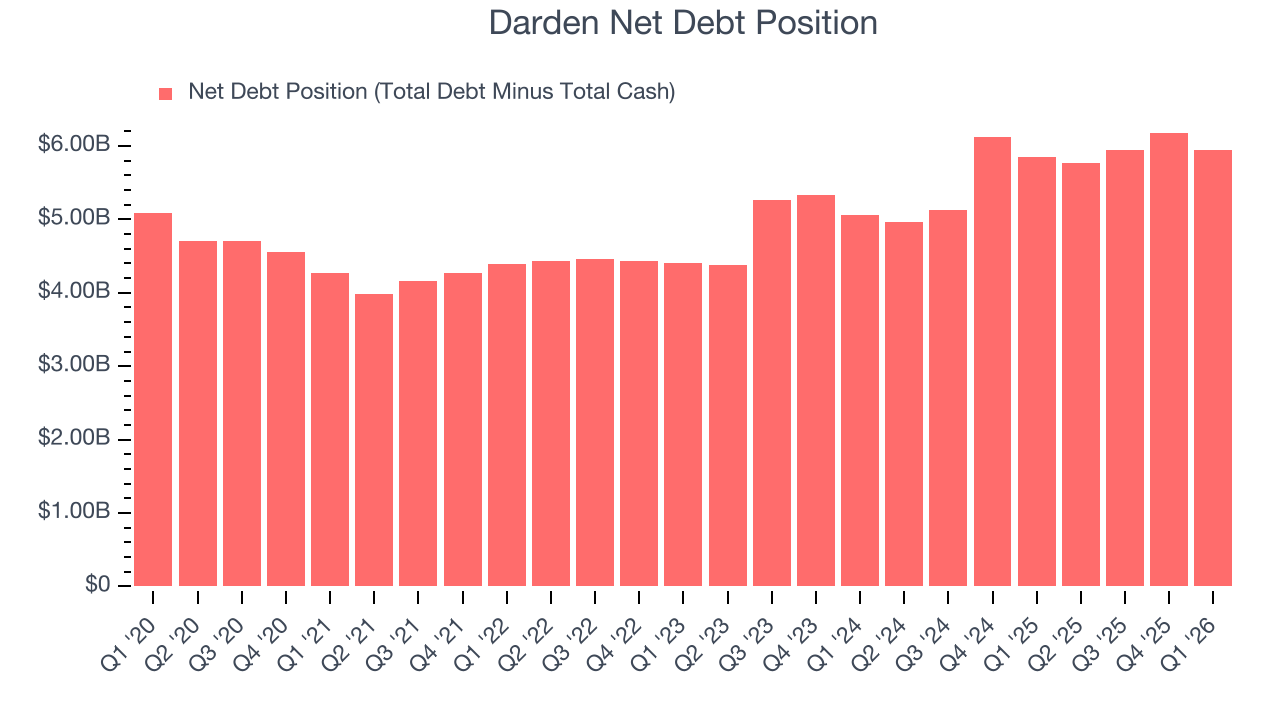
With $2.05 billion of EBITDA over the last 12 months, we view Darden’s 2.9× net-debt-to-EBITDA ratio as safe. We also see its $90.1 million of annual interest expenses as appropriate. The company’s profits give it plenty of breathing room, allowing it to continue investing in growth initiatives.
13. Key Takeaways from Darden’s Q1 Results
There weren't many surprises this quarter, good or bad. Darden met analysts’ same-store sales expectations this quarter, and its revenue and EPS were both in line with Wall Street’s estimates. The stock remained flat at $201.50 immediately after reporting.
14. Is Now The Time To Buy Darden?
Updated: March 24, 2026 at 10:45 PM EDT
We think that the latest earnings result is only one piece of the bigger puzzle. If you’re deciding whether to own Darden, you should also grasp the company’s longer-term business quality and valuation.
Darden isn’t a bad business, but we have other favorites. Although its revenue growth was a little slower over the last seven years, its growth over the next 12 months is expected to be higher. And while Darden’s gross margins make it more difficult to reach positive operating profits compared to other restaurant businesses, its new restaurant openings have increased its brand equity.
Darden’s P/E ratio based on the next 12 months is 17.2x. This valuation multiple is fair, but we don’t have much faith in the company. We're fairly confident there are better investments elsewhere.
Wall Street analysts have a consensus one-year price target of $226.04 on the company (compared to the current share price of $197.50).