Ford (F)
We wouldn’t buy Ford. Its poor sales growth and falling returns on capital suggest its growth opportunities are shrinking.― StockStory Analyst Team
1. News


2. Summary
Why We Think Ford Will Underperform
Established to make automobiles accessible to a broader segment of the population, Ford (NYSE:F) designs, manufactures, and sells a variety of automobiles, trucks, and electric vehicles.
- Earnings per share fell by 26.7% annually over the last two years while its revenue grew, showing its incremental sales were much less profitable
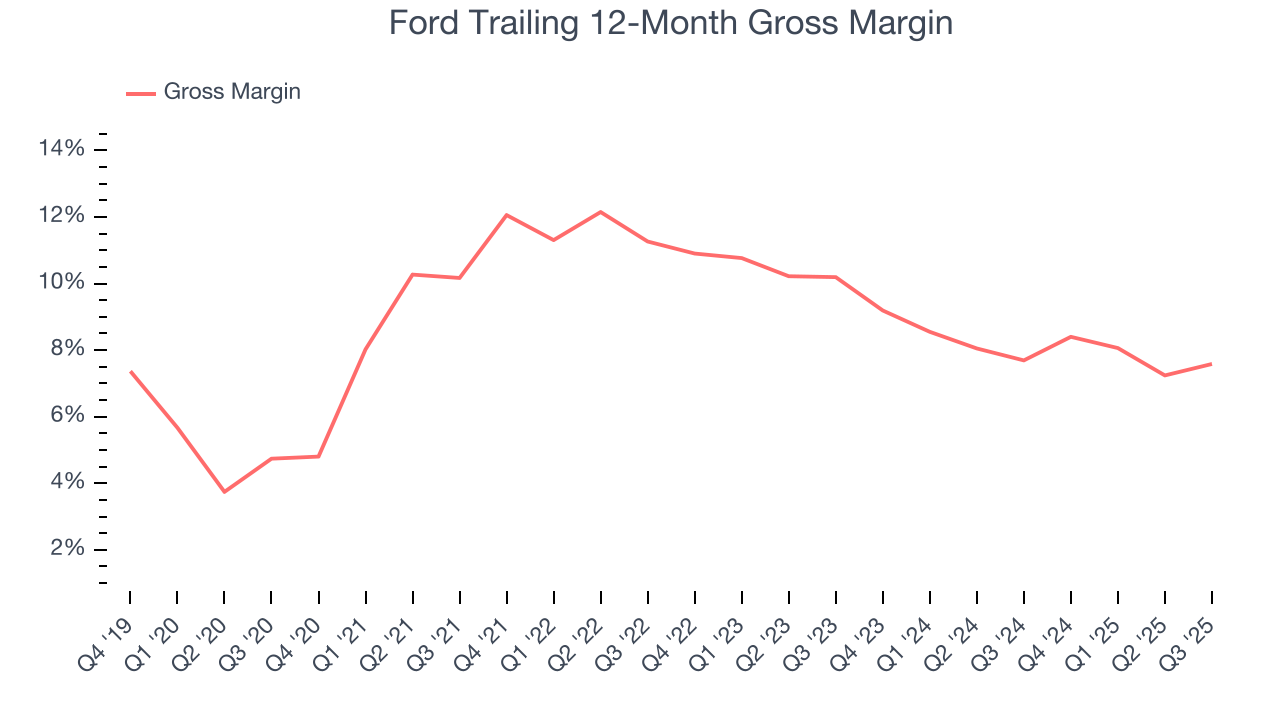
- High input costs result in an inferior gross margin of 9.1% that must be offset through higher volumes
- High net-debt-to-EBITDA ratio of 10× could force the company to raise capital at unfavorable terms if market conditions deteriorate


Ford doesn’t live up to our standards. There are superior stocks for sale in the market.
Why There Are Better Opportunities Than Ford


Ford is trading at $11.59 per share, or 7.6x forward P/E. This is a cheap valuation multiple, but for good reason. You get what you pay for.
It’s better to pay up for high-quality businesses with higher long-term earnings potential rather than to buy lower-quality stocks because they appear cheap. These challenged businesses often don’t re-rate, a phenomenon known as a “value trap”.
3. Ford (F) Research Report: Q4 CY2025 Update
Automotive manufacturer Ford (NYSE:F) beat Wall Street’s revenue expectations in Q4 CY2025, but sales fell by 4.8% year on year to $45.9 billion. Its non-GAAP profit of $0.13 per share was 32.9% below analysts’ consensus estimates.
Ford (F) Q4 CY2025 Highlights:
- Revenue: $45.9 billion vs analyst estimates of $44.3 billion (4.8% year-on-year decline, 3.6% beat)
- Adjusted EPS: $0.13 vs analyst expectations of $0.19 (32.9% miss)
- Free Cash Flow Margin: 2.4%, up from 1.1% in the same quarter last year
- Sales Volumes fell 8.9% year on year (3.1% in the same quarter last year)
- Market Capitalization: $54.15 billion
Company Overview
Established to make automobiles accessible to a broader segment of the population, Ford (NYSE:F) designs, manufactures, and sells a variety of automobiles, trucks, and electric vehicles.
Ford Motor Company, founded in 1903, is a global automotive company headquartered in Dearborn, Michigan. Ford's introduction of assembly line production revolutionized the manufacturing industry, significantly lowering the cost of production and selling price of automobiles. This innovation democratized vehicle ownership and set a new standard in industrial manufacturing, propelling Ford to become a key figure in the automotive sector.
With approximately over 170,000 employees worldwide, Ford is committed to helping build a better world through its Ford+ plan for growth and value creation. The company's automotive operations are divided into three customer-centered business segments: Ford Blue, Ford Model e, and Ford Pro.
Ford offers a comprehensive range of automotive products, including passenger cars, trucks, and electric vehicles (EVs). It also owns Lincoln, its line of luxury vehicles. The company's revenue is derived from vehicle sales, financing for those vehicles through Ford Credit, and other automotive services like digital connectivity. The company maintains a mixed cost structure, with significant fixed costs related to manufacturing plants, R&D facilities, and labor. On the other hand, its variable costs are tied to raw materials, parts, and production volume.
In recent years, Ford has shifted its strategy towards electrification and smart vehicle technology.
Ford's autonomous driving services are sold on a subscription basis, mirroring Tesla's original self-driving strategy.
4. Automobile Manufacturing
Much capital investment and technical know-how are needed to manufacture functional, safe, and aesthetically pleasing automobiles for the mass market. Barriers to entry are therefore high, and auto manufacturers with economies of scale can boast strong economic moats. However, this doesn’t insulate them from new entrants, as electric vehicles (EVs) have entered the market and are upending it. This has forced established manufacturers to not only contend with emerging EV-first competitors but also decide how much they want to invest in these disruptive technologies, which will likely cannibalize their legacy offerings.
Ford's competitors in the automotive industry include General Motors (NYSE:GM), Toyota (NYSE:TM), Volkswagen (OTC:VWAGY), and Honda (NYSE:HMC).
5. Revenue Growth
A company’s long-term sales performance can indicate its overall quality. Any business can have short-term success, but a top-tier one grows for years. Thankfully, Ford’s 8.1% annualized revenue growth over the last five years was decent. Its growth was slightly above the average industrials company and shows its offerings resonate with customers.
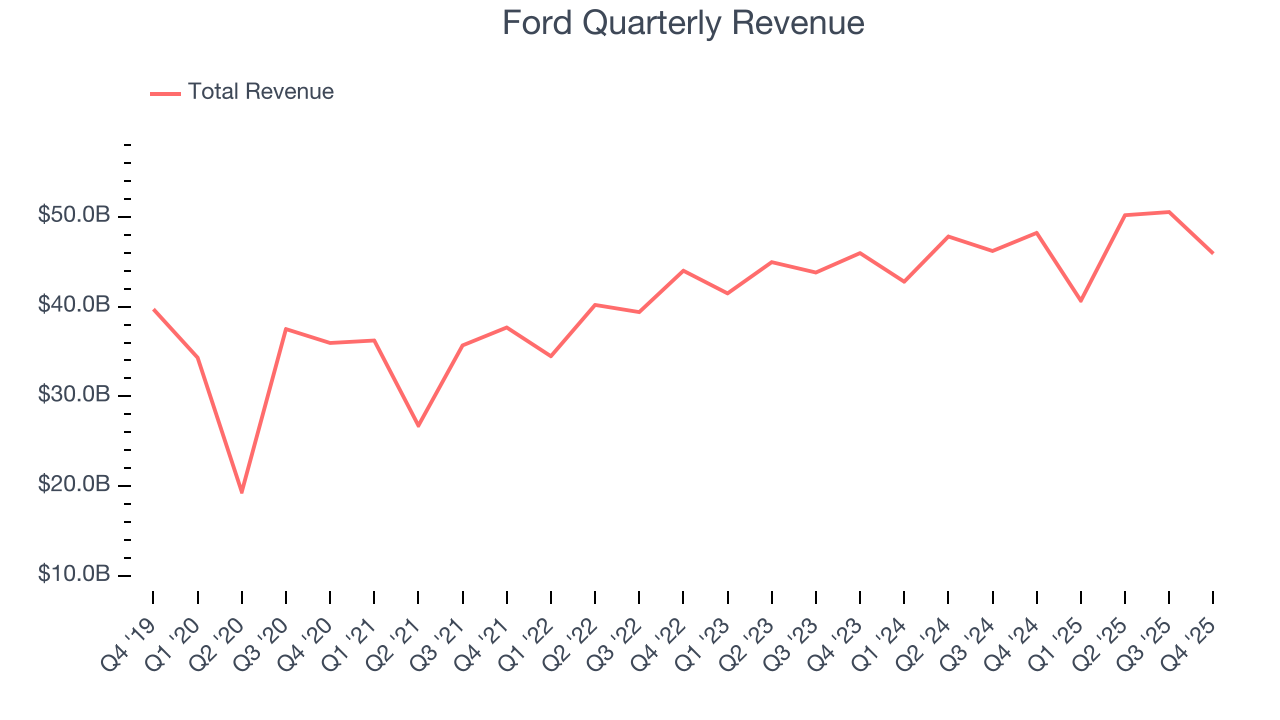
Long-term growth is the most important, but within industrials, a half-decade historical view may miss new industry trends or demand cycles. Ford’s recent performance shows its demand has slowed as its annualized revenue growth of 3.1% over the last two years was below its five-year trend. We also note many other Automobile Manufacturing businesses have faced declining sales because of cyclical headwinds. While Ford grew slower than we’d like, it did do better than its peers. 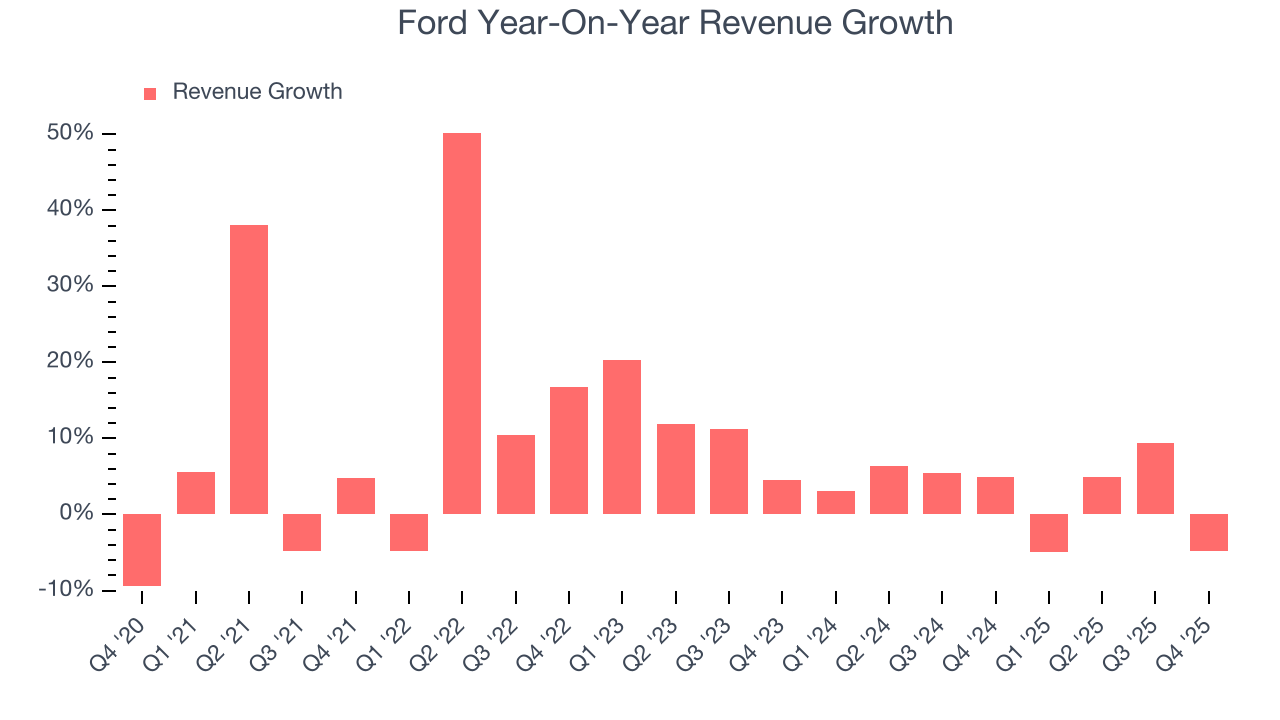
We can dig further into the company’s revenue dynamics by analyzing its number of vehicles sold, which reached 1.08 million in the latest quarter. Over the last two years, Ford’s vehicles sold were flat. Because this number is lower than its revenue growth, we can see the company benefited from price increases. 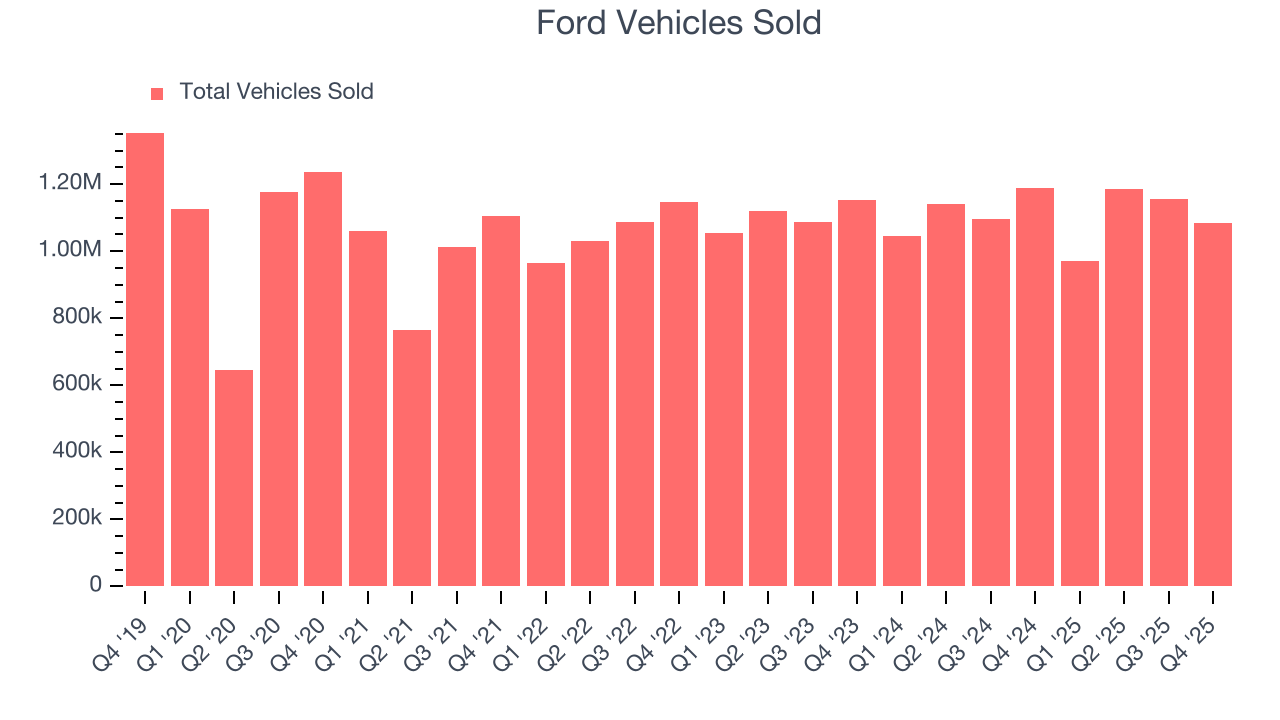
This quarter, Ford’s revenue fell by 4.8% year on year to $45.9 billion but beat Wall Street’s estimates by 3.6%.
Looking ahead, sell-side analysts expect revenue to grow 1.4% over the next 12 months, a slight deceleration versus the last two years. This projection doesn't excite us and implies its products and services will see some demand headwinds.
6. Gross Margin & Pricing Power
Ford has bad unit economics for an industrials business, signaling it operates in a competitive market. This is also because it’s an automobile manufacturer.
Automobile manufacturers have structurally lower profitability as they often break even on the initial sale of vehicles and instead make money on parts and servicing, which come many years later - this explains why new entrants such as Rivian, Lucid, and Nikola have negative gross margins. As you can see below, these dynamics culminated in an average 9.5% gross margin for Ford over the last five years.
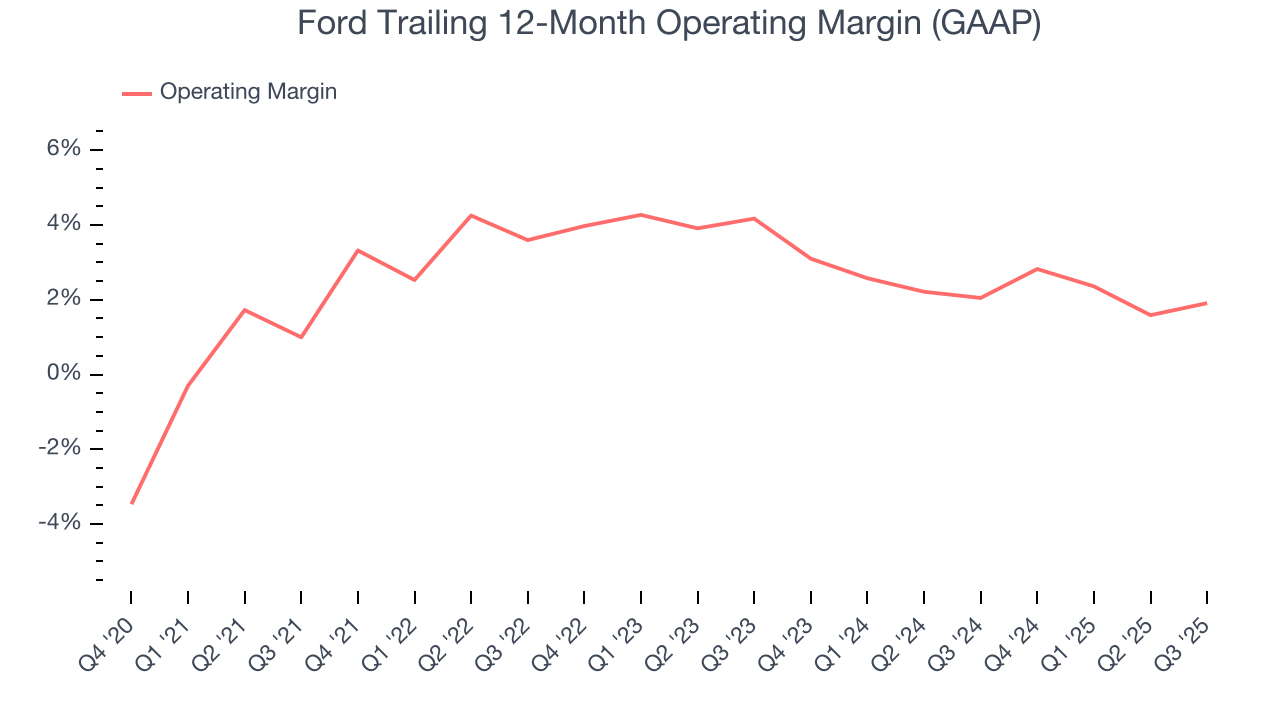
7. Operating Margin
Operating margin is an important measure of profitability as it shows the portion of revenue left after accounting for all core expenses – everything from the cost of goods sold to advertising and wages. It’s also useful for comparing profitability across companies with different levels of debt and tax rates because it excludes interest and taxes.
Ford was profitable over the last five years but held back by its large cost base. Its average operating margin of 3% was weak for an industrials business. This result isn’t too surprising given its low gross margin as a starting point.
Analyzing the trend in its profitability, Ford’s operating margin decreased by 2.1 percentage points over the last five years. This raises questions about the company’s expense base because its revenue growth should have given it leverage on its fixed costs, resulting in better economies of scale and profitability. We’ve noticed many Automobile Manufacturing companies also saw their margins fall (along with revenue, as mentioned above) because the cycle turned in the wrong direction, but Ford’s performance was poor no matter how you look at it. It shows that costs were rising and it couldn’t pass them onto its customers.
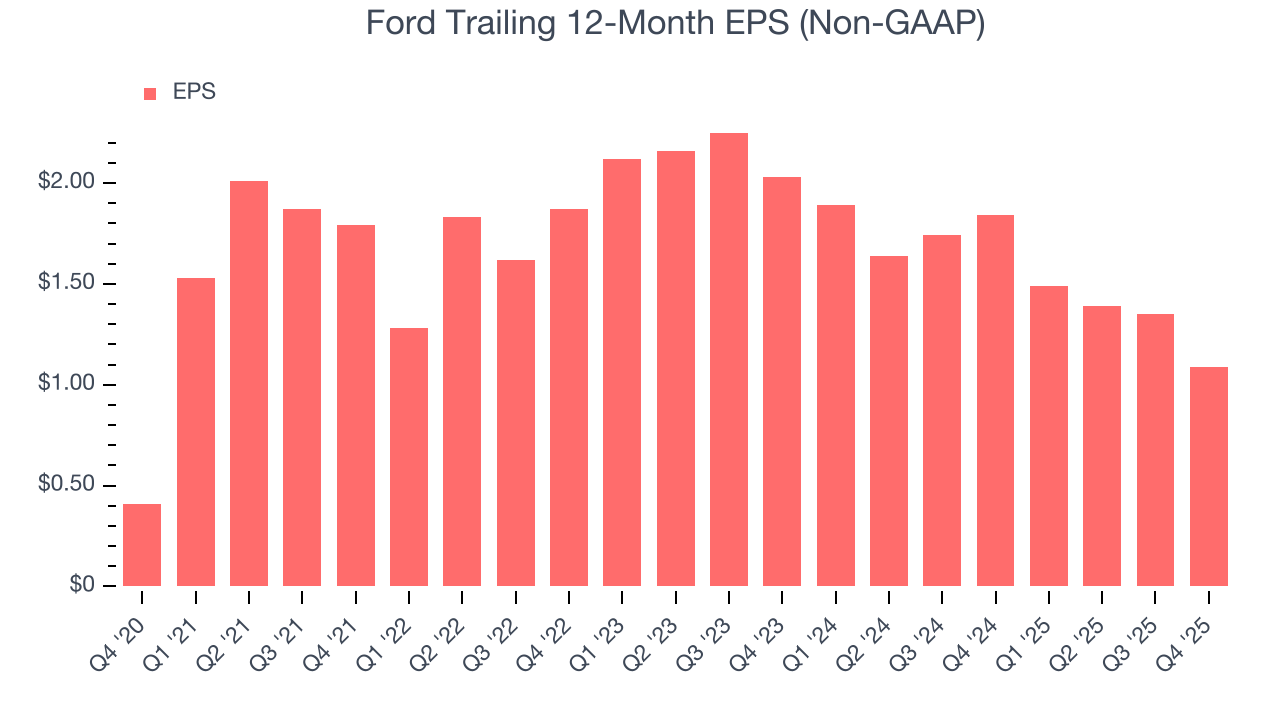
8. Earnings Per Share
We track the long-term change in earnings per share (EPS) for the same reason as long-term revenue growth. Compared to revenue, however, EPS highlights whether a company’s growth is profitable.
Ford’s EPS grew at an astounding 21.6% compounded annual growth rate over the last five years, higher than its 8.1% annualized revenue growth. However, this alone doesn’t tell us much about its business quality because its operating margin didn’t improve.
Diving into the nuances of Ford’s earnings can give us a better understanding of its performance. A five-year view shows that Ford has repurchased its stock, shrinking its share count by 99.9%. This tells us its EPS outperformed its revenue not because of increased operational efficiency but financial engineering, as buybacks boost per share earnings. 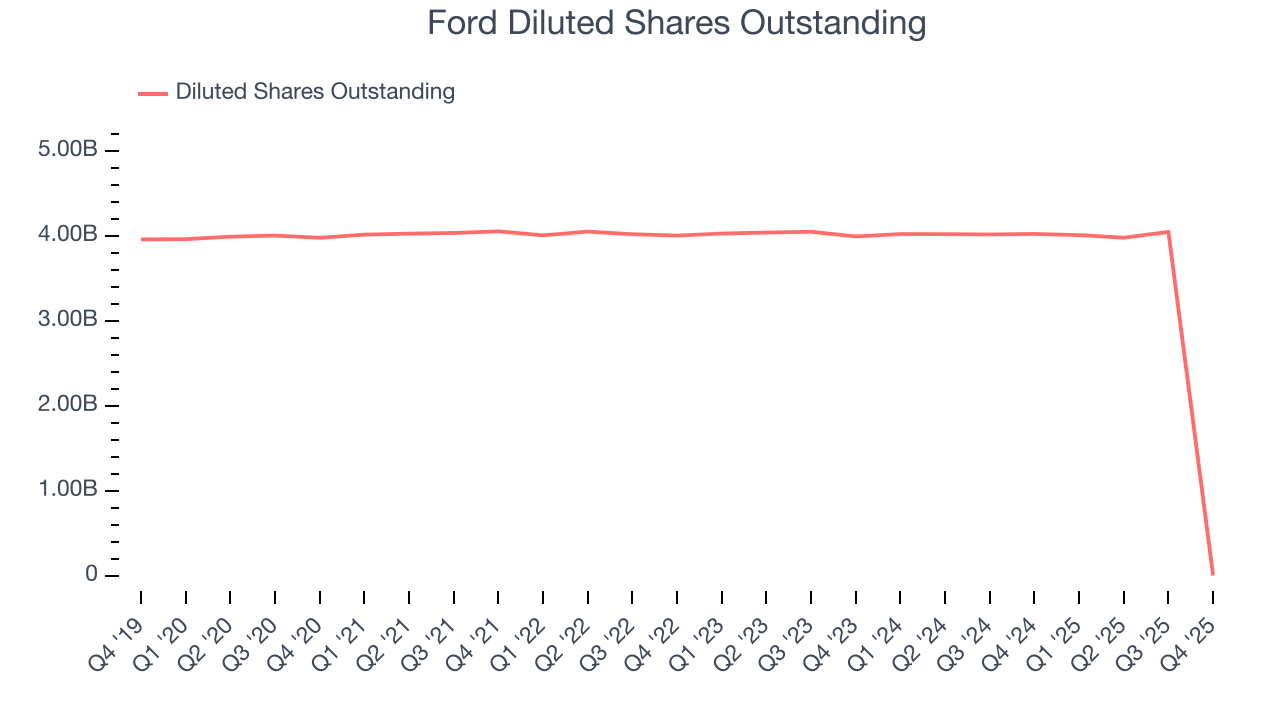
Like with revenue, we analyze EPS over a shorter period to see if we are missing a change in the business.
For Ford, its two-year annual EPS declines of 26.7% mark a reversal from its (seemingly) healthy five-year trend. We hope Ford can return to earnings growth in the future.
In Q4, Ford reported adjusted EPS of $0.13, down from $0.39 in the same quarter last year. This print missed analysts’ estimates, but we care more about long-term adjusted EPS growth than short-term movements. Over the next 12 months, Wall Street expects Ford’s full-year EPS of $1.09 to grow 40.2%.
9. Cash Is King
Although earnings are undoubtedly valuable for assessing company performance, we believe cash is king because you can’t use accounting profits to pay the bills.
Ford has shown weak cash profitability over the last five years, giving the company limited opportunities to return capital to shareholders. Its free cash flow margin averaged 4.2%, subpar for an industrials business.
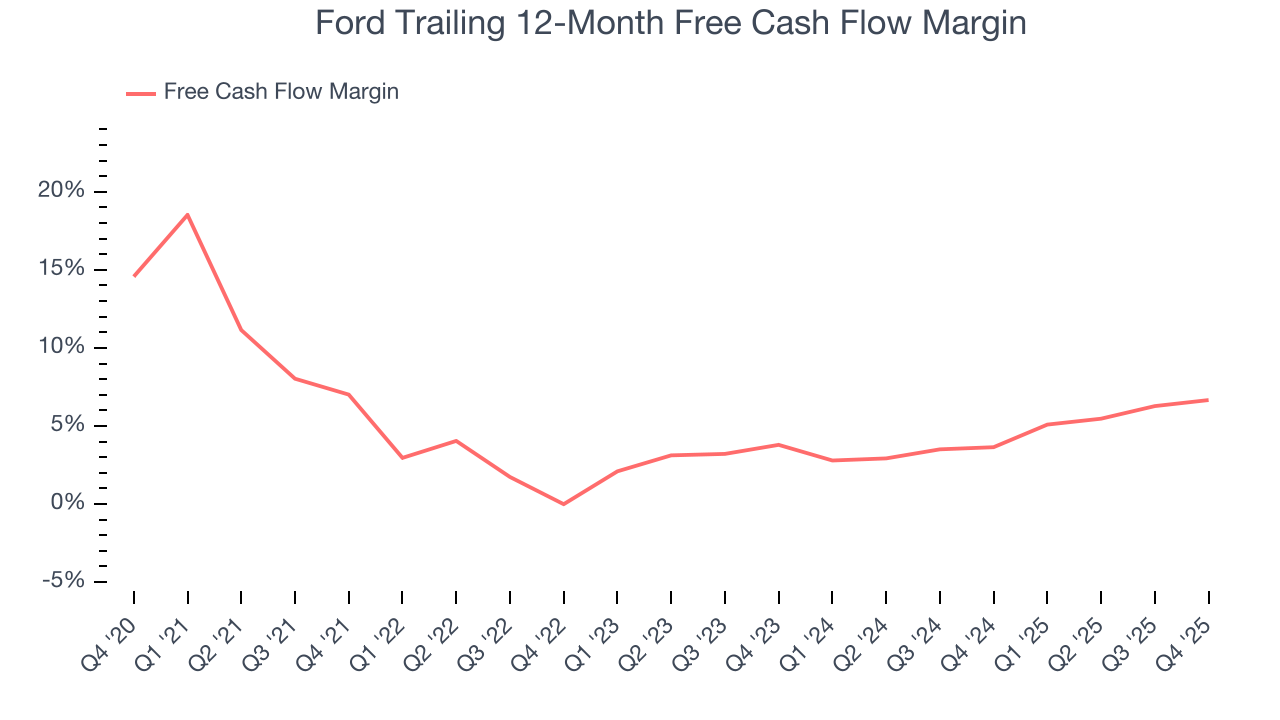
Ford’s free cash flow clocked in at $1.11 billion in Q4, equivalent to a 2.4% margin. This result was good as its margin was 1.3 percentage points higher than in the same quarter last year, but we wouldn’t read too much into the short term because investment needs can be seasonal, leading to temporary swings. Long-term trends carry greater meaning.
10. Return on Invested Capital (ROIC)
EPS and free cash flow tell us whether a company was profitable while growing its revenue. But was it capital-efficient? A company’s ROIC explains this by showing how much operating profit it makes compared to the money it has raised (debt and equity).
Although Ford hasn’t been the highest-quality company lately, it historically found a few growth initiatives that worked out well. Its five-year average ROIC was 17.5%, impressive for an industrials business.
We like to invest in businesses with high returns, but the trend in a company’s ROIC is what often surprises the market and moves the stock price. On average, Ford’s ROIC decreased by 1.7 percentage points annually each year over the last few years. We like what management has done in the past, but its declining returns are perhaps a symptom of fewer profitable growth opportunities.
11. Balance Sheet Risk
Debt is a tool that can boost company returns but presents risks if used irresponsibly. As long-term investors, we aim to avoid companies taking excessive advantage of this instrument because it could lead to insolvency.
Ford’s $163.3 billion of debt exceeds the $38.49 billion of cash on its balance sheet. Furthermore, its 10× net-debt-to-EBITDA ratio (based on its EBITDA of $12.78 billion over the last 12 months) shows the company is overleveraged.
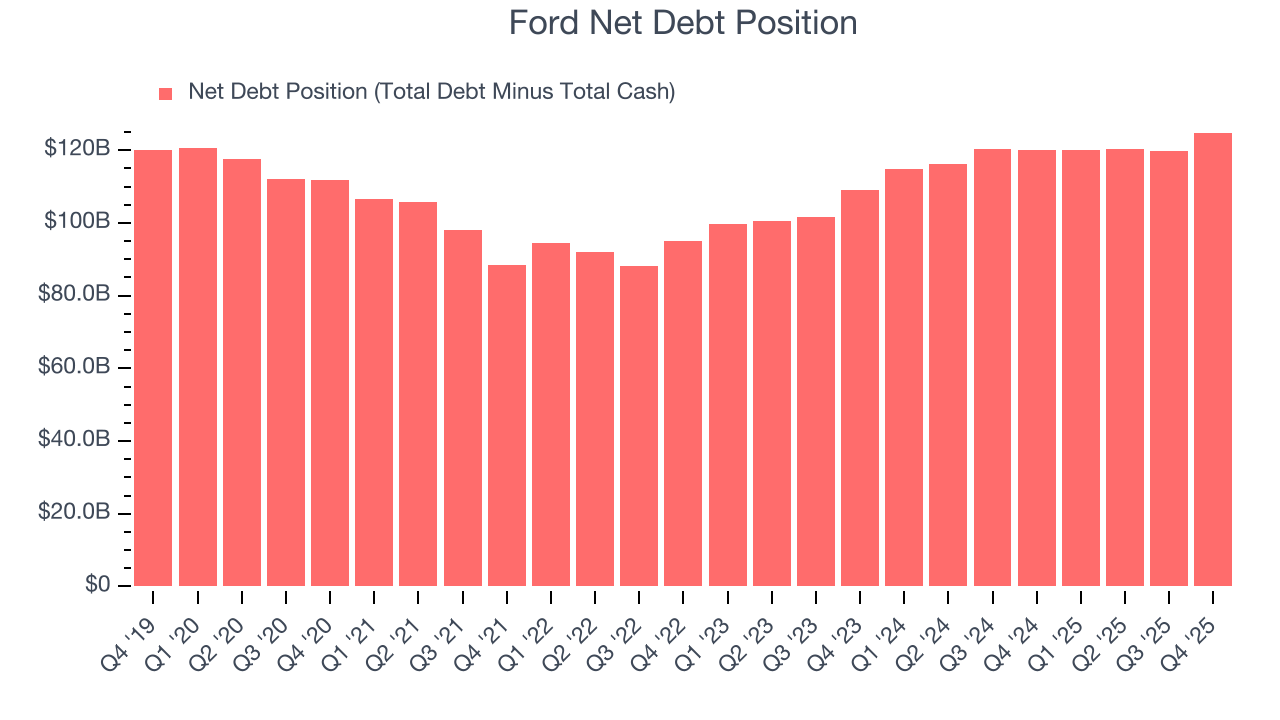
At this level of debt, incremental borrowing becomes increasingly expensive and credit agencies could downgrade the company’s rating if profitability falls. Ford could also be backed into a corner if the market turns unexpectedly – a situation we seek to avoid as investors in high-quality companies.
We hope Ford can improve its balance sheet and remain cautious until it increases its profitability or pays down its debt.
12. Key Takeaways from Ford’s Q4 Results
We were impressed by how significantly Ford blew past analysts’ revenue expectations this quarter. On the other hand, its EPS missed. Overall, this quarter could have been better. The stock remained flat at $13.66 immediately following the results.
13. Is Now The Time To Buy Ford?
Updated: March 20, 2026 at 11:11 PM EDT
The latest quarterly earnings matters, sure, but we actually think longer-term fundamentals and valuation matter more. Investors should consider all these pieces before deciding whether or not to invest in Ford.
We cheer for all companies making their customers lives easier, but in the case of Ford, we’ll be cheering from the sidelines. Although its revenue growth was decent over the last five years, it’s expected to deteriorate over the next 12 months and its diminishing returns show management's prior bets haven't worked out. And while the company’s astounding EPS growth over the last five years shows its profits are trickling down to shareholders, the downside is its declining operating margin shows the business has become less efficient.
Ford’s P/E ratio based on the next 12 months is 7.6x. While this valuation is optically cheap, the potential downside is huge given its shaky fundamentals. There are better investments elsewhere.
Wall Street analysts have a consensus one-year price target of $14.14 on the company (compared to the current share price of $11.59).
Although the price target is bullish, readers should exercise caution because analysts tend to be overly optimistic. The firms they work for, often big banks, have relationships with companies that extend into fundraising, M&A advisory, and other rewarding business lines. As a result, they typically hesitate to say bad things for fear they will lose out. We at StockStory do not suffer from such conflicts of interest, so we’ll always tell it like it is.