
Fortune Brands (FBIN)
We wouldn’t recommend Fortune Brands. Its weak sales growth and declining returns on capital show its demand and profits are shrinking.― StockStory Analyst Team
1. News


2. Summary
Why We Think Fortune Brands Will Underperform
Targeting a wide customer base of residential and commercial customers, Fortune Brands (NYSE:FBIN) makes plumbing, security, and outdoor living products.
- Customers postponed purchases of its products and services this cycle as its revenue declined by 1.8% annually over the last two years
- Incremental sales over the last five years were much less profitable as its earnings per share fell by 8.9% annually while its revenue grew
- Organic sales performance over the past two years indicates the company may need to make strategic adjustments or rely on M&A to catalyze faster growth


Fortune Brands doesn’t satisfy our quality benchmarks. There are better opportunities in the market.
Why There Are Better Opportunities Than Fortune Brands


At $39.24 per share, Fortune Brands trades at 11.7x forward P/E. Yes, this valuation multiple is lower than that of other industrials peers, but we’ll remind you that you often get what you pay for.
Cheap stocks can look like a great deal at first glance, but they can be value traps. They often have less earnings power, meaning there is more reliance on a re-rating to generate good returns - an unlikely scenario for low-quality companies.
3. Fortune Brands (FBIN) Research Report: Q4 CY2025 Update
Home and security products company Fortune Brands (NYSE:FBIN) missed Wall Street’s revenue expectations in Q4 CY2025, with sales falling 2.4% year on year to $1.08 billion. Its GAAP profit of $0.63 per share was 36.5% below analysts’ consensus estimates.
Fortune Brands (FBIN) Q4 CY2025 Highlights:
- Revenue: $1.08 billion vs analyst estimates of $1.14 billion (2.4% year-on-year decline, 5.5% miss)
- EPS (GAAP): $0.63 vs analyst expectations of $0.99 (36.5% miss)
- Adjusted EBITDA: $201.1 million vs analyst estimates of $232.7 million (18.7% margin, 13.6% miss)
- EPS (GAAP) guidance for the upcoming financial year 2026 is $3.50 at the midpoint, missing analyst estimates by 14.4%
- Operating Margin: 11.3%, down from 16.1% in the same quarter last year
- Free Cash Flow Margin: 21.6%, up from 19.2% in the same quarter last year
- Market Capitalization: $7.58 billion
Company Overview
Targeting a wide customer base of residential and commercial customers, Fortune Brands (NYSE:FBIN) makes plumbing, security, and outdoor living products.
The company offers solutions in home and lifestyle products to builders and home homeowners. Its products solve challenges related to home security, water management, and outdoor living and provide customers with reliable and efficient solutions for modern living.
It offers a wide range of products, including smart home security systems, advanced water filtration systems, stylish outdoor living solutions, and premium door hardware. In addition, the company provides installation, maintenance, and repair services.
Fortune Brands Innovations generates revenue primarily through the sale of its innovative products and associated services. Its business model revolves around manufacturing, distribution, and service provision, with product sales accounting for the majority of its revenue. While the division may offer maintenance contracts and replacement parts, recurring revenue is not the primary focus of its business model.
4. Home Construction Materials
Traditionally, home construction materials companies have built economic moats with expertise in specialized areas, brand recognition, and strong relationships with contractors. More recently, advances to address labor availability and job site productivity have spurred innovation that is driving incremental demand. However, these companies are at the whim of residential construction volumes, which tend to be cyclical and can be impacted heavily by economic factors such as interest rates. Additionally, the costs of raw materials can be driven by a myriad of worldwide factors and greatly influence the profitability of home construction materials companies.
Other companies providing similar products include Honeywell (NYSE: HON), Masco (NYSE: MAS), and privately held company Kholer.
5. Revenue Growth
A company’s long-term performance is an indicator of its overall quality. Any business can put up a good quarter or two, but many enduring ones grow for years. Regrettably, Fortune Brands’s sales grew at a sluggish 4.3% compounded annual growth rate over the last five years. This was below our standard for the industrials sector and is a poor baseline for our analysis.
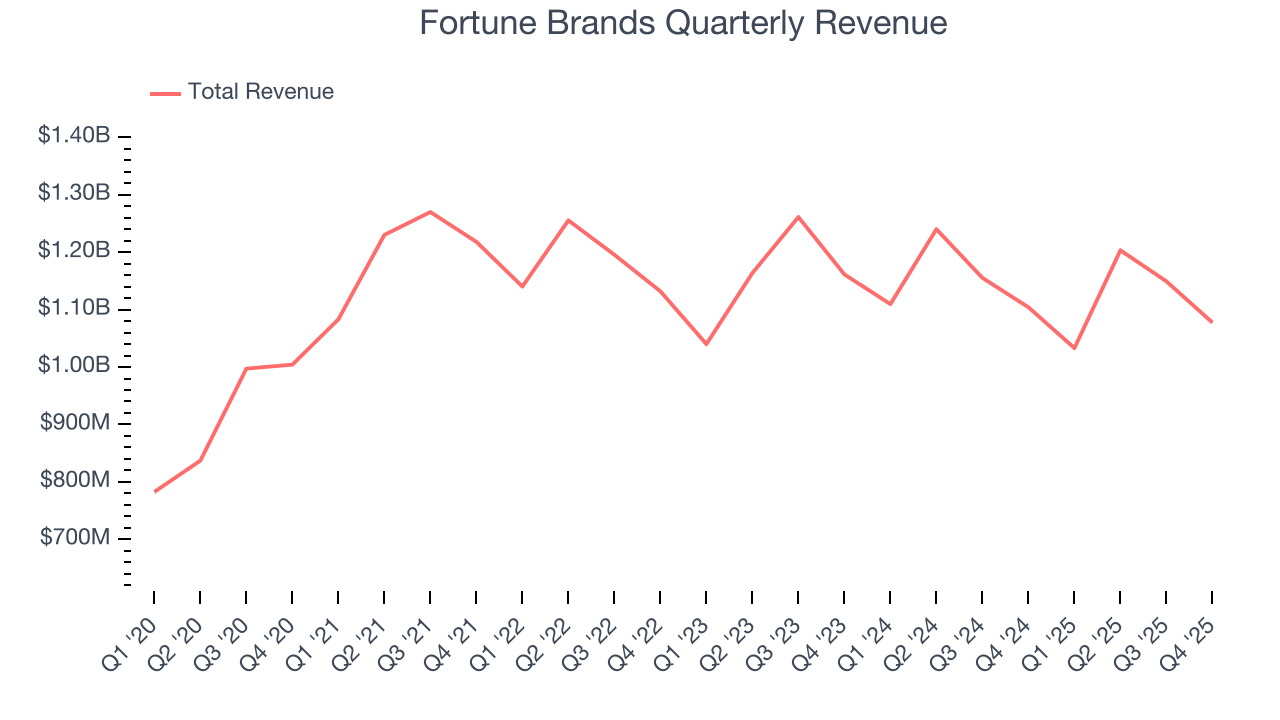
We at StockStory place the most emphasis on long-term growth, but within industrials, a half-decade historical view may miss cycles, industry trends, or a company capitalizing on catalysts such as a new contract win or a successful product line. Fortune Brands’s performance shows it grew in the past but relinquished its gains over the last two years, as its revenue fell by 1.8% annually. 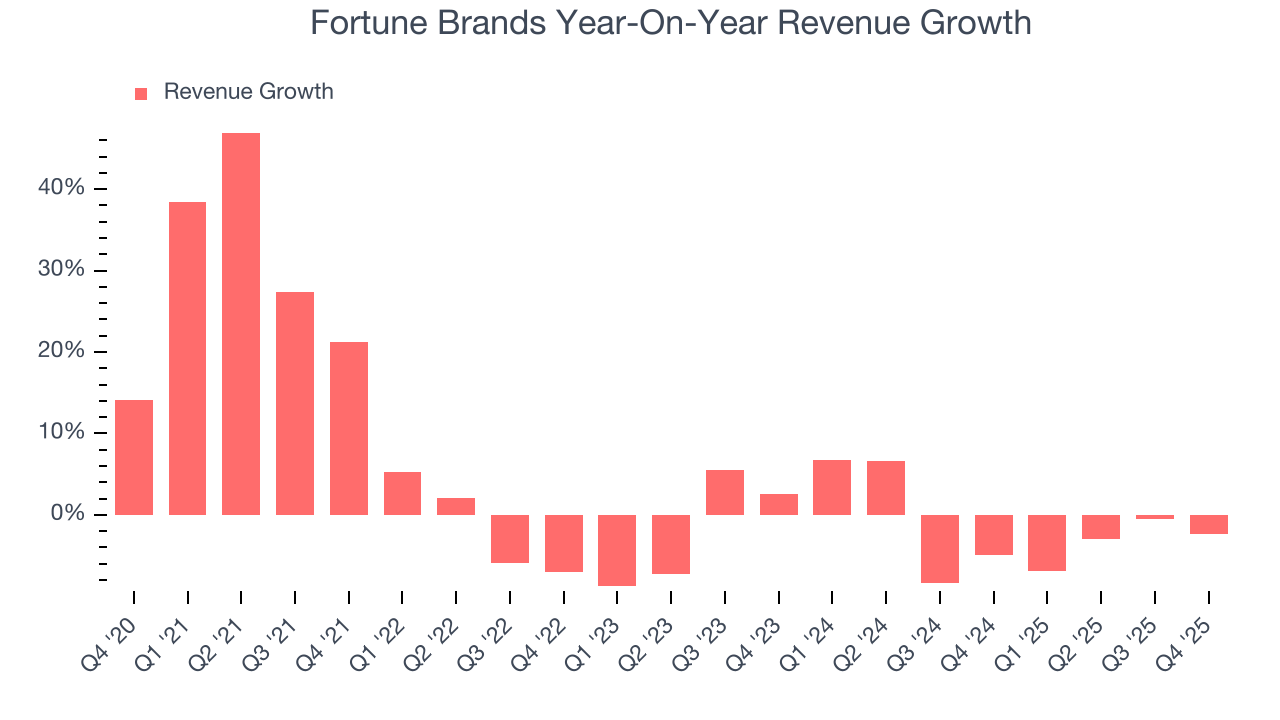
This quarter, Fortune Brands missed Wall Street’s estimates and reported a rather uninspiring 2.4% year-on-year revenue decline, generating $1.08 billion of revenue.
Looking ahead, sell-side analysts expect revenue to grow 3.6% over the next 12 months. Although this projection indicates its newer products and services will fuel better top-line performance, it is still below the sector average.
6. Gross Margin & Pricing Power
Gross profit margin is a critical metric to track because it sheds light on its pricing power, complexity of products, and ability to procure raw materials, equipment, and labor.
Fortune Brands’s unit economics are great compared to the broader industrials sector and signal that it enjoys product differentiation through quality or brand. As you can see below, it averaged an excellent 36.2% gross margin over the last five years. That means Fortune Brands only paid its suppliers $63.80 for every $100 in revenue. 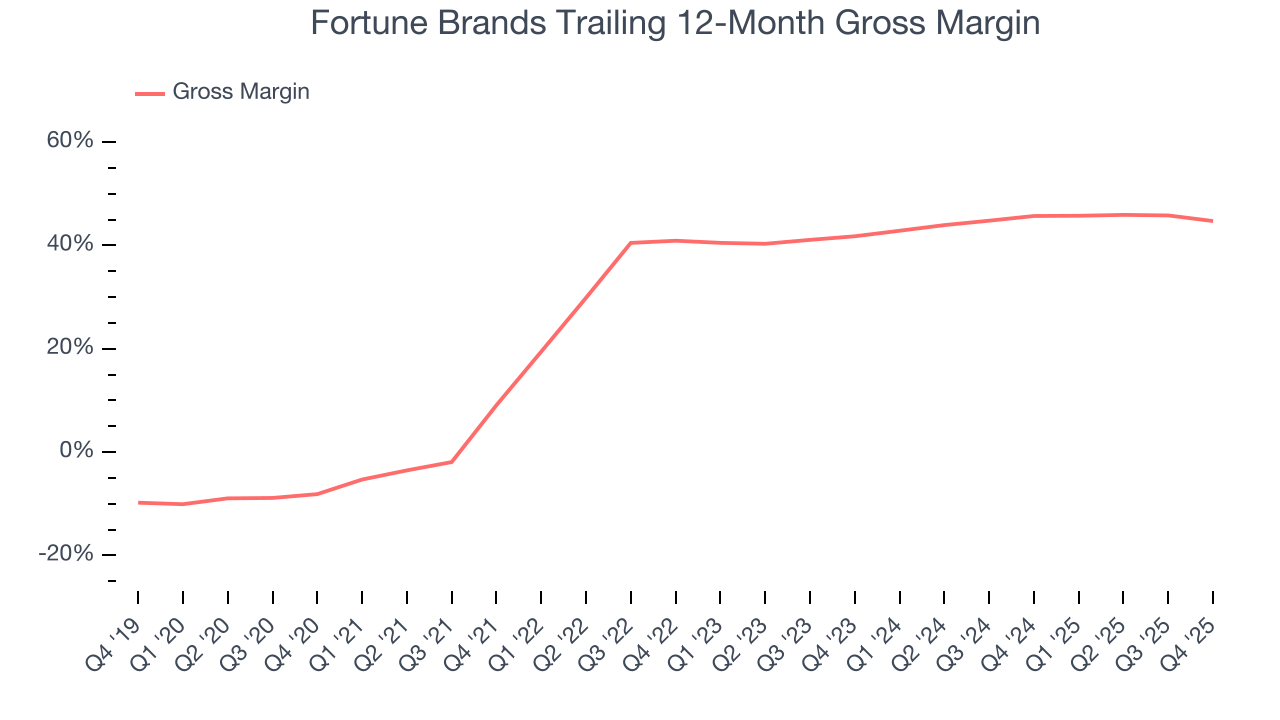
This quarter, Fortune Brands’s gross profit margin was 43.8% , marking a 4.4 percentage point decrease from 48.3% in the same quarter last year. On a wider time horizon, the company’s full-year margin has remained steady over the past four quarters, suggesting its input costs (such as raw materials and manufacturing expenses) have been stable and it isn’t under pressure to lower prices.
7. Operating Margin
Fortune Brands has been a well-oiled machine over the last five years. It demonstrated elite profitability for an industrials business, boasting an average operating margin of 15.8%. This result isn’t surprising as its high gross margin gives it a favorable starting point.
Analyzing the trend in its profitability, Fortune Brands’s operating margin decreased by 9.8 percentage points over the last five years. This raises questions about the company’s expense base because its revenue growth should have given it leverage on its fixed costs, resulting in better economies of scale and profitability.
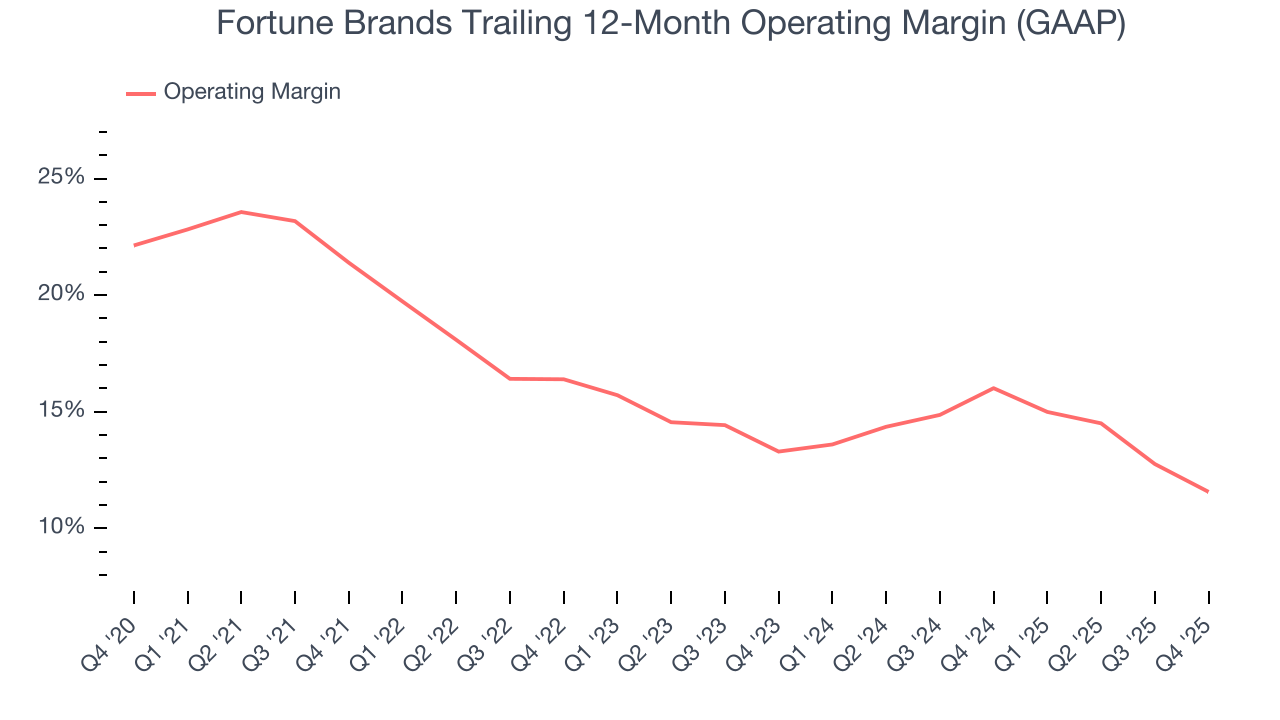
This quarter, Fortune Brands generated an operating margin profit margin of 11.3%, down 4.9 percentage points year on year. Since Fortune Brands’s operating margin decreased more than its gross margin, we can assume it was less efficient because expenses such as marketing, R&D, and administrative overhead increased.
8. Earnings Per Share
We track the long-term change in earnings per share (EPS) for the same reason as long-term revenue growth. Compared to revenue, however, EPS highlights whether a company’s growth is profitable.
Sadly for Fortune Brands, its EPS declined by 9% annually over the last five years while its revenue grew by 4.3%. This tells us the company became less profitable on a per-share basis as it expanded due to non-fundamental factors such as interest expenses and taxes.
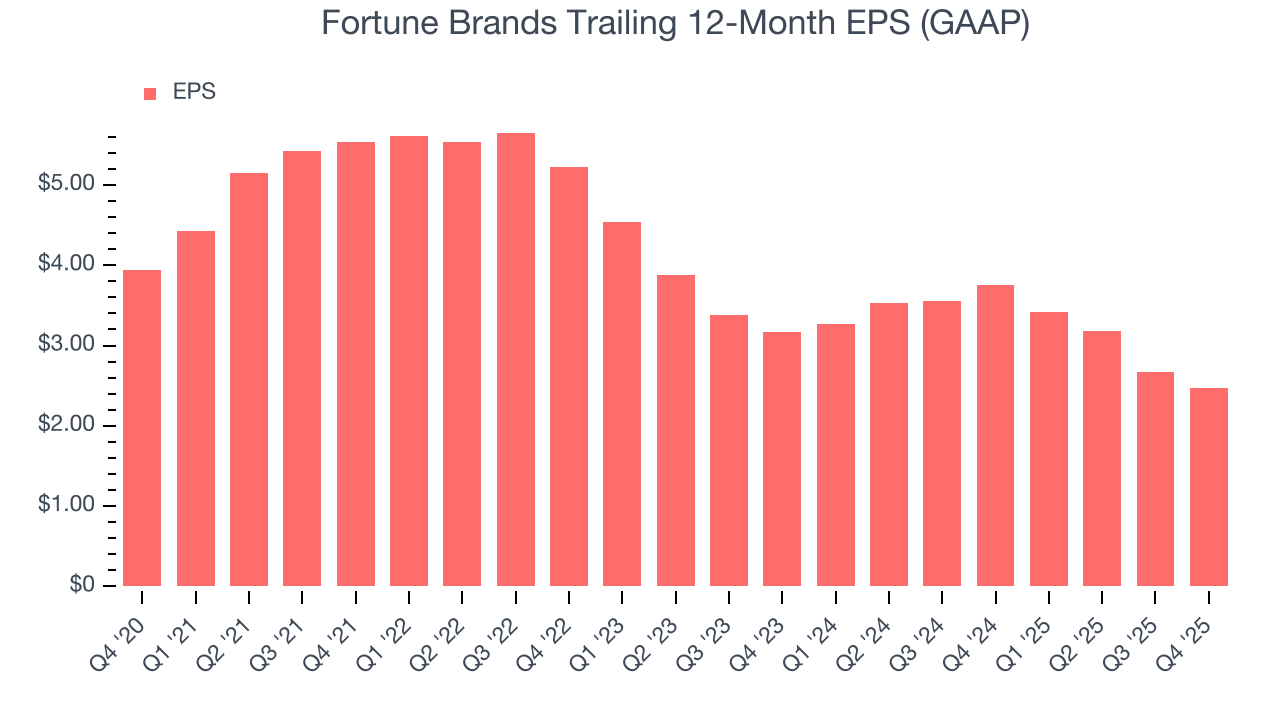
Diving into the nuances of Fortune Brands’s earnings can give us a better understanding of its performance. As we mentioned earlier, Fortune Brands’s operating margin declined by 9.8 percentage points over the last five years. This was the most relevant factor (aside from the revenue impact) behind its lower earnings; interest expenses and taxes can also affect EPS but don’t tell us as much about a company’s fundamentals.
Like with revenue, we analyze EPS over a more recent period because it can provide insight into an emerging theme or development for the business.
For Fortune Brands, its two-year annual EPS declines of 11.7% show it’s continued to underperform. These results were bad no matter how you slice the data.
In Q4, Fortune Brands reported EPS of $0.63, down from $0.84 in the same quarter last year. This print missed analysts’ estimates. Over the next 12 months, Wall Street expects Fortune Brands’s full-year EPS of $2.47 to grow 66%.
9. Cash Is King
If you’ve followed StockStory for a while, you know we emphasize free cash flow. Why, you ask? We believe that in the end, cash is king, and you can’t use accounting profits to pay the bills.
Fortune Brands has shown robust cash profitability, enabling it to comfortably ride out cyclical downturns while investing in plenty of new offerings and returning capital to investors. The company’s free cash flow margin averaged 10.8% over the last five years, quite impressive for an industrials business.
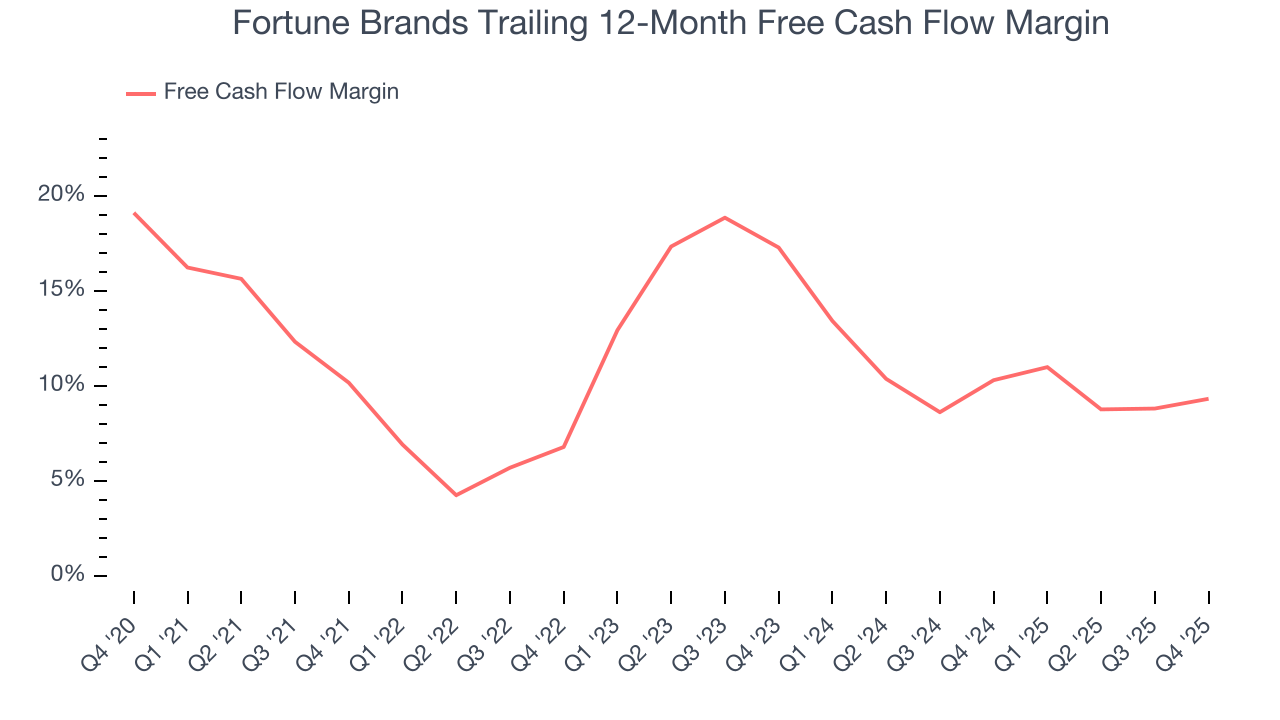
Fortune Brands’s free cash flow clocked in at $232.7 million in Q4, equivalent to a 21.6% margin. This result was good as its margin was 2.4 percentage points higher than in the same quarter last year, but we wouldn’t read too much into the short term because investment needs can be seasonal, leading to temporary swings. Long-term trends carry greater meaning.
10. Return on Invested Capital (ROIC)
EPS and free cash flow tell us whether a company was profitable while growing its revenue. But was it capital-efficient? Enter ROIC, a metric showing how much operating profit a company generates relative to the money it has raised (debt and equity).
Fortune Brands’s management team makes decent investment decisions and generates value for shareholders. Its five-year average ROIC was 11.4%, slightly better than typical industrials business.
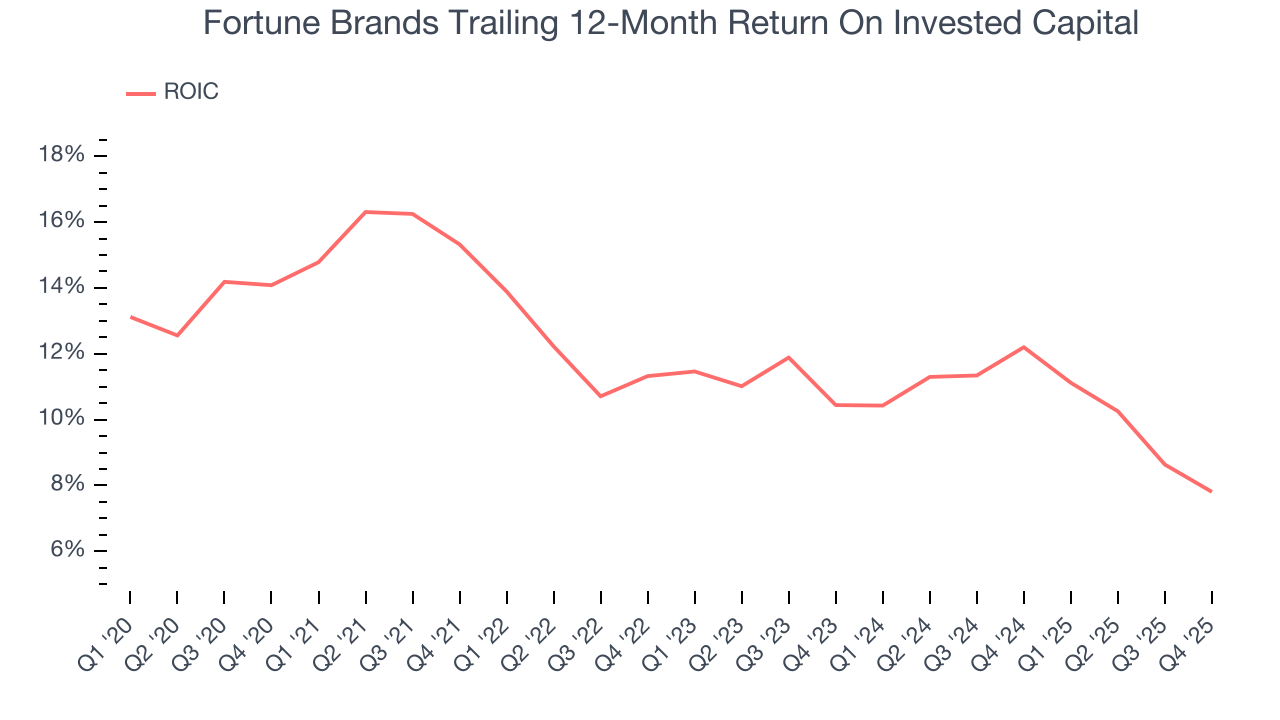
We like to invest in businesses with high returns, but the trend in a company’s ROIC is what often surprises the market and moves the stock price. Over the last few years, Fortune Brands’s ROIC averaged 3.3 percentage point decreases each year. We like what management has done in the past, but its declining returns are perhaps a symptom of fewer profitable growth opportunities.
11. Balance Sheet Assessment
Fortune Brands reported $264 million of cash and $2.54 billion of debt on its balance sheet in the most recent quarter. As investors in high-quality companies, we primarily focus on two things: 1) that a company’s debt level isn’t too high and 2) that its interest payments are not excessively burdening the business.
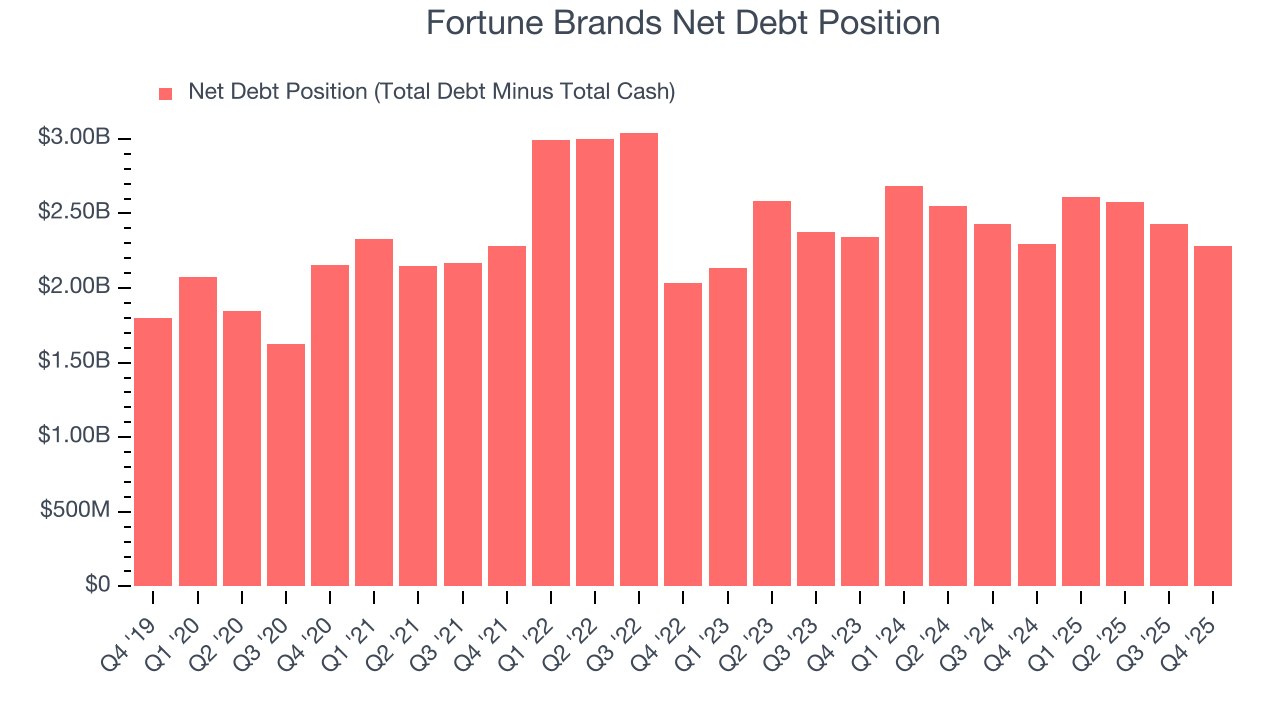
With $878.4 million of EBITDA over the last 12 months, we view Fortune Brands’s 2.6× net-debt-to-EBITDA ratio as safe. We also see its $61.6 million of annual interest expenses as appropriate. The company’s profits give it plenty of breathing room, allowing it to continue investing in growth initiatives.
12. Key Takeaways from Fortune Brands’s Q4 Results
We struggled to find many positives in these results. Its full-year EPS guidance missed and its revenue fell short of Wall Street’s estimates. Overall, this was a weaker quarter. The stock traded down 12.2% to $54.65 immediately after reporting.
13. Is Now The Time To Buy Fortune Brands?
Updated: March 21, 2026 at 11:31 PM EDT
Before deciding whether to buy Fortune Brands or pass, we urge investors to consider business quality, valuation, and the latest quarterly results.
We see the value of companies helping their customers, but in the case of Fortune Brands, we’re out. To begin with, its revenue growth was uninspiring over the last five years, and analysts expect its demand to deteriorate over the next 12 months. While its projected EPS for the next year implies the company’s fundamentals will improve, the downside is its declining EPS over the last five years makes it a less attractive asset to the public markets. On top of that, its declining operating margin shows the business has become less efficient.
Fortune Brands’s P/E ratio based on the next 12 months is 11.7x. This valuation multiple is fair, but we don’t have much confidence in the company. There are superior stocks to buy right now.
Wall Street analysts have a consensus one-year price target of $58.47 on the company (compared to the current share price of $39.24).
Although the price target is bullish, readers should exercise caution because analysts tend to be overly optimistic. The firms they work for, often big banks, have relationships with companies that extend into fundraising, M&A advisory, and other rewarding business lines. As a result, they typically hesitate to say bad things for fear they will lose out. We at StockStory do not suffer from such conflicts of interest, so we’ll always tell it like it is.