
First Horizon (FHN)
We’re skeptical of First Horizon. Its revenue growth has been weak and its profitability has caved, showing it’s struggling to adapt.― StockStory Analyst Team
1. News


2. Summary
Why We Think First Horizon Will Underperform
Tracing its roots back to 1864 during the Civil War era, First Horizon (NYSE:FHN) is a Tennessee-based bank holding company that provides commercial and consumer banking, wealth management, and specialty financial services across multiple states.
- Estimated tangible book value per share growth of 6.6% for the next 12 months implies profitability will slow from its two-year trend
- Estimated net interest income growth of 4% for the next 12 months implies demand will slow from its five-year trend
- A bright spot is that its efficiency ratio improvement of -2.4 percentage points is projected for next year as the firm achieves greater operating leverage


First Horizon doesn’t measure up to our expectations. We’d rather invest in businesses with stronger moats.
Why There Are Better Opportunities Than First Horizon


First Horizon is trading at $24.00 per share, or 1.3x forward P/B. We acknowledge that the current valuation is justified, but we’re passing on this stock for the time being.
There are stocks out there featuring similar valuation multiples with better fundamentals. We prefer to invest in those.
3. First Horizon (FHN) Research Report: Q4 CY2025 Update
Regional banking company First Horizon (NYSE:FHN) reported Q4 CY2025 results exceeding the market’s revenue expectations, with sales up 7.8% year on year to $888 million. Its non-GAAP profit of $0.52 per share was 12.1% above analysts’ consensus estimates.
First Horizon (FHN) Q4 CY2025 Highlights:
- Net Interest Income: $676 million vs analyst estimates of $657.4 million (7.3% year-on-year growth, 2.8% beat)
- Net Interest Margin: 3.5% vs analyst estimates of 3.4% (11.1 basis point beat)
- Revenue: $888 million vs analyst estimates of $863.3 million (7.8% year-on-year growth, 2.9% beat)
- Efficiency Ratio: 61.3% vs analyst estimates of 60.1% (120.8 basis point miss)
- Adjusted EPS: $0.52 vs analyst estimates of $0.46 (12.1% beat)
- Tangible Book Value per Share: $14.20 vs analyst estimates of $14.05 (10.5% year-on-year growth, 1.1% beat)
- Market Capitalization: $11.84 billion
Company Overview
Tracing its roots back to 1864 during the Civil War era, First Horizon (NYSE:FHN) is a Tennessee-based bank holding company that provides commercial and consumer banking, wealth management, and specialty financial services across multiple states.
First Horizon operates through two main segments: regional banking and specialty banking. The regional banking segment serves individuals, small businesses, and larger enterprises with traditional banking services, while the specialty banking segment offers more specialized services like fixed income trading, commercial real estate financing, and mortgage warehouse lending.
Commercial lending forms the backbone of First Horizon's business, with loans categorized into commercial and industrial (C&I) loans, commercial real estate (CRE) loans, and consumer loans. The bank has notable concentration in the financial services industry, which represents about 18% of its C&I portfolio. Geographically, most of its lending activity is concentrated in five states: Florida, Tennessee, Texas, North Carolina, and Louisiana.
Beyond traditional banking, First Horizon provides a diverse range of financial services. A business owner might use First Horizon for a commercial loan to expand operations, maintain business checking accounts for daily transactions, and utilize treasury management services to optimize cash flow. Meanwhile, the same client could work with the bank's wealth management division for personal investment advice and retirement planning.
The company generates revenue primarily through interest income from loans, supplemented by fees from services like wealth management, insurance sales, and fixed income trading. First Horizon's fixed income business has particularly broad geographic reach, with offices spanning from Hawaii to Massachusetts, allowing it to serve clients well beyond its traditional banking footprint.
4. Regional Banks
Regional banks, financial institutions operating within specific geographic areas, serve as intermediaries between local depositors and borrowers. They benefit from rising interest rates that improve net interest margins (the difference between loan yields and deposit costs), digital transformation reducing operational expenses, and local economic growth driving loan demand. However, these banks face headwinds from fintech competition, deposit outflows to higher-yielding alternatives, credit deterioration (increasing loan defaults) during economic slowdowns, and regulatory compliance costs. Recent concerns about regional bank stability following high-profile failures and significant commercial real estate exposure present additional challenges.
First Horizon competes with major national banks like JPMorgan Chase, Bank of America, and Wells Fargo, as well as strong regional players including Truist Bank, Regions Bank, Fifth Third Bank, PNC Bank, and Synovus Bank, along with numerous community banks and credit unions in its operating markets.
5. Sales Growth
From lending activities to service fees, most banks build their revenue model around two income sources. Interest rate spreads between loans and deposits create the first stream, with the second coming from charges on everything from basic bank accounts to complex investment banking transactions. Over the last five years, First Horizon grew its revenue at a sluggish 5.4% compounded annual growth rate. This fell short of our benchmark for the banking sector and is a tough starting point for our analysis.
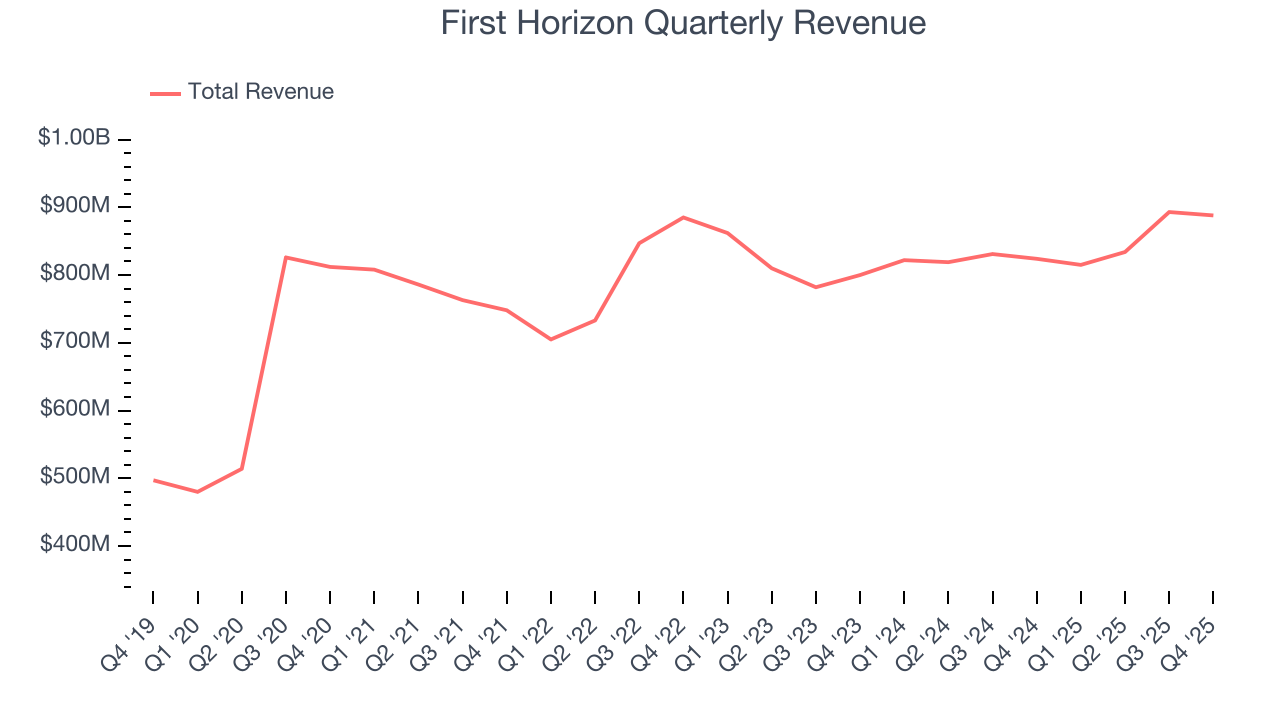
Long-term growth is the most important, but within financials, a half-decade historical view may miss recent interest rate changes and market returns. First Horizon’s recent performance shows its demand has slowed as its annualized revenue growth of 2.7% over the last two years was below its five-year trend. 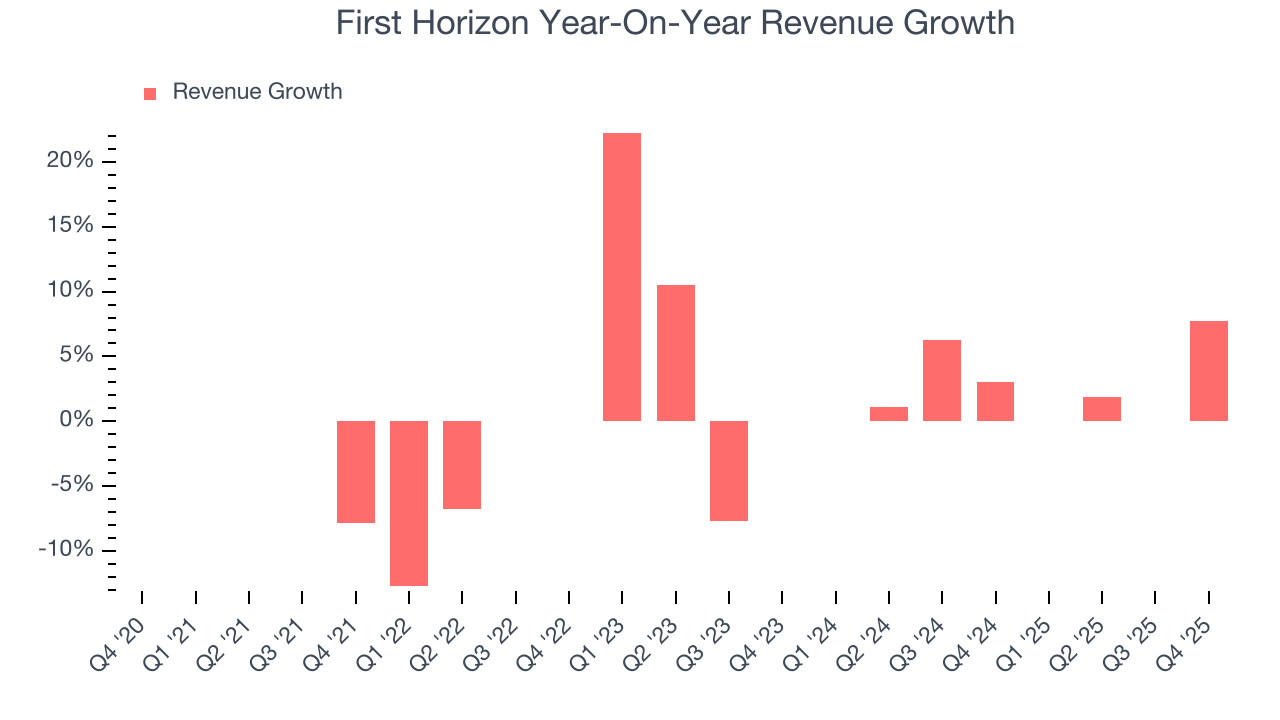 Note: Quarters not shown were determined to be outliers, impacted by outsized investment gains/losses that are not indicative of the recurring fundamentals of the business.
This quarter, First Horizon reported year-on-year revenue growth of 7.8%, and its $888 million of revenue exceeded Wall Street’s estimates by 2.9%.
Net interest income made up 74% of the company’s total revenue during the last five years, meaning lending operations are First Horizon’s largest source of revenue.
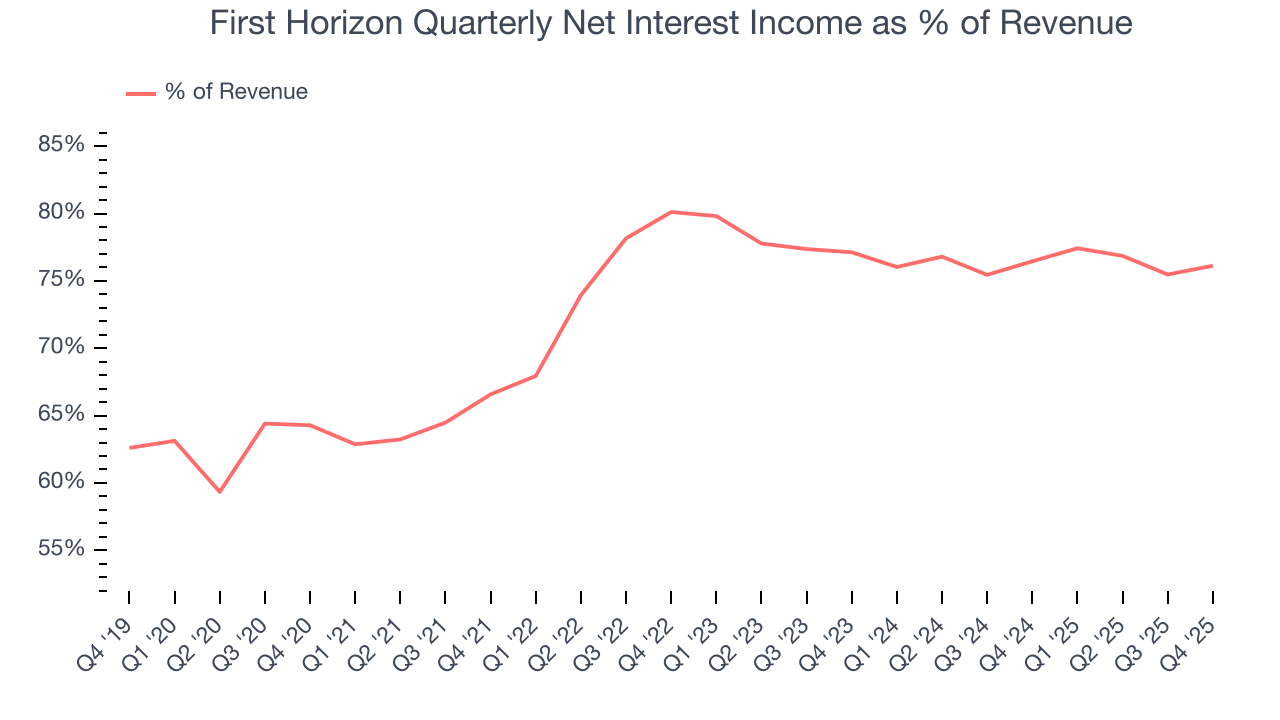
Our experience and research show the market cares primarily about a bank’s net interest income growth as non-interest income is considered a lower-quality and non-recurring revenue source.
6. Efficiency Ratio
The underlying profitability of top-line growth determines the actual bottom-line impact. Banking institutions measure this dynamic using the efficiency ratio, which is calculated by dividing non-interest expenses like personnel, facilities, technology, and marketing by total revenue.
Markets understand that a bank’s expense base depends on its revenue mix and what mostly drives share price performance is the change in this ratio, rather than its absolute value. It’s somewhat counterintuitive, but a lower efficiency ratio is better.
Over the last five years, First Horizon’s efficiency ratio has increased by 4.3 percentage points, going from 67.8% to 60.6%. Said differently, the company’s expenses have increased at a faster rate than revenue, which usually raises questions unless the company is in high-growth mode and reinvesting its profits into attractive ventures.
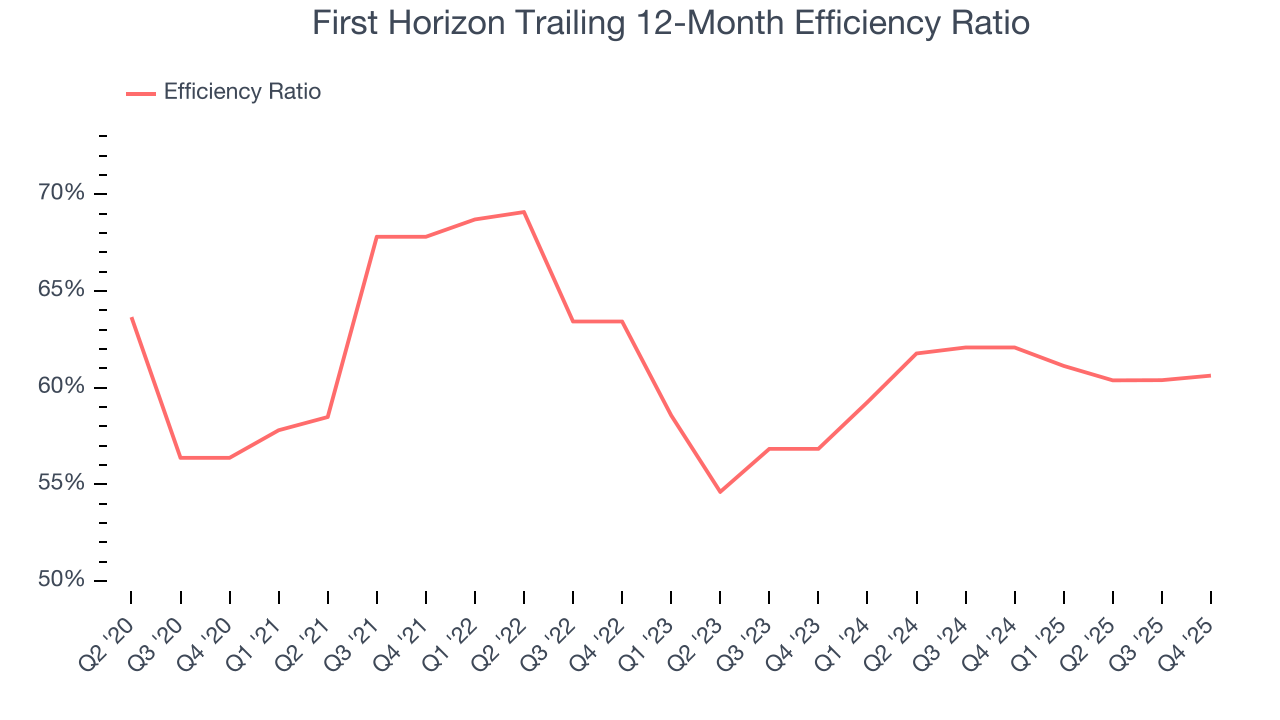
First Horizon’s efficiency ratio came in at 61.3% this quarter, falling short of analysts’ expectations by 120.8 basis points (100 basis points = 1 percentage point).
For the next 12 months, Wall Street expects First Horizon to rein in some of its expenses as it anticipates an efficiency ratio of 58.9%.
7. Earnings Per Share
We track the long-term change in earnings per share (EPS) for the same reason as long-term revenue growth. Compared to revenue, however, EPS highlights whether a company’s growth is profitable.
First Horizon’s EPS grew at a solid 12.4% compounded annual growth rate over the last five years, higher than its 5.4% annualized revenue growth. This tells us the company became more profitable on a per-share basis as it expanded.
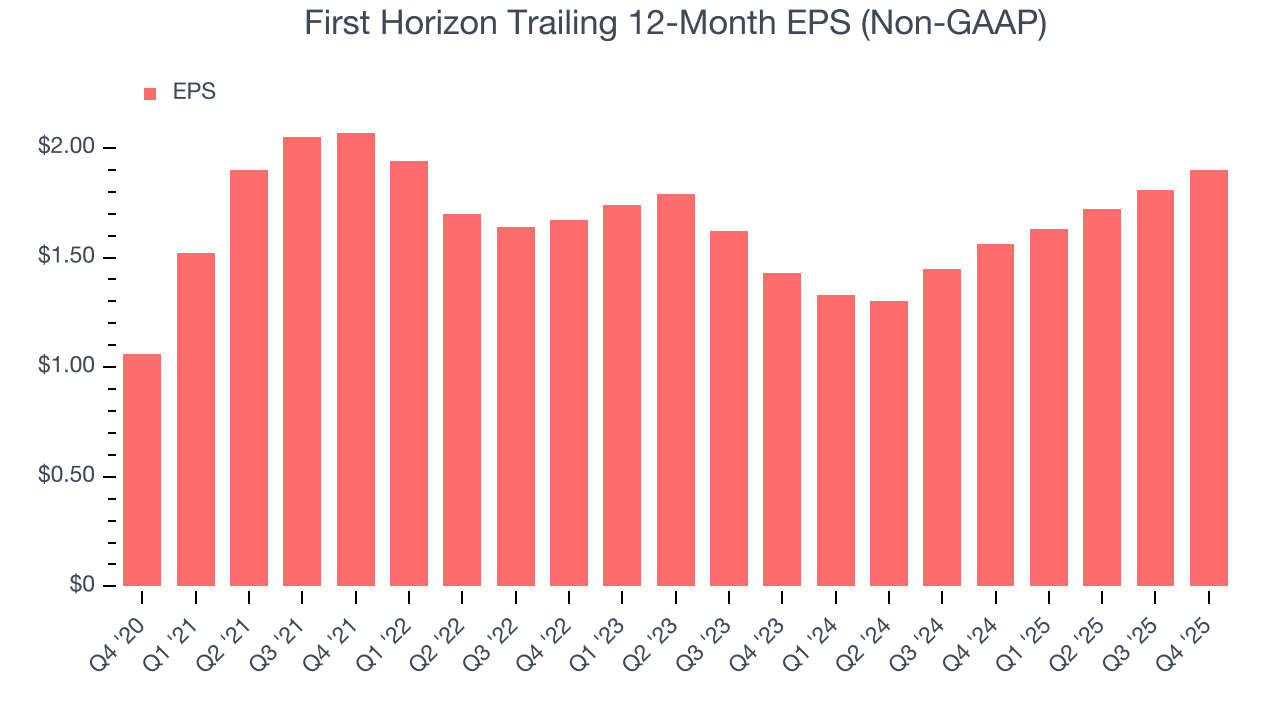
Like with revenue, we analyze EPS over a shorter period to see if we are missing a change in the business.
For First Horizon, its two-year annual EPS growth of 15.3% was higher than its five-year trend. We love it when earnings growth accelerates, especially when it accelerates off an already high base.
In Q4, First Horizon reported adjusted EPS of $0.52, up from $0.43 in the same quarter last year. This print easily cleared analysts’ estimates, and shareholders should be content with the results. Over the next 12 months, Wall Street expects First Horizon’s full-year EPS of $1.90 to grow 4.8%.
8. Tangible Book Value Per Share (TBVPS)
Banks are balance sheet-driven businesses because they generate earnings primarily through borrowing and lending. They’re also valued based on their balance sheet strength and ability to compound book value (another name for shareholders’ equity) over time.
This explains why tangible book value per share (TBVPS) stands as the premier banking metric. TBVPS strips away questionable intangible assets, revealing concrete per-share net worth that investors can trust. Other (and more commonly known) per-share metrics like EPS can sometimes be murky due to M&A or accounting rules allowing for loan losses to be spread out.
First Horizon’s TBVPS grew at a solid 6.8% annual clip over the last five years. TBVPS growth has also accelerated recently, growing by 8.2% annually over the last two years from $12.13 to $14.20 per share.
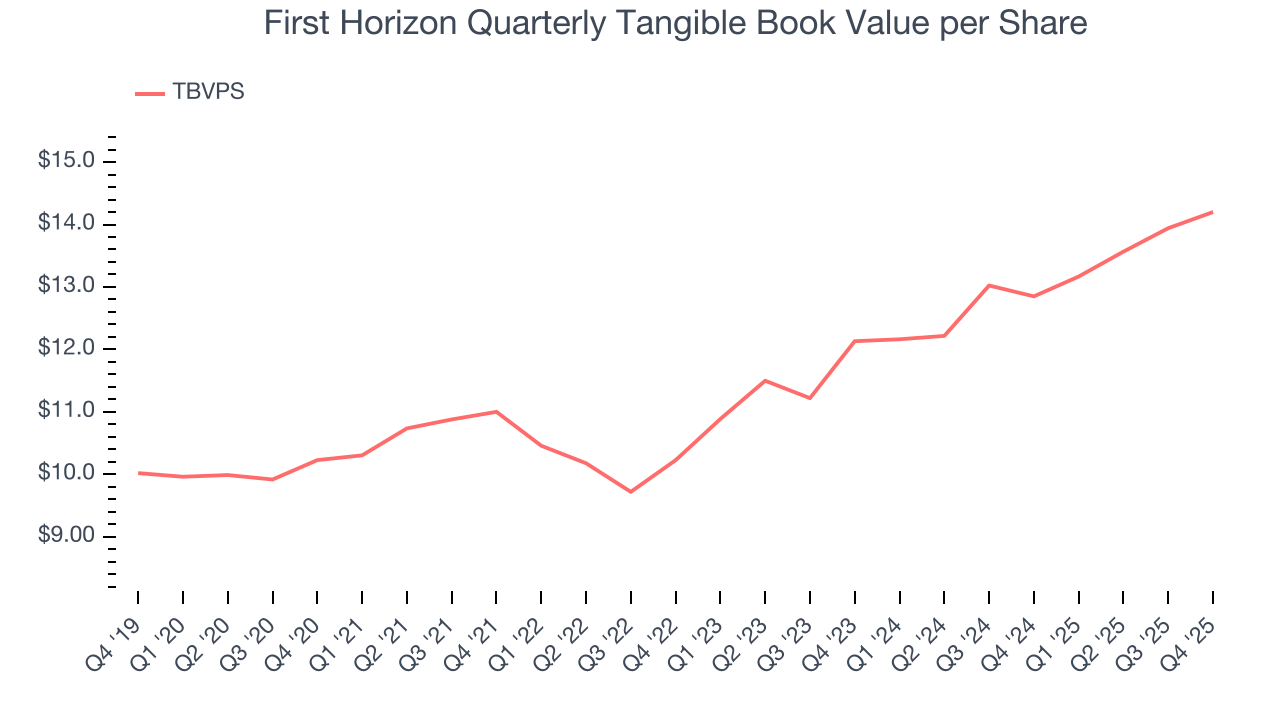
Over the next 12 months, Consensus estimates call for First Horizon’s TBVPS to grow by 4.9% to $14.90, lousy growth rate.
9. Balance Sheet Assessment
Leverage is core to a financial firm’s business model (loans funded by deposits). To ensure economic stability and avoid a repeat of the 2008 GFC, regulators require certain levels of capital and liquidity, focusing on the Tier 1 capital ratio.
Tier 1 capital is the highest-quality capital that a firm holds, consisting primarily of common stock and retained earnings, but also physical gold. It serves as the primary cushion against losses and is the first line of defense in times of financial distress.
This capital is divided by risk-weighted assets to derive the Tier 1 capital ratio. Risk-weighted means that cash and US treasury securities are assigned little risk while unsecured consumer loans and equity investments get much higher risk weights, for example.
New regulation after the 2008 financial crisis requires that all firms must maintain a Tier 1 capital ratio greater than 4.5%. On top of this, there are additional buffers based on scale, risk profile, and other regulatory classifications, so that at the end of the day, firms generally must maintain a 7-10% ratio at minimum.
Over the last two years, First Horizon has averaged a Tier 1 capital ratio of 11%, which is considered safe and well capitalized in the event that macro or market conditions suddenly deteriorate.
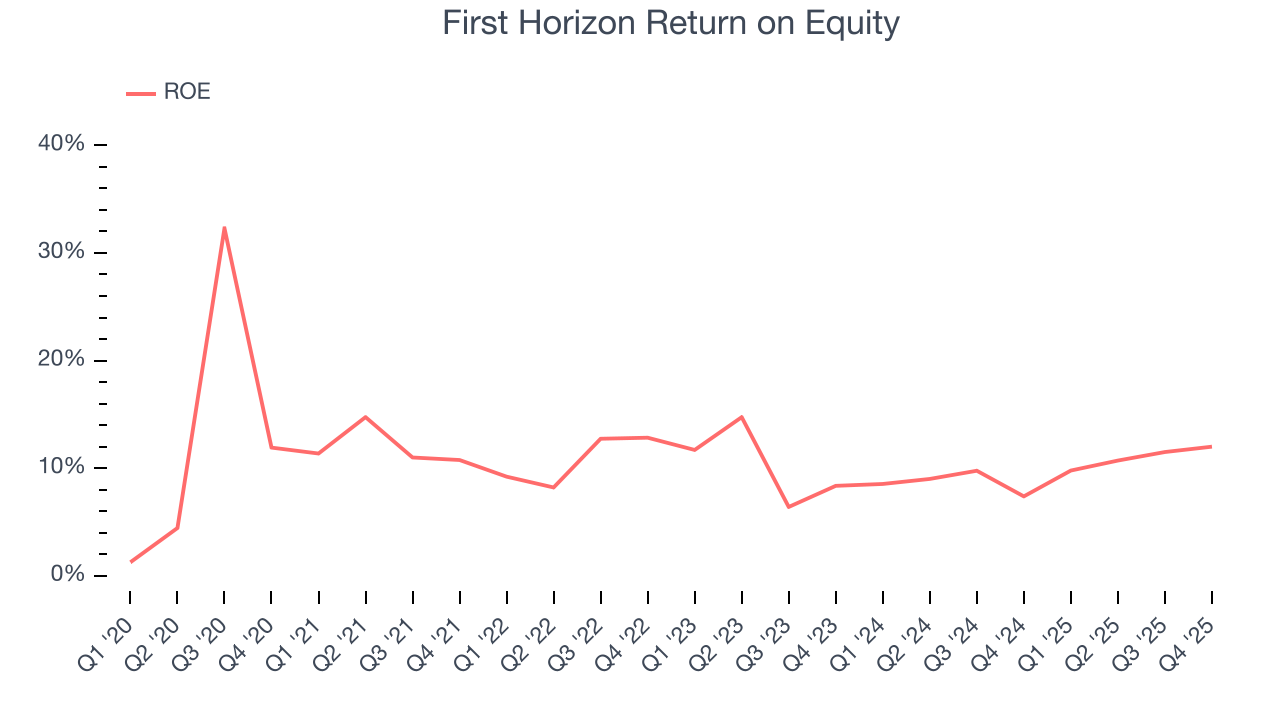
10. Return on Equity
Return on equity, or ROE, tells us how much profit a company generates for each dollar of shareholder equity, a key funding source for banks. Over a long period, banks with high ROE tend to compound shareholder wealth faster through retained earnings, buybacks, and dividends.
Over the last five years, First Horizon has averaged an ROE of 10.5%, respectable for a company operating in a sector where the average shakes out around 7.5% and those putting up 15%+ are greatly admired.
11. Key Takeaways from First Horizon’s Q4 Results
We enjoyed seeing First Horizon beat analysts’ revenue expectations this quarter. We were also glad its net interest income outperformed Wall Street’s estimates. While efficiency ratio missed, EPS ended up beating. Overall, we think this was a decent quarter with some key metrics above expectations. The stock remained flat at $24.25 immediately after reporting.
12. Is Now The Time To Buy First Horizon?
Updated: January 25, 2026 at 11:47 PM EST
When considering an investment in First Horizon, investors should account for its valuation and business qualities as well as what’s happened in the latest quarter.
First Horizon’s business quality ultimately falls short of our standards. First off, its revenue growth was uninspiring over the last five years, and analysts expect its demand to deteriorate over the next 12 months. And while its anticipated efficiency ratio over the next year signals it will gain leverage on its fixed costs, the downside is its estimated sales for the next 12 months are weak. On top of that, its estimated net interest income for the next 12 months are weak.
First Horizon’s P/B ratio based on the next 12 months is 1.3x. This valuation multiple is fair, but we don’t have much faith in the company. We're fairly confident there are better investments elsewhere.
Wall Street analysts have a consensus one-year price target of $27.32 on the company (compared to the current share price of $24.00).