Fair Isaac Corporation (FICO)
Fair Isaac Corporation is a world-class company. Its ability to balance growth and profitability while maintaining a bright outlook makes it a gem.― StockStory Analyst Team
1. News


2. Summary
Why We Like Fair Isaac Corporation
Creator of the three-digit number that can determine whether you get a mortgage or credit card, Fair Isaac Corporation (NYSE:FICO) develops analytics software and the widely used FICO Score, which is the standard measure of consumer credit risk in the United States.
- Annual revenue growth of 15.3% over the past two years was outstanding, reflecting market share gains this cycle
- Earnings per share have massively outperformed its peers over the last five years, increasing by 24% annually
- Exciting sales outlook for the upcoming 12 months calls for 26.3% growth, an acceleration from its two-year trend


We see a bright future for Fair Isaac Corporation. The valuation seems reasonable relative to its quality, and we think now is a favorable time to invest.
Why Is Now The Time To Buy Fair Isaac Corporation?


At $1,345 per share, Fair Isaac Corporation trades at 29.7x forward P/E. Most companies in the business services sector may feature a cheaper multiple, but we think Fair Isaac Corporation is priced fairly given its fundamentals.
By definition, where you buy a stock impacts returns. But according to our work on the topic, business quality is a much bigger determinant of market outperformance over the long term compared to entry price.
3. Fair Isaac Corporation (FICO) Research Report: Q4 CY2025 Update
Credit scoring and analytics company FICO (NYSE:FICO) reported revenue ahead of Wall Streets expectations in Q4 CY2025, with sales up 16.4% year on year to $512 million. On the other hand, the company’s full-year revenue guidance of $2.35 billion at the midpoint came in 3.7% below analysts’ estimates. Its non-GAAP profit of $7.33 per share was 3.5% above analysts’ consensus estimates.
Fair Isaac Corporation (FICO) Q4 CY2025 Highlights:
- Revenue: $512 million vs analyst estimates of $502.7 million (16.4% year-on-year growth, 1.8% beat)
- Adjusted EPS: $7.33 vs analyst estimates of $7.08 (3.5% beat)
- Adjusted EBITDA: $282.3 million vs analyst estimates of $270 million (55.1% margin, 4.6% beat)
- The company reconfirmed its revenue guidance for the full year of $2.35 billion at the midpoint
- Operating Margin: 45.7%, up from 40.8% in the same quarter last year
- Free Cash Flow Margin: 32.3%, down from 42.5% in the same quarter last year
- Market Capitalization: $36.72 billion
Company Overview
Creator of the three-digit number that can determine whether you get a mortgage or credit card, Fair Isaac Corporation (NYSE:FICO) develops analytics software and the widely used FICO Score, which is the standard measure of consumer credit risk in the United States.
The company operates through two segments: Scores and Software. The Scores segment provides the FICO Score to businesses through credit bureaus and directly to consumers through myFICO.com. These scores, ranging from 300-850, analyze consumer credit data to predict future repayment behavior, with higher scores indicating lower risk. Financial institutions pay a fee each time a score is generated, creating a high-margin, transaction-based revenue stream.
The Software segment offers analytics and decision management solutions that help businesses automate complex decisions. FICO Platform serves as the foundation for many offerings, enabling customers to develop customized solutions for credit origination, fraud detection, customer management, and marketing. Notable products include FICO Decision Modeler for rules-based decision making, FICO Xpress Optimization for solving complex business problems, and industry-specific solutions like FICO Fraud Solutions.
FICO's technology helps a bank decide whether to approve a credit card application, enables an auto lender to detect potential fraud, or assists an insurer in evaluating risk. The company continually updates its scoring models to improve predictive accuracy, with recent innovations including the FICO Resilience Index and alternative data scores to expand credit access for consumers with limited credit history.
4. Data & Business Process Services
A combination of increasing reliance on data and analytics across various industries and the desire for cost efficiency through outsourcing could mean that companies in this space gain. As functions such as payroll, HR, and credit risk assessment rely on more digitization, key players in the data & business process services industry could be increased demand. On the other hand, the sector faces headwinds from growing regulatory scrutiny on data privacy and security, with laws like GDPR and evolving U.S. regulations potentially limiting data collection and monetization strategies. Additionally, rising cyber threats pose risks to firms handling sensitive personal and financial information, creating outsized headline risk when things go wrong in this area.
FICO's competitors in the credit scoring market include VantageScore (a joint venture of the three major U.S. credit bureaus), CRIF Ratings in Europe, and in-house analytics developed by financial institutions. In software, FICO competes with Experian (EXPN), Equifax (EFX), Nice Actimize (NICE), Pegasystems (PEGA), SAS, IBM, and Adobe across various application areas.
5. Revenue Growth
A company’s long-term sales performance can indicate its overall quality. Any business can experience short-term success, but top-performing ones enjoy sustained growth for years.
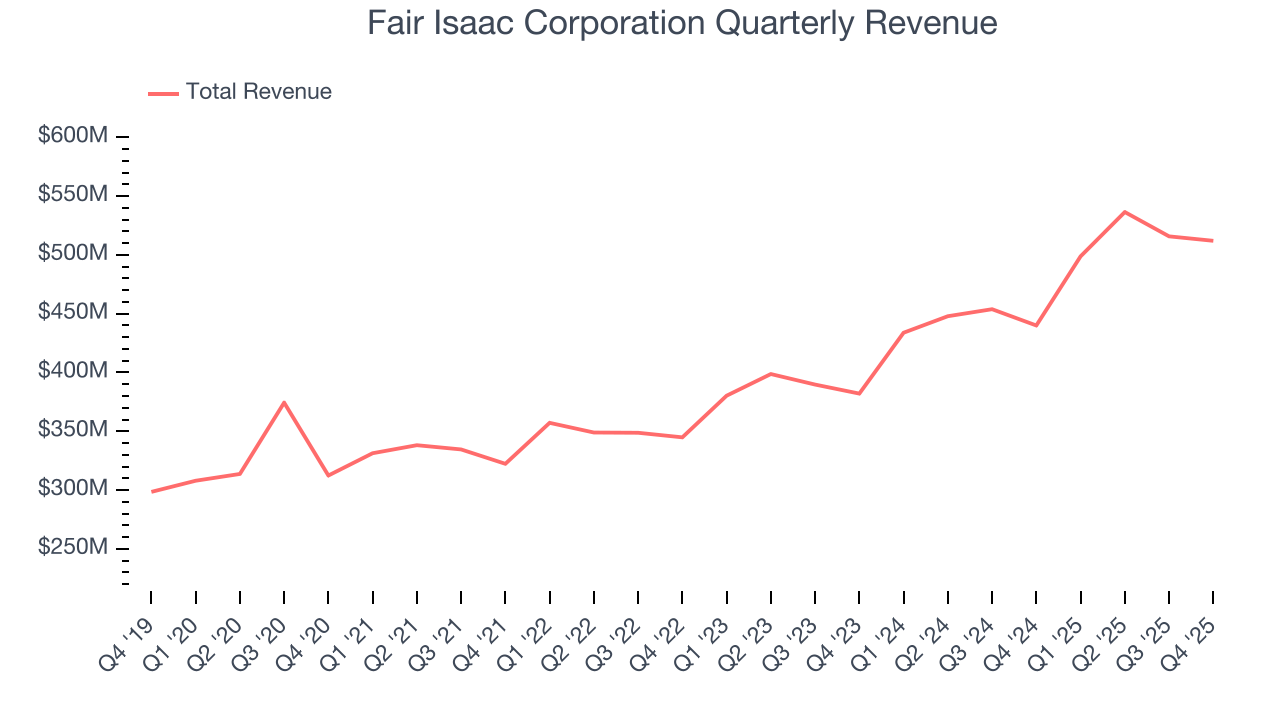
With $2.06 billion in revenue over the past 12 months, Fair Isaac Corporation is a mid-sized business services company, which sometimes brings disadvantages compared to larger competitors benefiting from better economies of scale. On the bright side, it can still flex high growth rates because it’s working from a smaller revenue base.
As you can see below, Fair Isaac Corporation’s sales grew at an impressive 9.5% compounded annual growth rate over the last five years. This is a great starting point for our analysis because it shows Fair Isaac Corporation’s demand was higher than many business services companies.
Long-term growth is the most important, but within business services, a half-decade historical view may miss new innovations or demand cycles. Fair Isaac Corporation’s annualized revenue growth of 15.3% over the last two years is above its five-year trend, suggesting its demand was strong and recently accelerated. 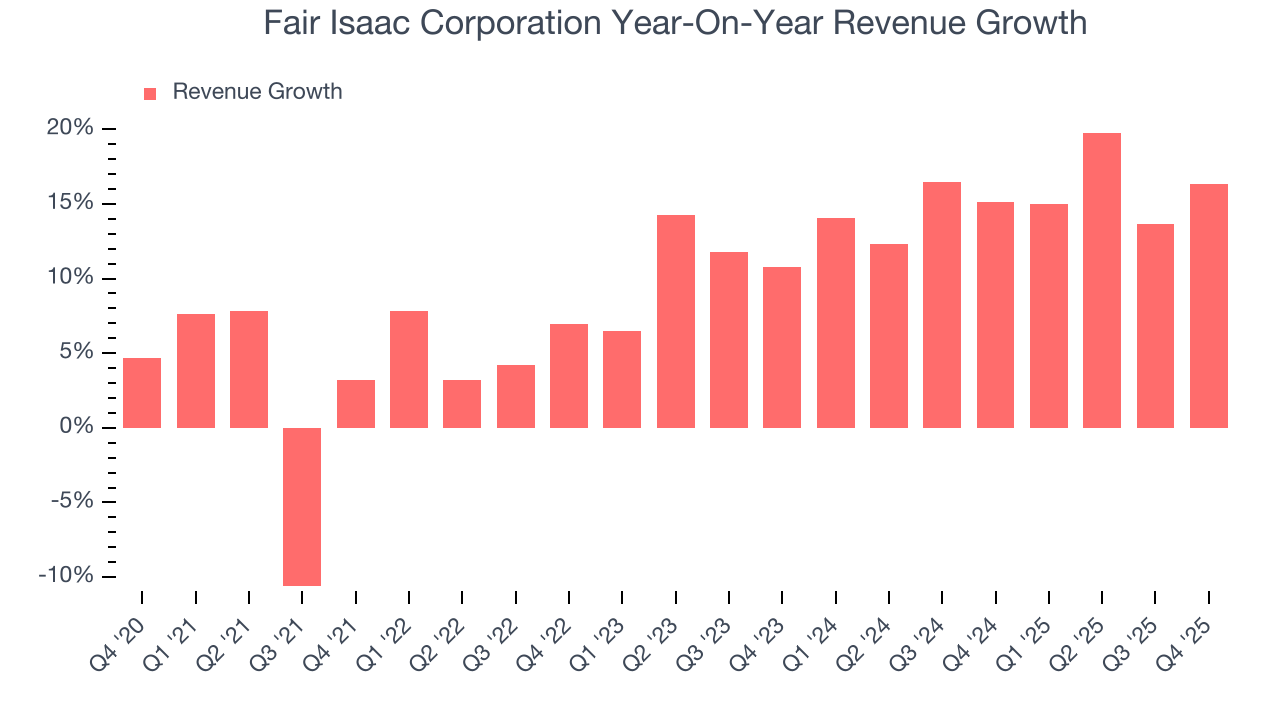
This quarter, Fair Isaac Corporation reported year-on-year revenue growth of 16.4%, and its $512 million of revenue exceeded Wall Street’s estimates by 1.8%.
Looking ahead, sell-side analysts expect revenue to grow 24.6% over the next 12 months, an improvement versus the last two years. This projection is eye-popping and suggests its newer products and services will catalyze better top-line performance.
6. Operating Margin
Fair Isaac Corporation has been a well-oiled machine over the last five years. It demonstrated elite profitability for a business services business, boasting an average operating margin of 43%.
Looking at the trend in its profitability, Fair Isaac Corporation’s operating margin rose by 7.8 percentage points over the last five years, as its sales growth gave it immense operating leverage.
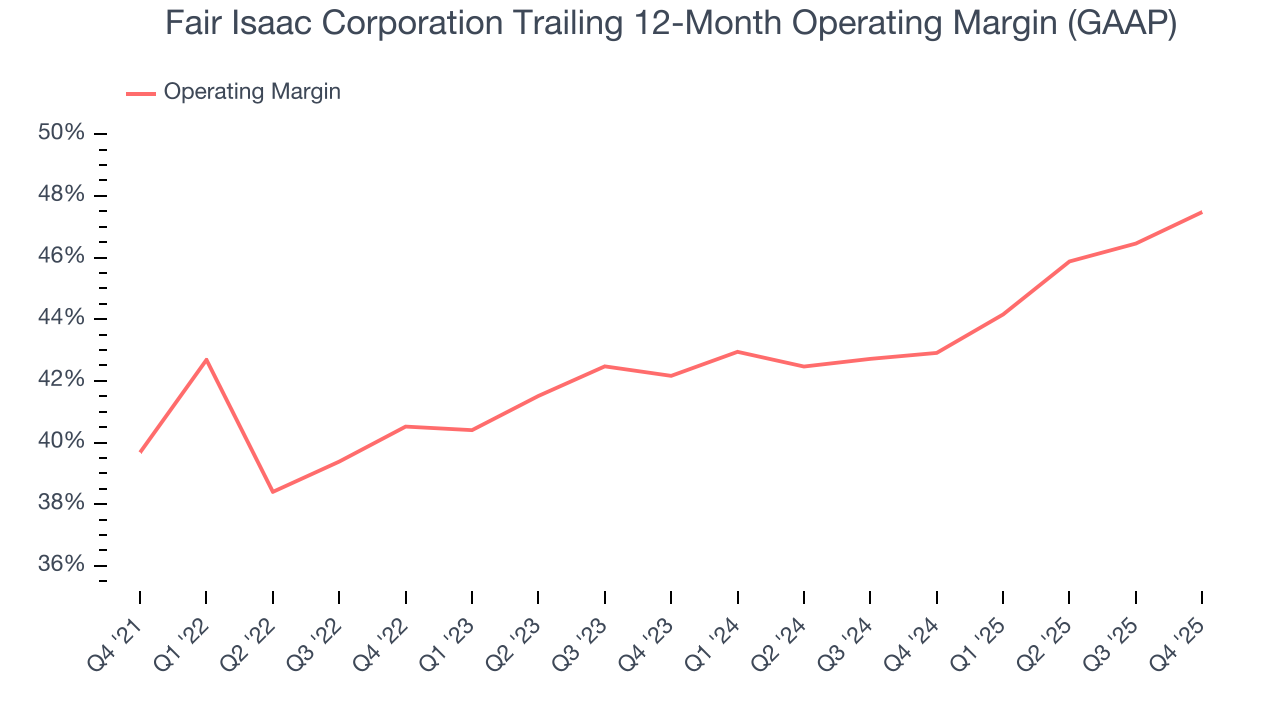
This quarter, Fair Isaac Corporation generated an operating margin profit margin of 45.7%, up 4.9 percentage points year on year. This increase was a welcome development and shows it was more efficient.
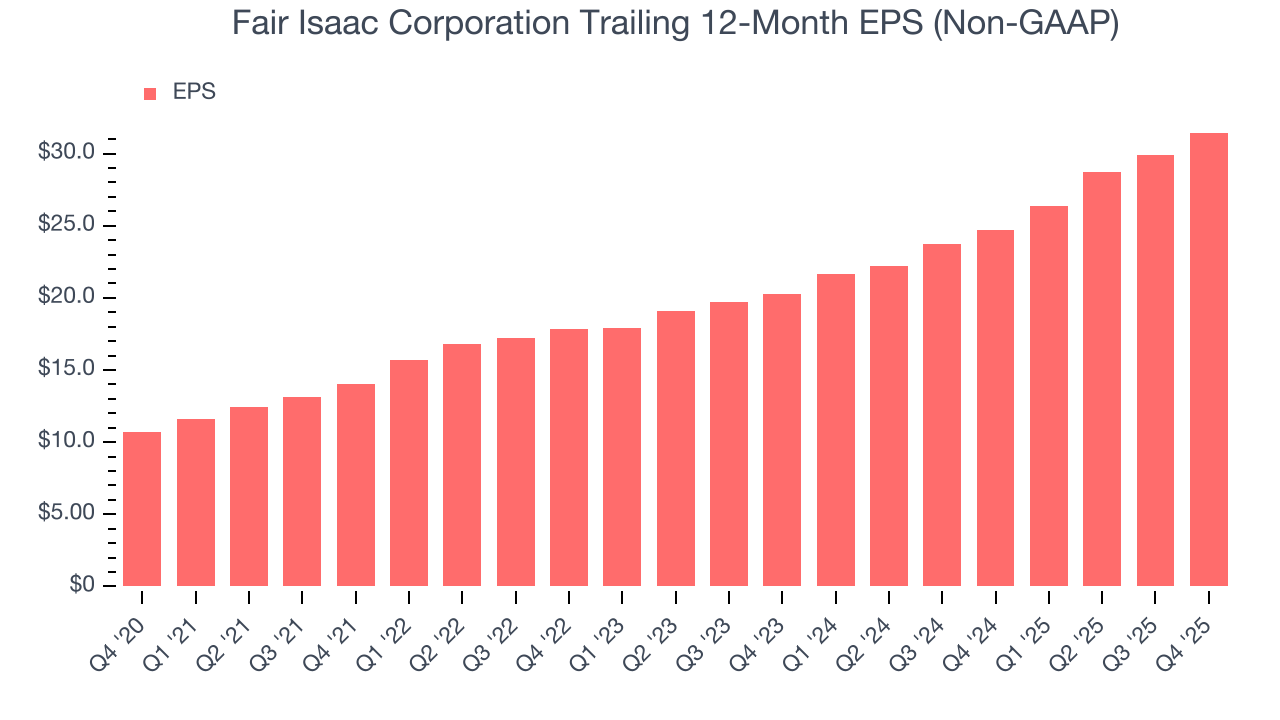
7. Earnings Per Share
We track the long-term change in earnings per share (EPS) for the same reason as long-term revenue growth. Compared to revenue, however, EPS highlights whether a company’s growth is profitable.
Fair Isaac Corporation’s EPS grew at an astounding 24% compounded annual growth rate over the last five years, higher than its 9.5% annualized revenue growth. This tells us the company became more profitable on a per-share basis as it expanded.
Diving into the nuances of Fair Isaac Corporation’s earnings can give us a better understanding of its performance. As we mentioned earlier, Fair Isaac Corporation’s operating margin expanded by 7.8 percentage points over the last five years. On top of that, its share count shrank by 19.6%. These are positive signs for shareholders because improving profitability and share buybacks turbocharge EPS growth relative to revenue growth. 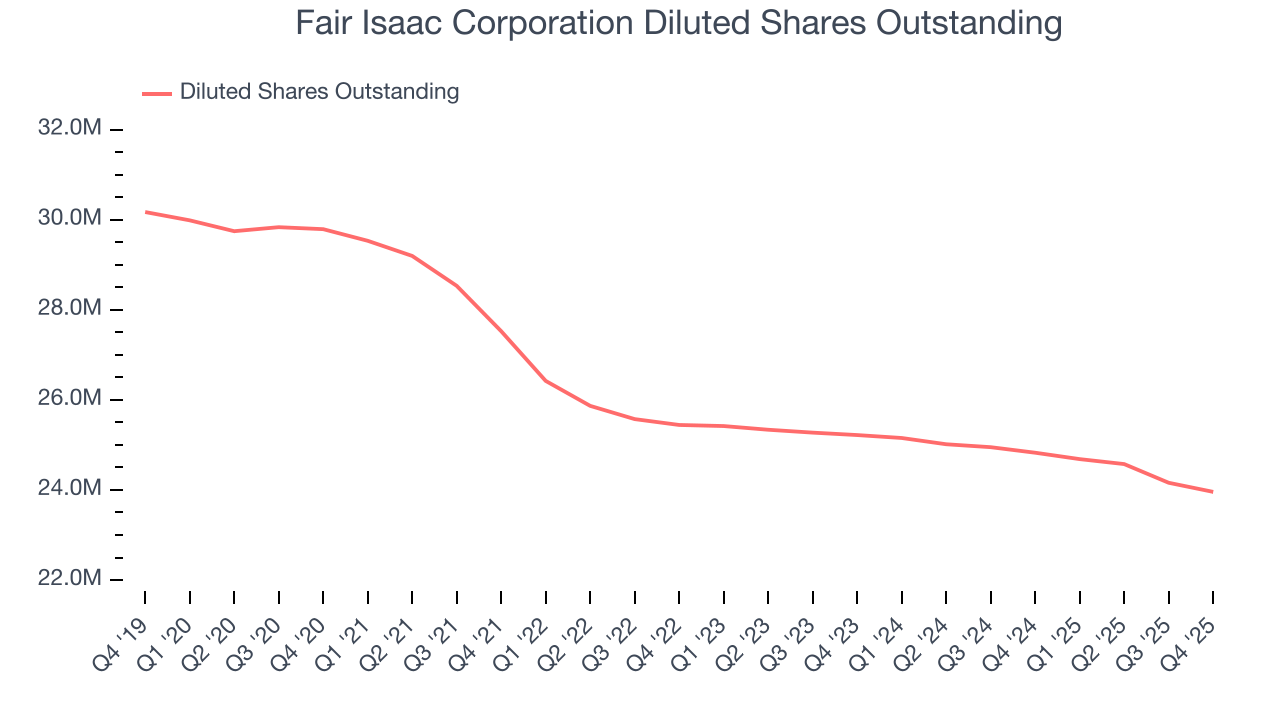
Like with revenue, we analyze EPS over a more recent period because it can provide insight into an emerging theme or development for the business.
For Fair Isaac Corporation, its two-year annual EPS growth of 24.6% is similar to its five-year trend, implying strong and stable earnings power.
In Q4, Fair Isaac Corporation reported adjusted EPS of $7.33, up from $5.79 in the same quarter last year. This print beat analysts’ estimates by 3.5%. Over the next 12 months, Wall Street expects Fair Isaac Corporation’s full-year EPS of $31.45 to grow 41.5%.
8. Cash Is King
Although earnings are undoubtedly valuable for assessing company performance, we believe cash is king because you can’t use accounting profits to pay the bills.
Fair Isaac Corporation has shown terrific cash profitability, enabling it to reinvest, return capital to investors, and stay ahead of the competition while maintaining an ample cushion. The company’s free cash flow margin was among the best in the business services sector, averaging an eye-popping 34.9% over the last five years.
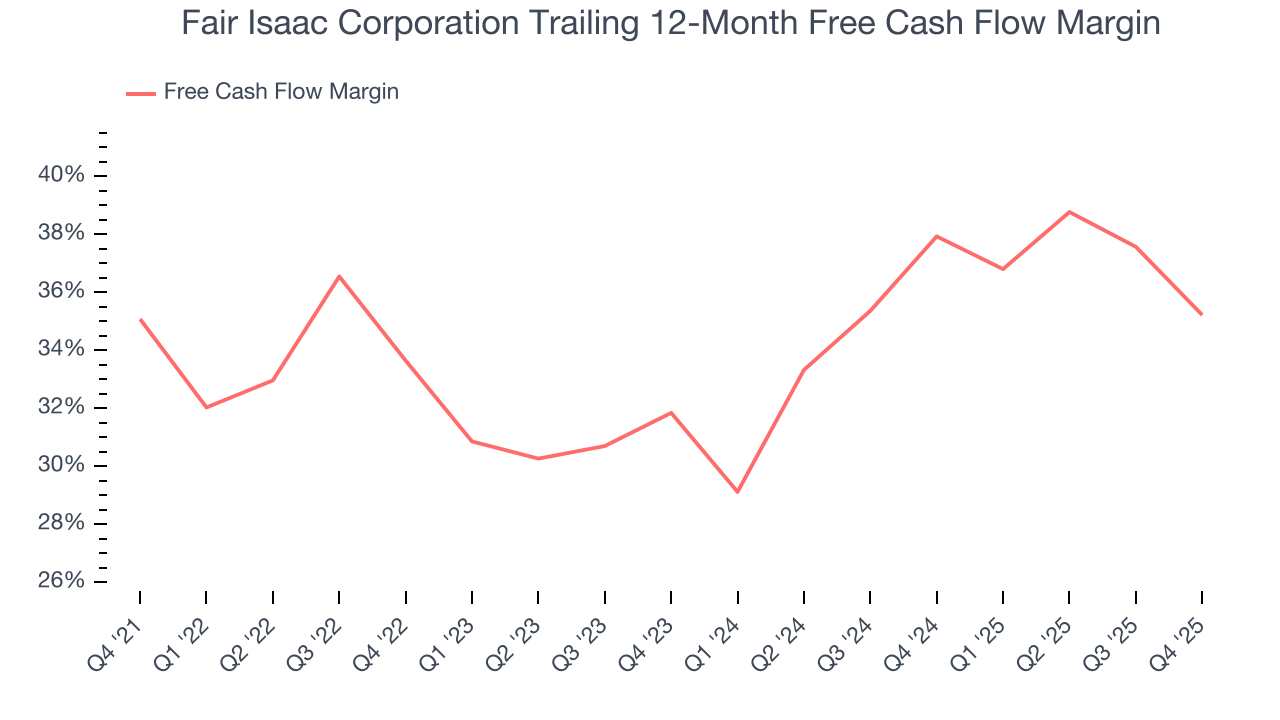
Fair Isaac Corporation’s free cash flow clocked in at $165.4 million in Q4, equivalent to a 32.3% margin. The company’s cash profitability regressed as it was 10.2 percentage points lower than in the same quarter last year, but we wouldn’t read too much into the short term because investment needs can be seasonal, causing temporary swings. Long-term trends carry greater meaning.
9. Return on Invested Capital (ROIC)
EPS and free cash flow tell us whether a company was profitable while growing its revenue. But was it capital-efficient? Enter ROIC, a metric showing how much operating profit a company generates relative to the money it has raised (debt and equity).
Fair Isaac Corporation’s five-year average ROIC was 56.8%, placing it among the best business services companies. This illustrates its management team’s ability to invest in highly profitable ventures and produce tangible results for shareholders.
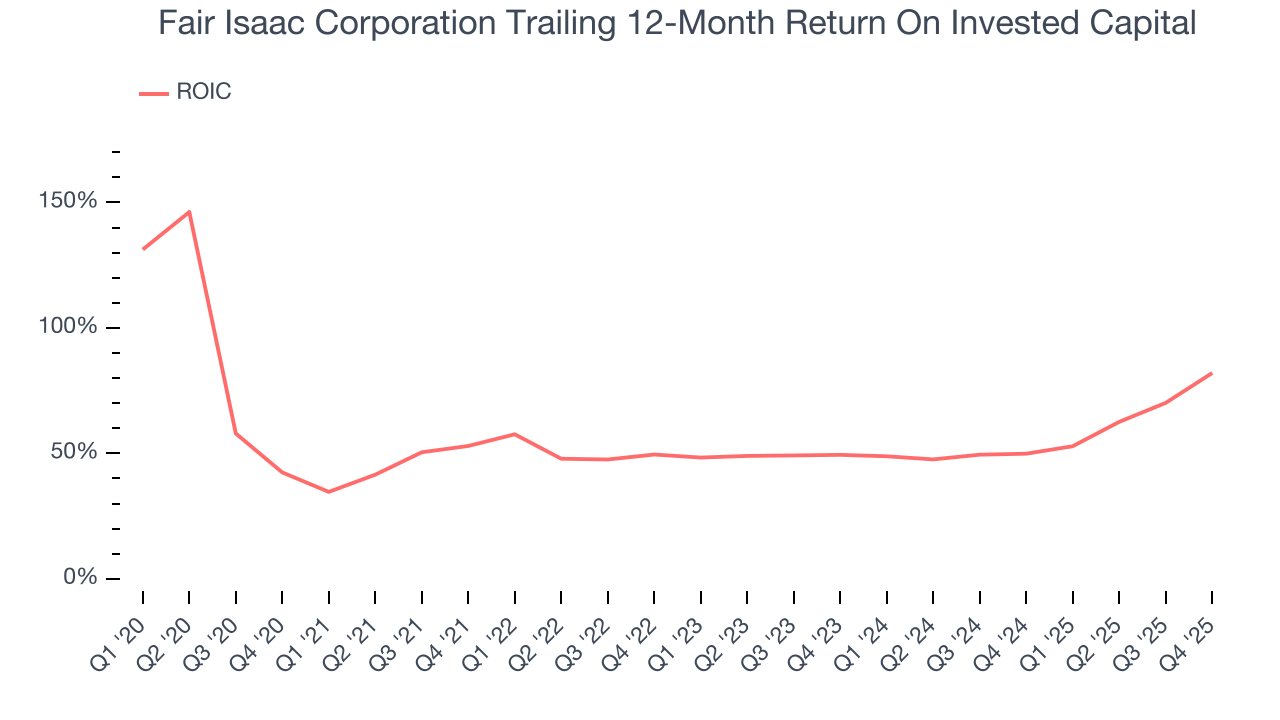
We like to invest in businesses with high returns, but the trend in a company’s ROIC is what often surprises the market and moves the stock price. Fortunately, Fair Isaac Corporation’s ROIC has increased significantly over the last few years. This is a great sign when paired with its already strong returns. It could suggest its competitive advantage or profitable growth opportunities are expanding.
10. Balance Sheet Assessment
Fair Isaac Corporation reported $162 million of cash and $2.81 billion of debt on its balance sheet in the most recent quarter. As investors in high-quality companies, we primarily focus on two things: 1) that a company’s debt level isn’t too high and 2) that its interest payments are not excessively burdening the business.
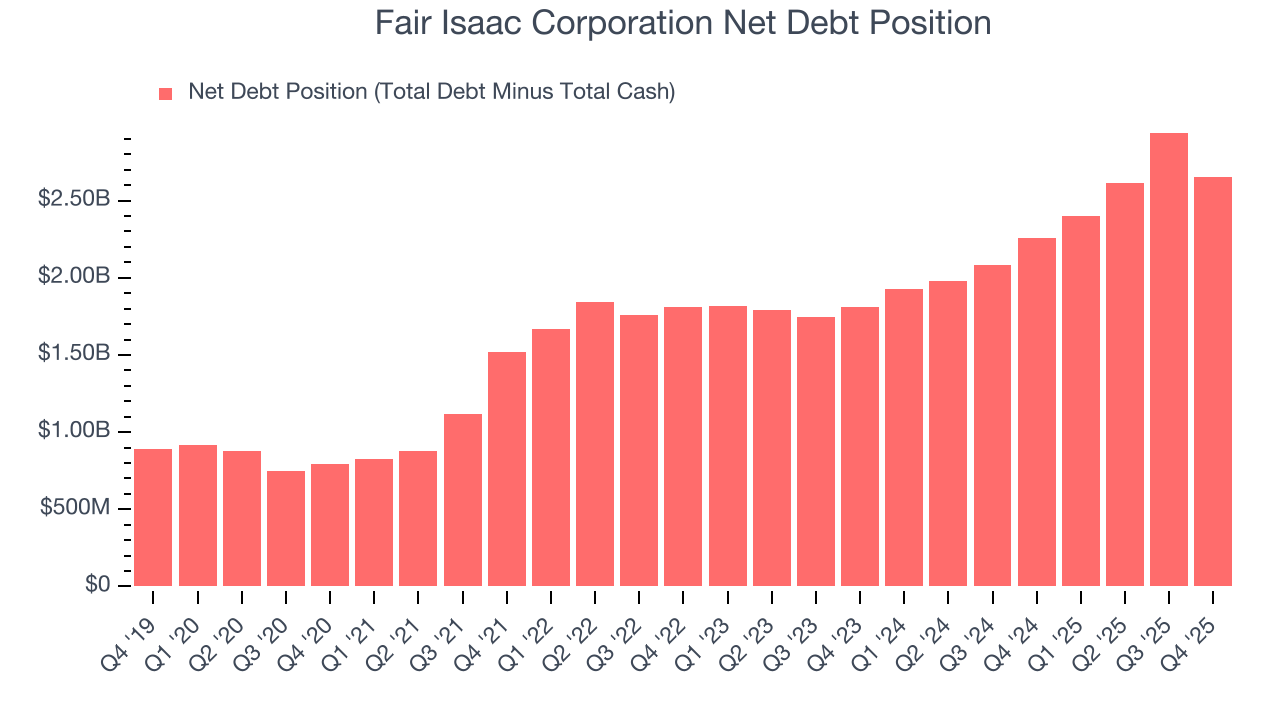
With $1.17 billion of EBITDA over the last 12 months, we view Fair Isaac Corporation’s 2.3× net-debt-to-EBITDA ratio as safe. We also see its $104.2 million of annual interest expenses as appropriate. The company’s profits give it plenty of breathing room, allowing it to continue investing in growth initiatives.
11. Key Takeaways from Fair Isaac Corporation’s Q4 Results
It was encouraging to see Fair Isaac Corporation beat analysts’ revenue expectations this quarter. We were also glad its EPS outperformed Wall Street’s estimates. On the other hand, its full-year revenue guidance missed. Overall, this was a softer quarter. The stock traded up 1.8% to $1,553 immediately following the results.
12. Is Now The Time To Buy Fair Isaac Corporation?
Updated: February 13, 2026 at 11:53 PM EST
The latest quarterly earnings matters, sure, but we actually think longer-term fundamentals and valuation matter more. Investors should consider all these pieces before deciding whether or not to invest in Fair Isaac Corporation.
Fair Isaac Corporation is a cream-of-the-crop business services company. For starters, its revenue growth was impressive over the last five years and is expected to accelerate over the next 12 months. On top of that, its powerful free cash flow generation enables it to stay ahead of the competition through consistent reinvestment of profits, and its impressive operating margins show it has a highly efficient business model.
Fair Isaac Corporation’s P/E ratio based on the next 12 months is 29.7x. Scanning the business services landscape today, Fair Isaac Corporation’s fundamentals clearly illustrate that it’s an elite business, and we like it at this price.
Wall Street analysts have a consensus one-year price target of $2,001 on the company (compared to the current share price of $1,345), implying they see 48.8% upside in buying Fair Isaac Corporation in the short term.