
Flagstar Financial (FLG)
Flagstar Financial keeps us up at night. Its poor returns on capital indicate it barely generated any profits, a must for high-quality companies.― StockStory Analyst Team
1. News


2. Summary
Why We Think Flagstar Financial Will Underperform
Tracing its roots back to 1859 and rebranded from New York Community Bancorp in 2024, Flagstar Financial (NYSE:FLG) is a bank holding company that offers commercial and consumer banking services, with specialties in multi-family lending, mortgage originations, and warehouse lending.
- Customers postponed purchases of its products and services this cycle as its revenue declined by 25.1% annually over the last two years
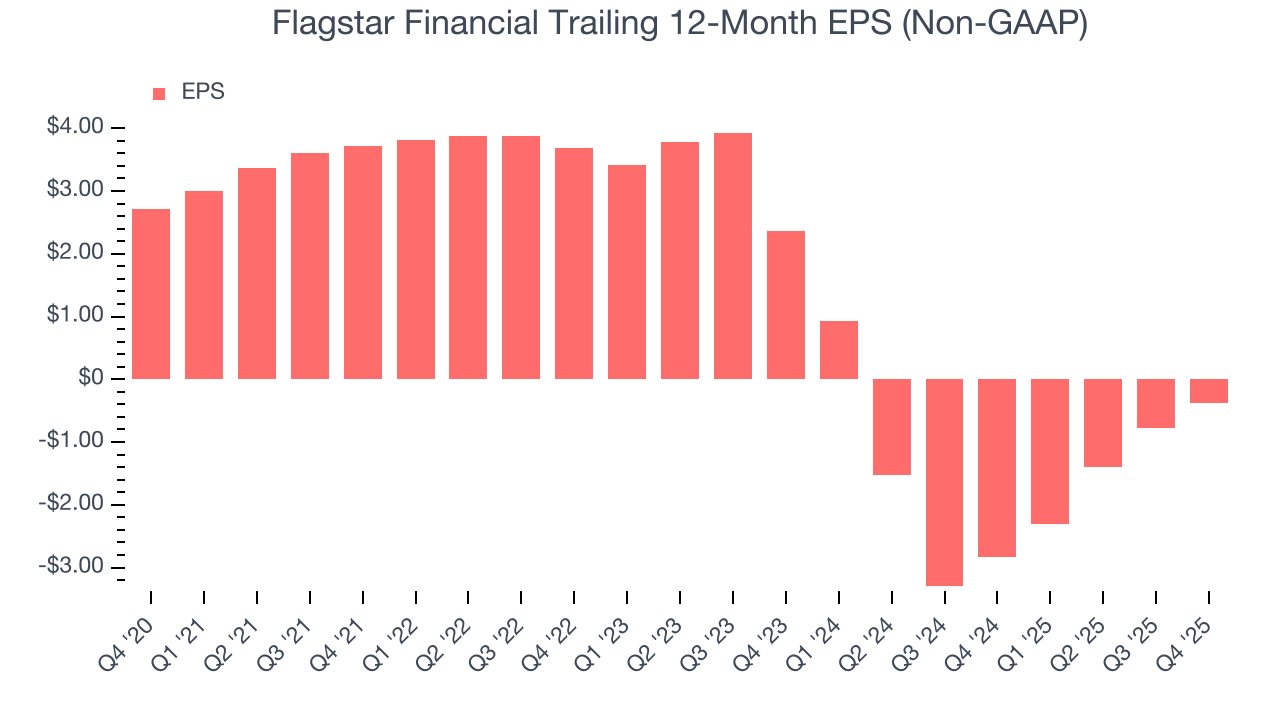
- Performance over the past five years shows its incremental sales were much less profitable, as its earnings per share fell by 16.4% annually
- Annual tangible book value per share declines of 9% for the past five years show its capital management struggled during this cycle


Flagstar Financial is in the doghouse. We see more attractive opportunities in the market.
Why There Are Better Opportunities Than Flagstar Financial


Flagstar Financial’s stock price of $13.51 implies a valuation ratio of 0.8x forward P/B. This sure is a cheap multiple, but you get what you pay for.
Cheap stocks can look like a great deal at first glance, but they can be value traps. They often have less earnings power, meaning there is more reliance on a re-rating to generate good returns - an unlikely scenario for low-quality companies.
3. Flagstar Financial (FLG) Research Report: Q4 CY2025 Update
Regional banking company Flagstar Financial (NYSE:FLG) reported Q4 CY2025 results topping the market’s revenue expectations, but sales fell by 2.4% year on year to $557 million. Its non-GAAP profit of $0.06 per share was significantly above analysts’ consensus estimates.
Flagstar Financial (FLG) Q4 CY2025 Highlights:
- Net Interest Income: $467 million vs analyst estimates of $453.1 million (1.3% year-on-year growth, 3.1% beat)
- Net Interest Margin: 2.1% vs analyst estimates of 2.1% (8.5 basis point beat)
- Revenue: $557 million vs analyst estimates of $531.1 million (2.4% year-on-year decline, 4.9% beat)
- Efficiency Ratio: 91.3% vs analyst estimates of 86% (525.1 basis point miss)
- Adjusted EPS: $0.06 vs analyst estimates of $0.02 (significant beat)
- Tangible Book Value per Share: $15.82 vs analyst estimates of $16.42 (8.5% year-on-year decline, 3.7% miss)
- Market Capitalization: $5.63 billion
Company Overview
Tracing its roots back to 1859 and rebranded from New York Community Bancorp in 2024, Flagstar Financial (NYSE:FLG) is a bank holding company that offers commercial and consumer banking services, with specialties in multi-family lending, mortgage originations, and warehouse lending.
Flagstar operates through its primary subsidiary, Flagstar Bank, which maintains a significant presence in the Northeast and Midwest while expanding into high-growth markets in the Southeast and West Coast. The bank specializes in several distinct lending areas, with particular strength in multi-family lending focused on rent-regulated apartment buildings in New York City.
The company's loan portfolio is diversified across multiple segments. Its commercial real estate division finances income-producing properties like office buildings and retail centers, while its acquisition, development, and construction loans support real estate projects. Through its commercial and industrial lending, Flagstar provides working capital, equipment financing, and other business solutions to small and mid-sized companies.
A distinguishing feature of Flagstar is its national warehouse lending platform, which provides lines of credit to other mortgage lenders, allowing them to fund residential mortgage closings. This wholesale mortgage network includes approximately 3,000 third-party originators. For high-net-worth individuals, the bank offers specialized private banking services through 134 teams located primarily in the New York metropolitan area and the West Coast.
Flagstar generates revenue through interest income on its loan portfolio, fees from its mortgage origination and servicing operations, and deposit services. Customers access these services through physical branches, ATMs, online banking platforms, and mobile applications. The bank's deposits are insured by the Federal Deposit Insurance Corporation, and as a financial institution, Flagstar operates under the regulatory oversight of agencies including the Office of the Comptroller of the Currency and the Federal Reserve.
4. Thrifts & Mortgage Finance
Thrifts & Mortgage Finance institutions operate by accepting deposits and extending loans primarily for residential mortgages, earning revenue through interest rate spreads (difference between lending rates and borrowing costs) and origination fees. The industry benefits from demographic tailwinds as millennials enter prime homebuying age, technological advancements streamlining the loan approval process, and potential interest rate stabilization improving affordability. However, significant headwinds include net interest margin compression during rate volatility, increased competition from fintech disruptors offering digital-first experiences, mounting regulatory compliance costs, and potential housing market corrections that could impact loan portfolios and default rates.
Flagstar Financial competes with regional banks like KeyCorp (NYSE:KEY), Fifth Third Bancorp (NASDAQ:FITB), and Huntington Bancshares (NASDAQ:HBAN), as well as larger national institutions such as JPMorgan Chase (NYSE:JPM) and Bank of America (NYSE:BAC) in its banking operations, and with specialized mortgage lenders like Rocket Companies (NYSE:RKT) in its mortgage business.
5. Sales Growth
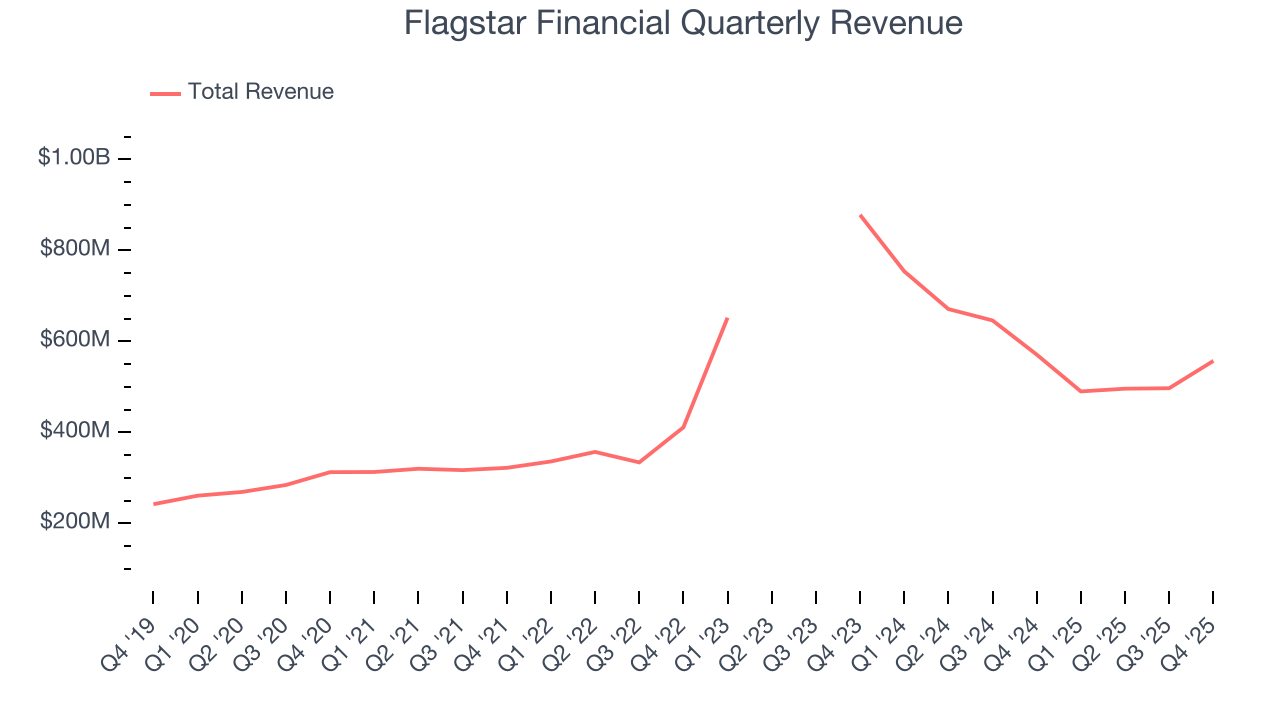
Net interest income and and fee-based revenue are the two pillars supporting bank earnings. The former captures profit from the gap between lending rates and deposit costs, while the latter encompasses charges for banking services, credit products, wealth management, and trading activities. Over the last five years, Flagstar Financial grew its revenue at a solid 12.6% compounded annual growth rate. Its growth beat the average banking company and shows its offerings resonate with customers.
 Note: Quarters not shown were determined to be outliers, impacted by outsized investment gains/losses that are not indicative of the recurring fundamentals of the business.
Long-term growth is the most important, but within financials, a half-decade historical view may miss recent interest rate changes and market returns. Flagstar Financial’s recent performance marks a sharp pivot from its five-year trend as its revenue has shown annualized declines of 25.1% over the last two years. 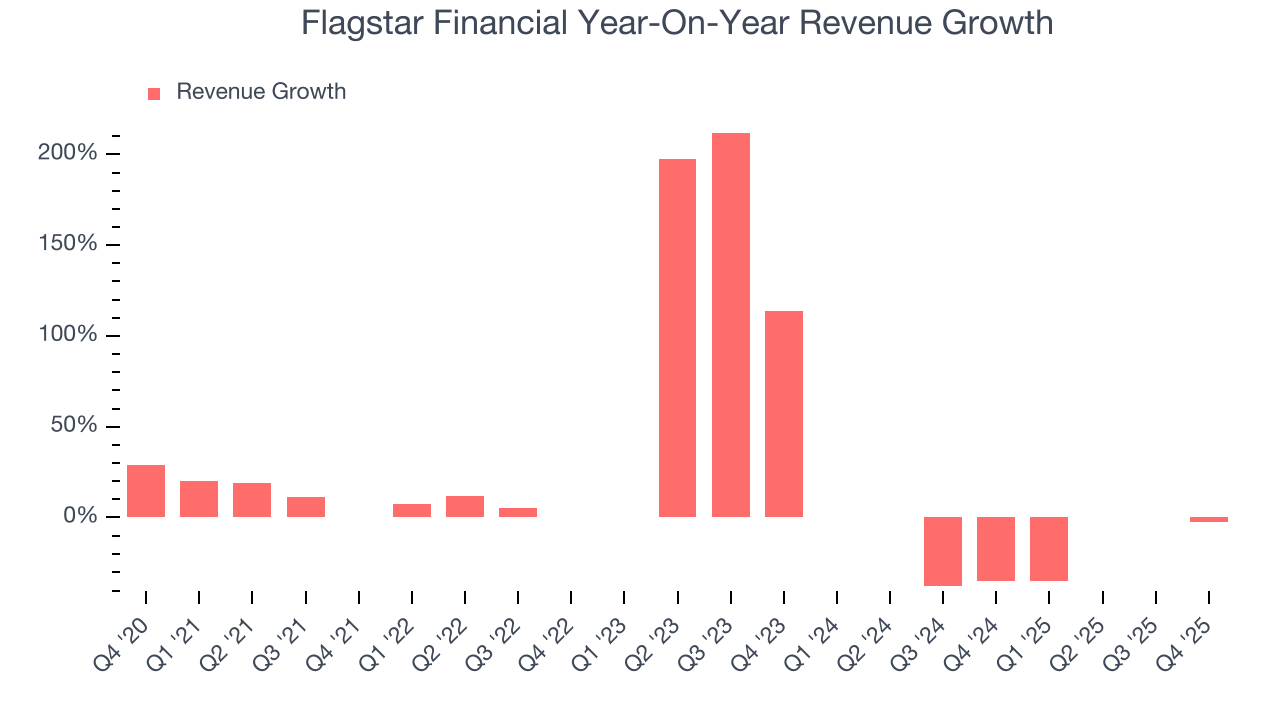 Note: Quarters not shown were determined to be outliers, impacted by outsized investment gains/losses that are not indicative of the recurring fundamentals of the business.
This quarter, Flagstar Financial’s revenue fell by 2.4% year on year to $557 million but beat Wall Street’s estimates by 4.9%.
Net interest income made up 89.8% of the company’s total revenue during the last five years, meaning Flagstar Financial barely relies on non-interest income to drive its overall growth.
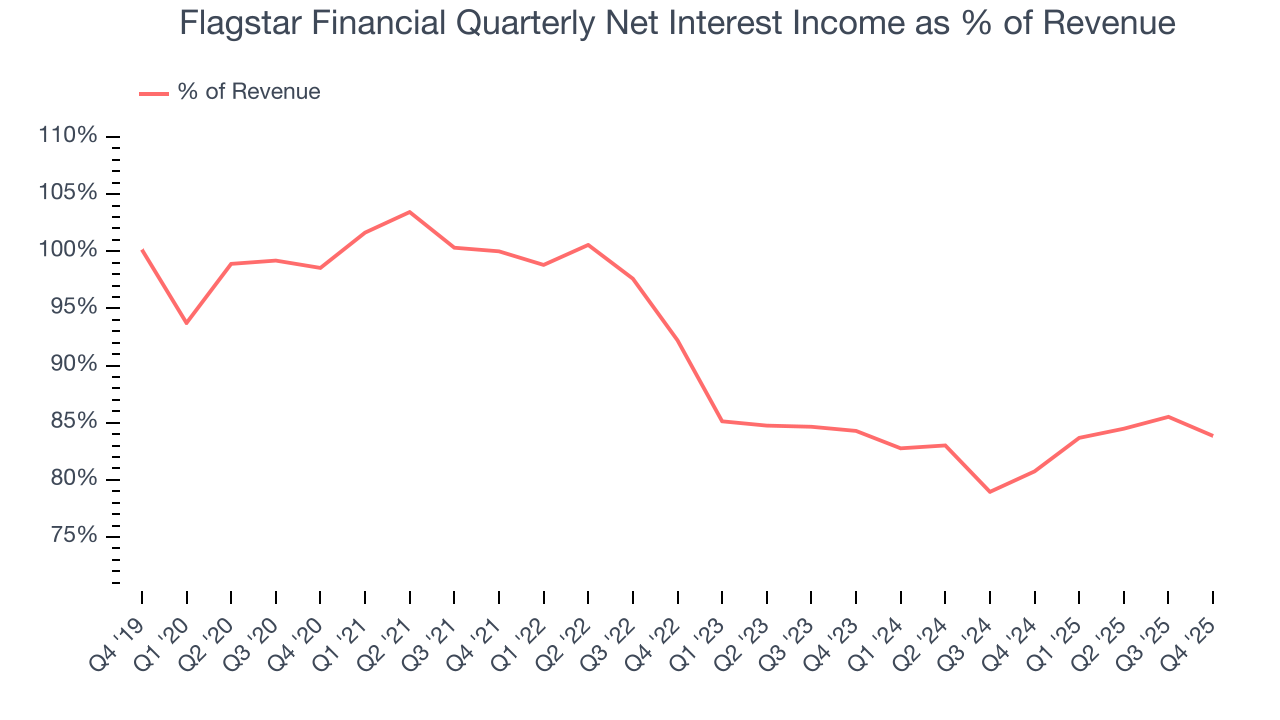
Our experience and research show the market cares primarily about a bank’s net interest income growth as non-interest income is considered a lower-quality and non-recurring revenue source.
6. Efficiency Ratio
Topline growth alone doesn't tell the complete story - the profitability of that growth shapes actual earnings impact. Banks track this dynamic through efficiency ratios, which compare non-interest expenses such as personnel, rent, IT, and marketing costs to total revenue streams.
Investors focus on efficiency ratio changes rather than absolute levels, understanding that expense structures vary by revenue mix. Counterintuitively, lower efficiency ratios indicate better performance since they represent lower costs relative to revenue.
Over the last four years, Flagstar Financial’s efficiency ratio has increased by 54.3 percentage points, going from 38.6% to 92.9%. Said differently, the company’s expenses have increased at a faster rate than revenue, which usually raises questions unless the company is in high-growth mode and reinvesting its profits into attractive ventures.
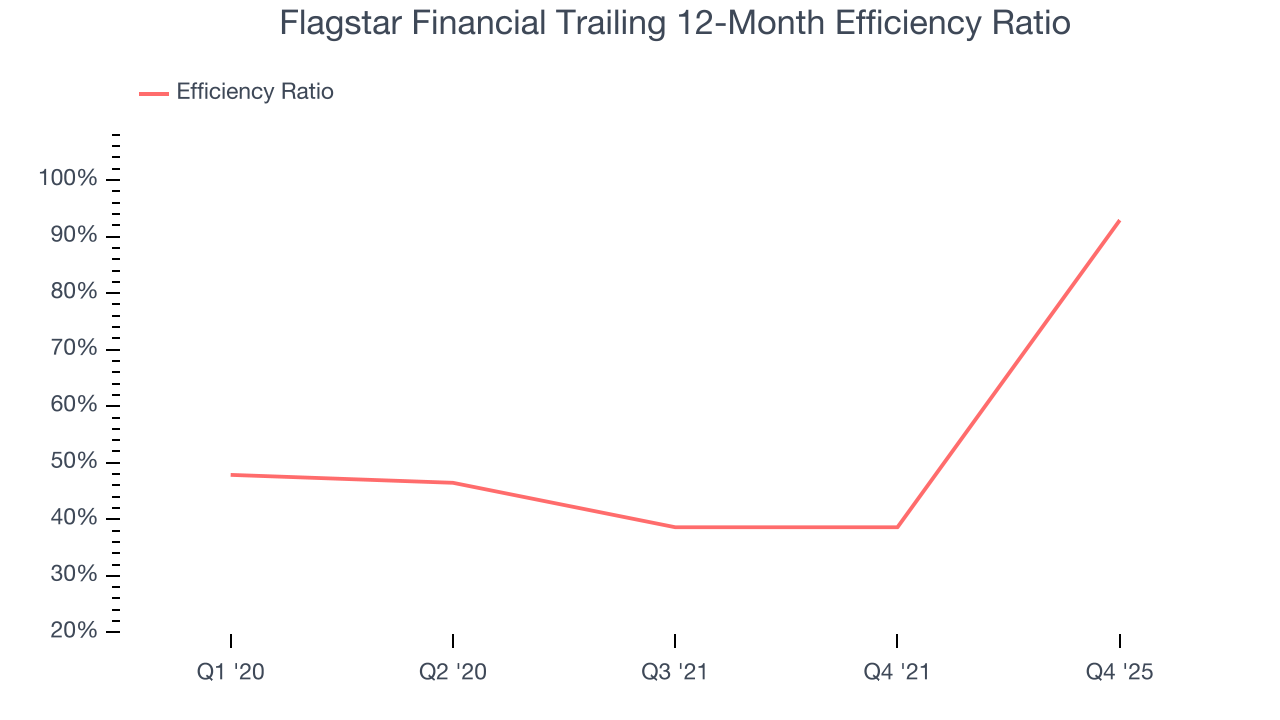
In Q4, Flagstar Financial’s efficiency ratio was 91.3%, falling short of analysts’ expectations by 525.1 basis points (100 basis points = 1 percentage point).
For the next 12 months, Wall Street expects Flagstar Financial to rein in some of its expenses as it anticipates an efficiency ratio of 72.7%.
7. Earnings Per Share
We track the long-term change in earnings per share (EPS) for the same reason as long-term revenue growth. Compared to revenue, however, EPS highlights whether a company’s growth is profitable.
Sadly for Flagstar Financial, its EPS declined by 16.4% annually over the last five years while its revenue grew by 12.6%. However, its efficiency ratio actually improved during this time, telling us that non-fundamental factors such as taxes affected its ultimate earnings.
Like with revenue, we analyze EPS over a shorter period to see if we are missing a change in the business.
For Flagstar Financial, its two-year annual EPS declines of 47% show it’s continued to underperform. These results were bad no matter how you slice the data.
In Q4, Flagstar Financial reported adjusted EPS of $0.06, up from negative $0.34 in the same quarter last year. This print easily cleared analysts’ estimates, and shareholders should be content with the results. Over the next 12 months, Wall Street is optimistic. Analysts forecast Flagstar Financial’s full-year EPS of negative $0.38 will flip to positive $0.62.
8. Tangible Book Value Per Share (TBVPS)
Banks are balance sheet-driven businesses because they generate earnings primarily through borrowing and lending. They’re also valued based on their balance sheet strength and ability to compound book value (another name for shareholders’ equity) over time.
Because of this, tangible book value per share (TBVPS) emerges as the critical performance benchmark. By excluding intangible assets with uncertain liquidation values, this metric captures real, liquid net worth per share. Traditional metrics like EPS are helpful but face distortion from M&A activity and loan loss accounting rules.
Flagstar Financial’s TBVPS declined at a 9% annual clip over the last five years. A turnaround doesn’t seem to be in sight as its TBVPS also dropped by 27.5% annually over the last two years ($30.08 to $15.82 per share).
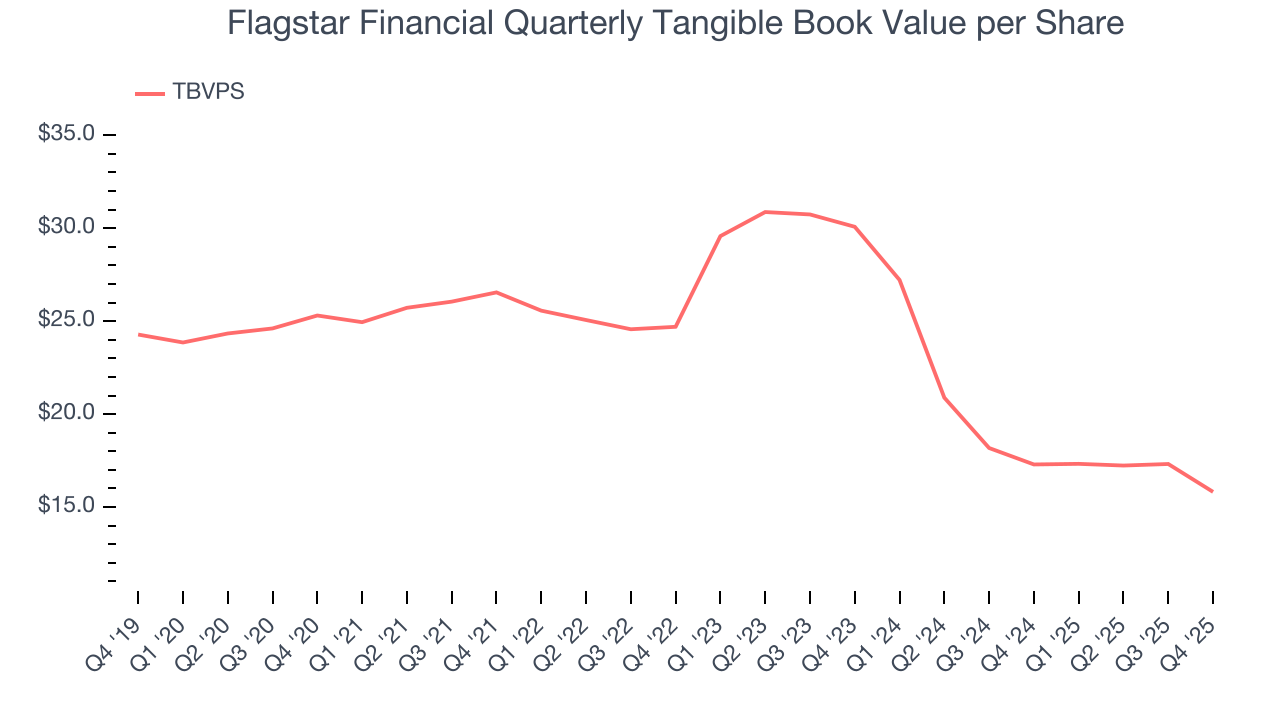
Over the next 12 months, Consensus estimates call for Flagstar Financial’s TBVPS to grow by 6.9% to $16.92, lousy growth rate.
9. Balance Sheet Assessment
Leverage is core to a financial firm’s business model (loans funded by deposits). To ensure economic stability and avoid a repeat of the 2008 GFC, regulators require certain levels of capital and liquidity, focusing on the Tier 1 capital ratio.
Tier 1 capital is the highest-quality capital that a firm holds, consisting primarily of common stock and retained earnings, but also physical gold. It serves as the primary cushion against losses and is the first line of defense in times of financial distress.
This capital is divided by risk-weighted assets to derive the Tier 1 capital ratio. Risk-weighted means that cash and US treasury securities are assigned little risk while unsecured consumer loans and equity investments get much higher risk weights, for example.
New regulation after the 2008 financial crisis requires that all firms must maintain a Tier 1 capital ratio greater than 4.5%. On top of this, there are additional buffers based on scale, risk profile, and other regulatory classifications, so that at the end of the day, firms generally must maintain a 7-10% ratio at minimum.
Over the last two years, Flagstar Financial has averaged a Tier 1 capital ratio of 11.4%, which is considered safe and well capitalized in the event that macro or market conditions suddenly deteriorate.
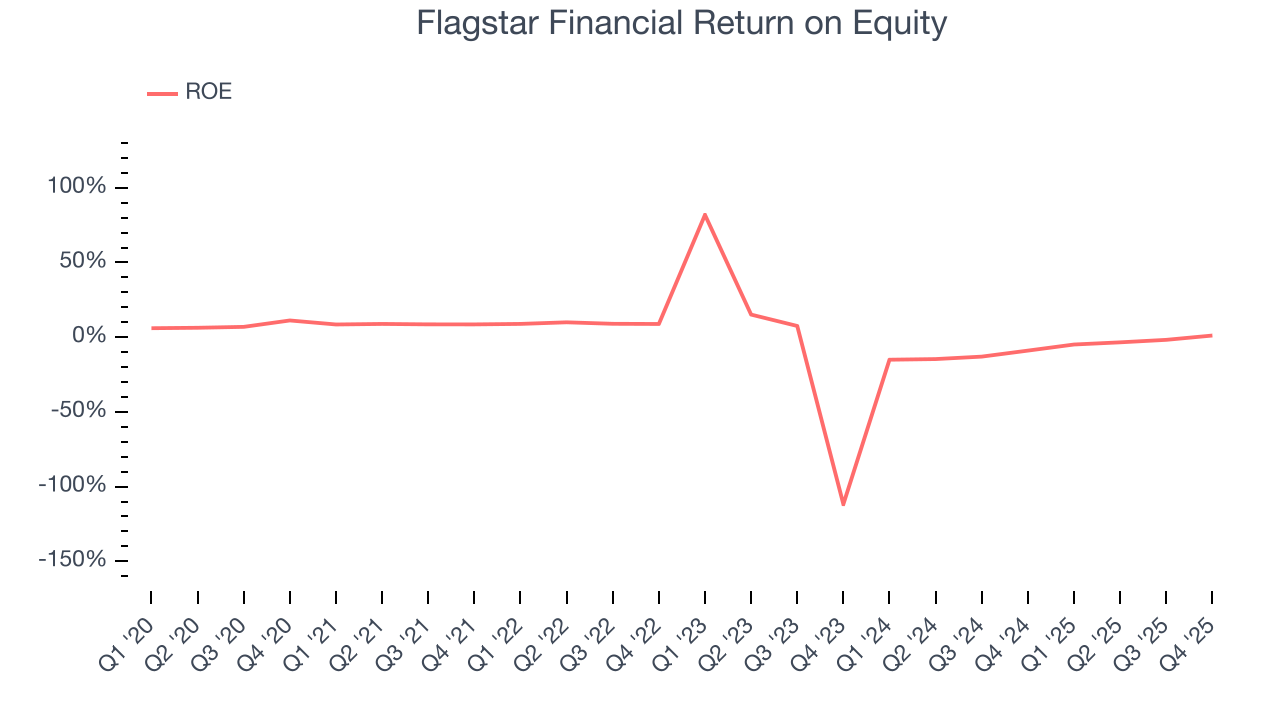
10. Return on Equity
Return on equity (ROE) measures how effectively banks generate profit from each dollar of shareholder equity - a critical funding source. High-ROE institutions typically compound shareholder wealth faster over time through retained earnings, share repurchases, and dividend payments.
Over the last five years, Flagstar Financial has averaged an ROE of 0.2%, uninspiring for a company operating in a sector where the average shakes out around 7.5%.
11. Key Takeaways from Flagstar Financial’s Q4 Results
It was good to see Flagstar Financial beat analysts’ EPS expectations this quarter. We were also glad its revenue outperformed Wall Street’s estimates. On the other hand, its tangible book value per share missed. Zooming out, we think this quarter featured some important positives. The stock traded up 2.8% to $13.93 immediately after reporting.
12. Is Now The Time To Buy Flagstar Financial?
Updated: January 30, 2026 at 1:25 PM EST
The latest quarterly earnings matters, sure, but we actually think longer-term fundamentals and valuation matter more. Investors should consider all these pieces before deciding whether or not to invest in Flagstar Financial.
We see the value of companies driving economic growth, but in the case of Flagstar Financial, we’re out. Although its revenue growth was solid over the last five years and is expected to accelerate over the next 12 months, its relatively low ROE suggests management has struggled to find compelling investment opportunities. And while the company’s estimated net interest income growth for the next 12 months is great, the downside is its TBVPS has declined over the last five years.
Flagstar Financial’s P/B ratio based on the next 12 months is 0.8x. While this valuation is optically cheap, the potential downside is huge given its shaky fundamentals. There are better investments elsewhere.
Wall Street analysts have a consensus one-year price target of $14.13 on the company (compared to the current share price of $13.35).