
Fidelity National Financial (FNF)
We’re skeptical of Fidelity National Financial. Its revenue growth has been weak and its profitability has caved, showing it’s struggling to adapt.― StockStory Analyst Team
1. News


2. Summary
Why We Think Fidelity National Financial Will Underperform
Issuing more title insurance policies than any other company in the United States, Fidelity National Financial (NYSE:FNF) provides title insurance and escrow services for real estate transactions while also offering annuities and life insurance through its F&G subsidiary.
- 1.6% annual declines in net premiums earned for the past five years indicates policy sales struggled this cycle
- Performance over the past five years shows its incremental sales were much less profitable, as its earnings per share fell by 1.3% annually
- A silver lining is that its projected revenue growth of 10.5% for the next 12 months suggests its momentum from the last two years will persist


Fidelity National Financial’s quality doesn’t meet our expectations. We see more lucrative opportunities elsewhere.
Why There Are Better Opportunities Than Fidelity National Financial


Fidelity National Financial’s stock price of $45.89 implies a valuation ratio of 1.3x forward P/B. This multiple is cheaper than most insurance peers, but we think this is justified.
Cheap stocks can look like a great deal at first glance, but they can be value traps. They often have less earnings power, meaning there is more reliance on a re-rating to generate good returns - an unlikely scenario for low-quality companies.
3. Fidelity National Financial (FNF) Research Report: Q4 CY2025 Update
Title insurance company Fidelity National Financial (NYSE:FNF) announced better-than-expected revenue in Q4 CY2025, with sales up 11.9% year on year to $4.05 billion. Its non-GAAP profit of $1.41 per share was 5.8% below analysts’ consensus estimates.
Fidelity National Financial (FNF) Q4 CY2025 Highlights:
- Revenue: $4.05 billion vs analyst estimates of $3.58 billion (11.9% year-on-year growth, 13% beat)
- Pre-tax Profit: $451 million (11.1% margin)
- Adjusted EPS: $1.41 vs analyst expectations of $1.50 (5.8% miss)
- Market Capitalization: $15.21 billion
Company Overview
Issuing more title insurance policies than any other company in the United States, Fidelity National Financial (NYSE:FNF) provides title insurance and escrow services for real estate transactions while also offering annuities and life insurance through its F&G subsidiary.
FNF operates through multiple title insurance brands that collectively issue more policies than any other title company in the United States. When someone purchases real estate, FNF's title insurance protects buyers and mortgage lenders against potential ownership disputes, liens, or other title defects that could threaten their property rights. For example, when a family purchases a home, FNF's title agents conduct thorough searches of property records to identify any issues, such as unpaid taxes or conflicting ownership claims, that could later result in financial losses.
Beyond title insurance, the company provides escrow services that facilitate the secure transfer of funds and documents during real estate closings. Through its ServiceLink subsidiary, FNF offers mortgage transaction services that support the production and management of mortgage loans, including those experiencing default.
In recent years, FNF has diversified its business through its majority-owned subsidiary, F&G Annuities & Life, which markets annuity and life insurance products through a network of independent agents, banks, and broker-dealers. F&G's product portfolio includes fixed indexed annuities, multi-year guarantee annuities, immediate annuities, and indexed universal life insurance policies that provide tax-deferred growth and income solutions for retirement planning.
FNF's business model is closely tied to real estate market activity, with revenue fluctuating based on home sales, mortgage originations, and refinancing volumes. The company maintains a significant presence in both residential and commercial real estate markets, with specialized commercial operations in major metropolitan areas across the United States.
4. Property & Casualty Insurance
Property & Casualty (P&C) insurers protect individuals and businesses against financial loss from damage to property or from legal liability. This is a cyclical industry, and the sector benefits when there is 'hard market', characterized by strong premium rate increases that outpace loss and cost inflation, resulting in robust underwriting margins. The opposite is true in a 'soft market'. Interest rates also matter, as they determine the yields earned on fixed-income portfolios. On the other hand, P&C insurers face a major secular headwind from the increasing frequency and severity of catastrophe losses due to climate change. Furthermore, the liability side of the business is pressured by 'social inflation'—the trend of rising litigation costs and larger jury awards.
FNF's primary competitors in the title insurance industry include First American Financial Corporation, Old Republic International Corporation, Stewart Information Services Corporation, Westcor Land Title Insurance Company, Title Resources Guaranty Company, and WFG National Title Insurance Company. In the annuity and life insurance segment, F&G competes with various insurance carriers offering similar retirement and protection products.
5. Revenue Growth
Insurance companies generate revenue three ways. The first is the core insurance business itself, represented in the income statement as premiums earned. The second source is investment income from investing the “float” (premiums collected but not yet paid out as claims) in assets such as fixed-income assets and equities. The third is fees from policy administration, annuities, and other value-added services. Unfortunately, Fidelity National Financial’s 6% annualized revenue growth over the last five years was mediocre. This wasn’t a great result compared to the rest of the insurance sector, but there are still things to like about Fidelity National Financial.
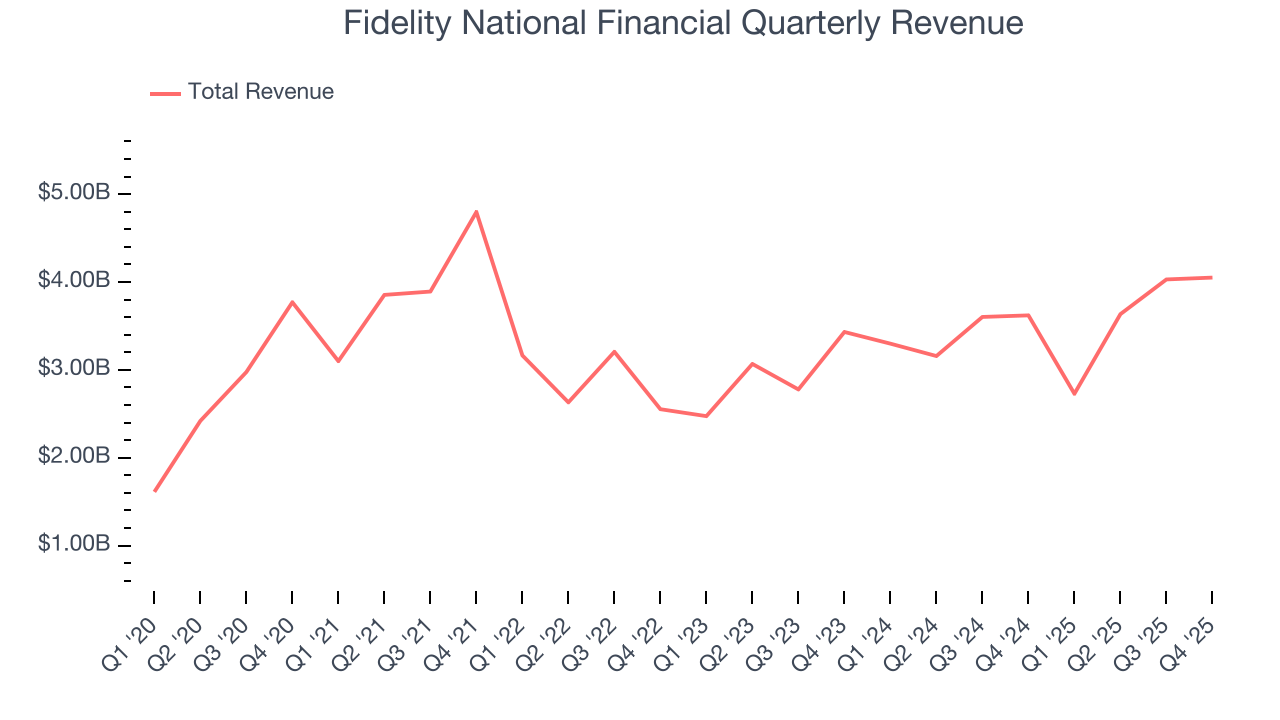
Long-term growth is the most important, but within financials, a half-decade historical view may miss recent interest rate changes and market returns. Fidelity National Financial’s annualized revenue growth of 10.9% over the last two years is above its five-year trend, suggesting its demand recently accelerated. 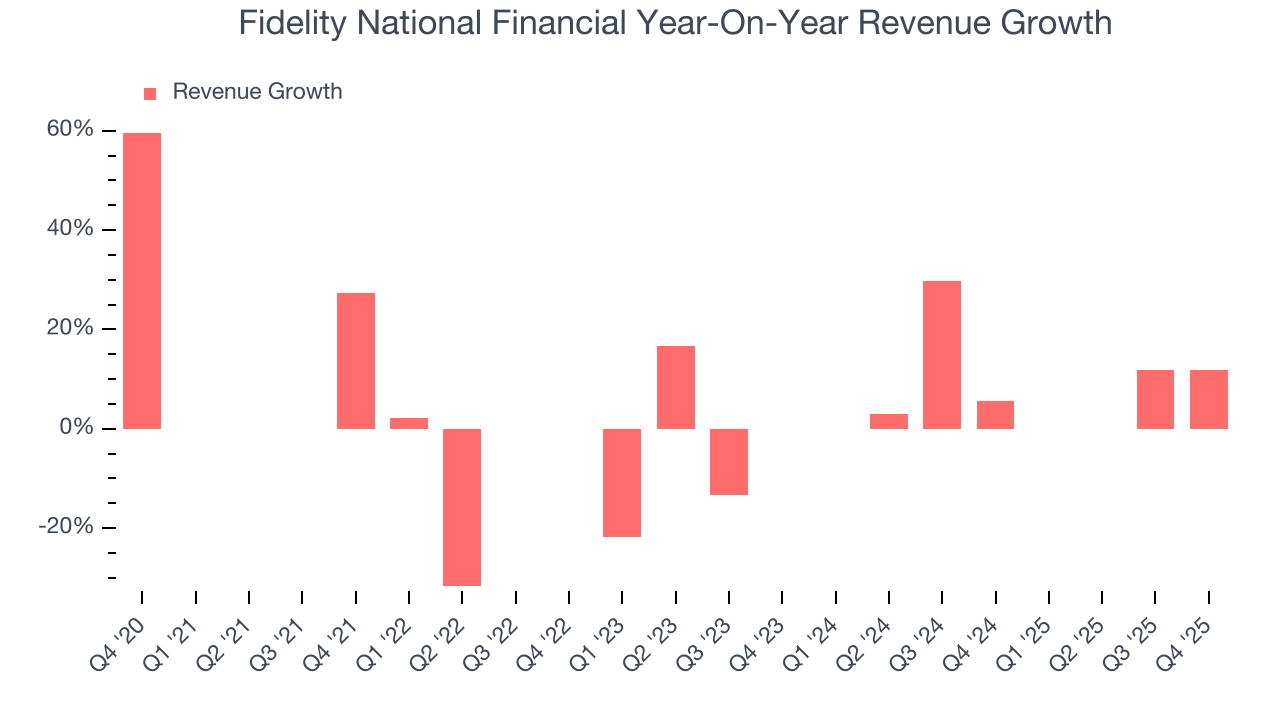 Note: Quarters not shown were determined to be outliers, impacted by outsized investment gains/losses that are not indicative of the recurring fundamentals of the business.
This quarter, Fidelity National Financial reported year-on-year revenue growth of 11.9%, and its $4.05 billion of revenue exceeded Wall Street’s estimates by 13%.
Net premiums earned made up 46.6% of the company’s total revenue during the last five years, meaning Fidelity National Financial’s growth drivers strike a balance between insurance and non-insurance activities.
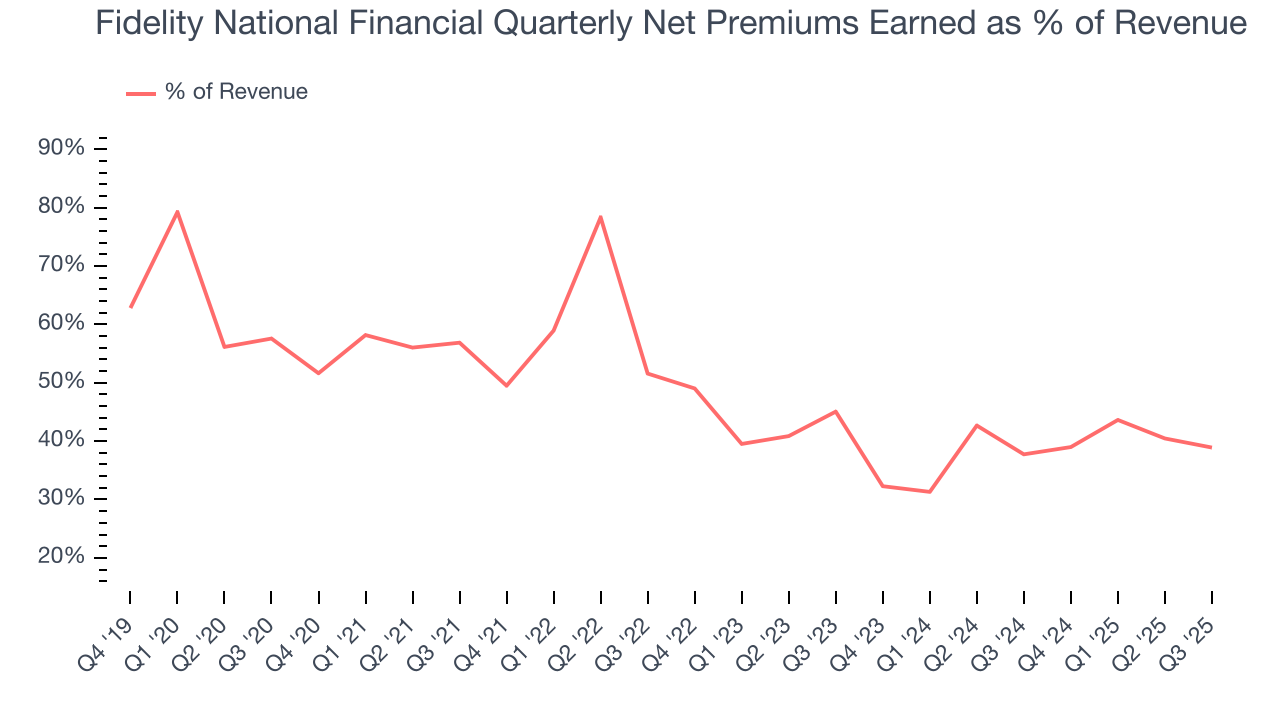
Markets consistently prioritize net premiums earned growth over investment and fee income, recognizing its superior quality as a core indicator of the company’s underwriting success and market penetration.
6. Net Premiums Earned
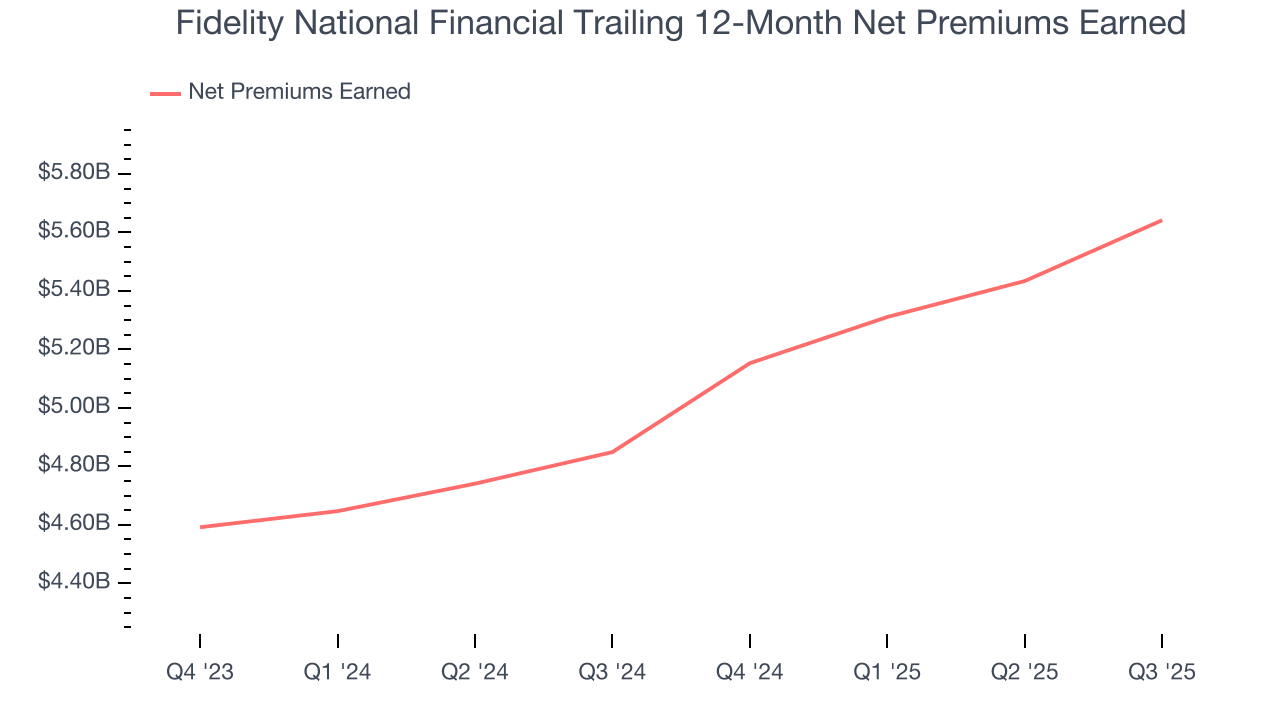
When insurers sell policies, they protect themselves from extremely large losses or an outsized accumulation of losses with reinsurance (insurance for insurance companies). Net premiums earned are therefore gross premiums less what’s ceded to reinsurers as a risk mitigation and transfer strategy.
Fidelity National Financial’s net premiums earned was flat over the last five years, much worse than the broader insurance industry. This shows that policy underwriting underperformed its other business lines.
When analyzing Fidelity National Financial’s net premiums earned over the last two years, we can see that growth accelerated to 10.2% annually. This performance was similar to its total revenue.
7. Pre-Tax Profit Margin
Revenue growth is one major determinant of business quality, and the efficiency of operations is another. For insurance companies, we look at pre-tax profit rather than the operating margin that defines sectors such as consumer, tech, and industrials.
The economics of insurers are driven by their balance sheets, where assets (investing the float + premiums receivable) and liabilities (claims to pay) define the fundamentals. Interest income and expense should therefore be factored into the definition of profit but taxes - which are largely out of a company’s control - should not.
Over the last five years, Fidelity National Financial’s pre-tax profit margin has risen by 6.8 percentage points, going from 20.1% to 9.9%. Luckily, it seems the company has recently taken steps to address its expense base as its pre-tax profit margin expanded by 3.9 percentage points on a two-year basis.
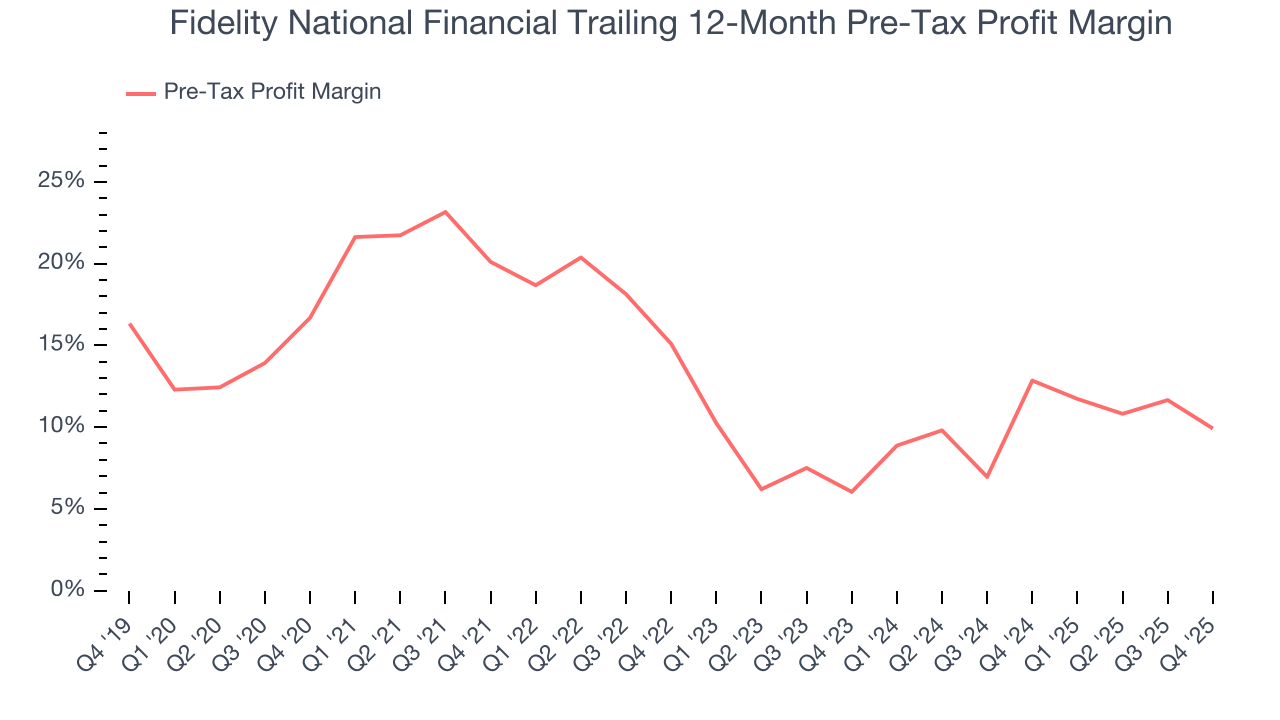
Fidelity National Financial’s pre-tax profit margin came in at 11.1% this quarter. This result was 6.9 percentage points worse than the same quarter last year.
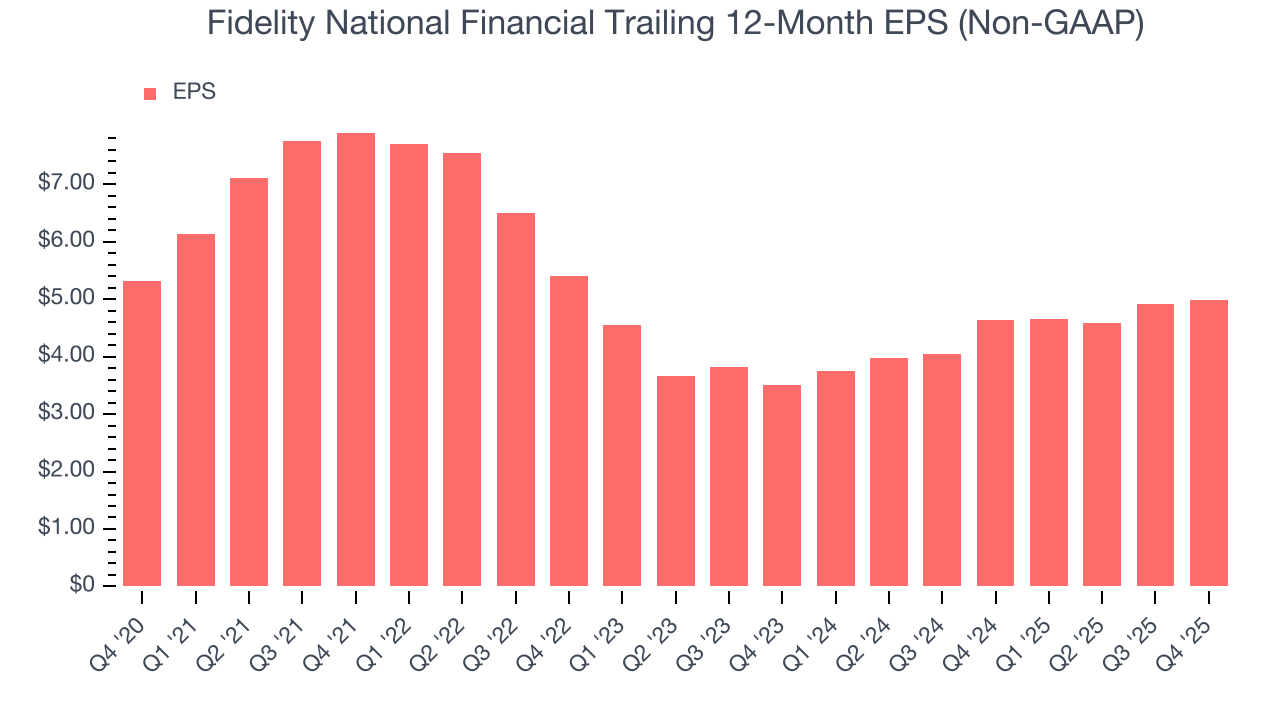
8. Earnings Per Share
Revenue trends explain a company’s historical growth, but the long-term change in earnings per share (EPS) points to the profitability of that growth – for example, a company could inflate its sales through excessive spending on advertising and promotions.
Sadly for Fidelity National Financial, its EPS declined by 1.3% annually over the last five years while its revenue grew by 6%. This tells us the company became less profitable on a per-share basis as it expanded due to factors such as interest expenses and taxes.
Diving into the nuances of Fidelity National Financial’s earnings can give us a better understanding of its performance. As we mentioned earlier, Fidelity National Financial’s pre-tax profit margin declined by 6.8 percentage points over the last five years. This was the most relevant factor (aside from the revenue impact) behind its lower earnings; taxes can also affect EPS but don’t tell us as much about a company’s fundamentals.
Like with revenue, we analyze EPS over a shorter period to see if we are missing a change in the business.
For Fidelity National Financial, its two-year annual EPS growth of 19.1% was higher than its five-year trend. Accelerating earnings growth is almost always a great sign.
In Q4, Fidelity National Financial reported adjusted EPS of $1.41, up from $1.34 in the same quarter last year. Despite growing year on year, this print missed analysts’ estimates. Over the next 12 months, Wall Street expects Fidelity National Financial’s full-year EPS of $4.98 to grow 24.2%.
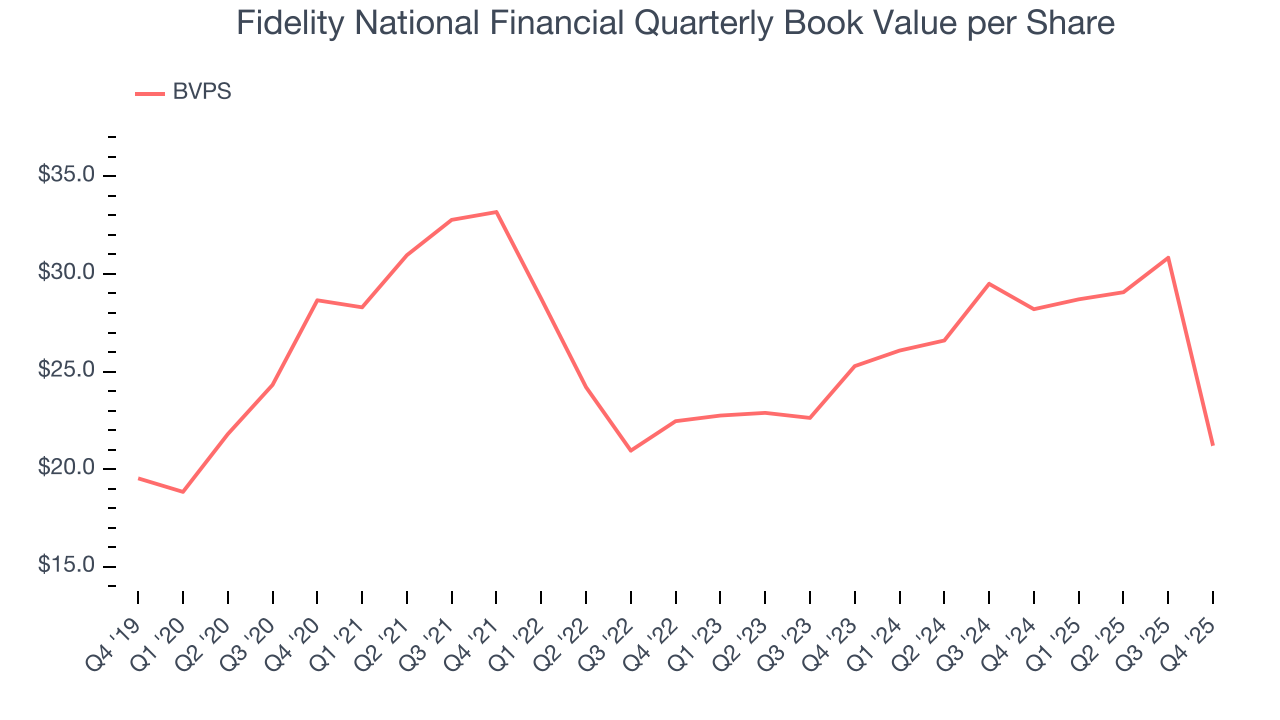
9. Book Value Per Share (BVPS)
Insurance companies are balance sheet businesses, collecting premiums upfront and paying out claims over time. The float – premiums collected but not yet paid out – are invested, creating an asset base supported by a liability structure. Book value captures this dynamic by measuring:
- Assets (investment portfolio, cash, reinsurance recoverables) - liabilities (claim reserves, debt, future policy benefits)
BVPS is essentially the residual value for shareholders.
We therefore consider BVPS very important to track for insurers and a metric that sheds light on business quality because it reflects long-term capital growth and is harder to manipulate than more commonly-used metrics like EPS.
Fidelity National Financial’s BVPS declined at a 5.8% annual clip over the last five years. A turnaround doesn’t seem to be in sight as its BVPS also dropped by 8.4% annually over the last two years ($25.28 to $21.20 per share).
10. Balance Sheet Assessment
The debt-to-equity ratio is a widely used measure to assess a company's balance sheet health. A higher ratio means that a business aggressively financed its growth with debt. This can result in higher earnings (if the borrowed funds are invested profitably) but also increases risk.
If debt levels are too high, there could be difficulties in meeting obligations, especially during economic downturns or periods of rising interest rates if the debt has variable-rate payments.
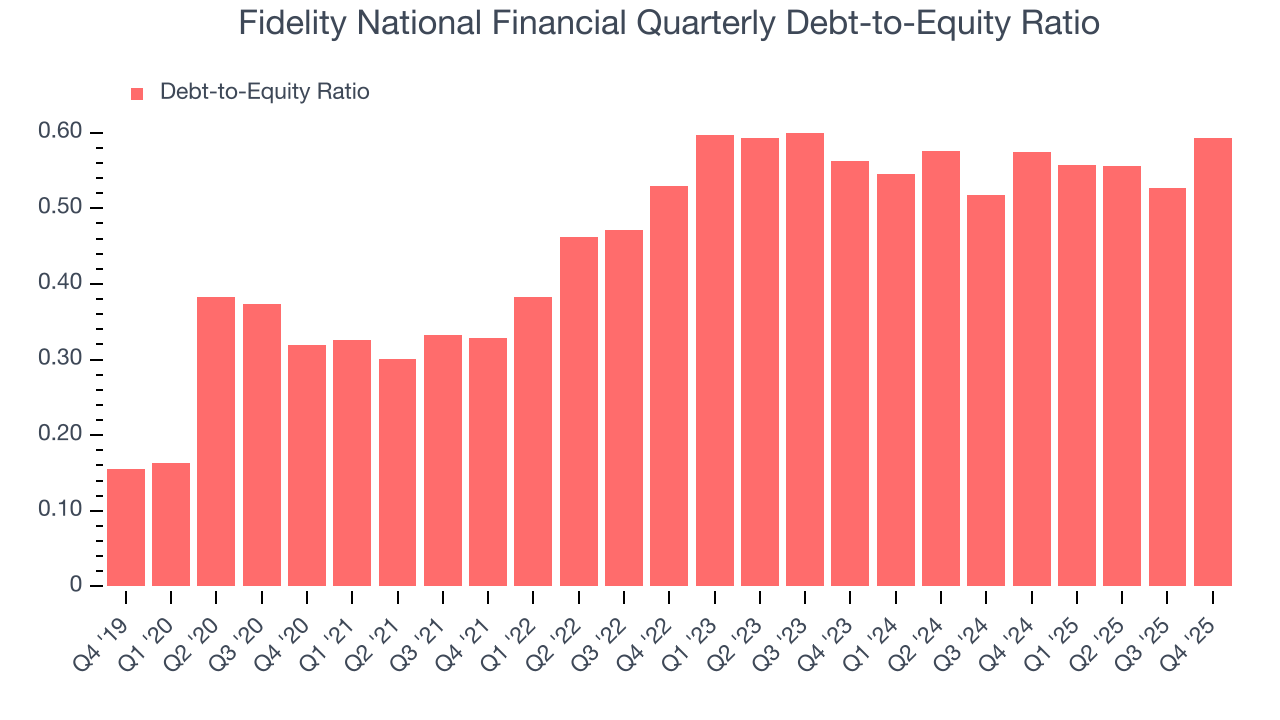
Fidelity National Financial currently has $4.4 billion of debt and $7.42 billion of shareholder's equity on its balance sheet, and over the past four quarters, has averaged a debt-to-equity ratio of 0.6×. We think this is safe and raises no red flags. In general, we’re comfortable with any ratio below 1.0× for an insurance business. Anything below 0.5× is a bonus.
11. Return on Equity
Return on equity, or ROE, represents the ultimate measure of an insurer's effectiveness, quantifying how well it transforms shareholder investments into profits. Over the long term, insurance companies with robust ROE metrics typically deliver superior shareholder returns through a balanced approach to capital management.
Over the last five years, Fidelity National Financial has averaged an ROE of 16.5%, impressive for a company operating in a sector where the average shakes out around 12.5% and those putting up 20%+ are greatly admired. This shows Fidelity National Financial has a strong competitive moat.
12. Key Takeaways from Fidelity National Financial’s Q4 Results
We were impressed by how significantly Fidelity National Financial blew past analysts’ revenue expectations this quarter. On the other hand, its EPS missed. Overall, this was a weaker quarter. The stock remained flat at $54.21 immediately after reporting.
13. Is Now The Time To Buy Fidelity National Financial?
Updated: March 30, 2026 at 12:31 AM EDT
We think that the latest earnings result is only one piece of the bigger puzzle. If you’re deciding whether to own Fidelity National Financial, you should also grasp the company’s longer-term business quality and valuation.
Fidelity National Financial’s business quality ultimately falls short of our standards. To begin with, its revenue growth was mediocre over the last five years. While its projected EPS for the next year implies the company’s fundamentals will improve, the downside is its BVPS growth was weak over the last five years. On top of that, its declining EPS over the last five years makes it a less attractive asset to the public markets.
Fidelity National Financial’s P/B ratio based on the next 12 months is 1.3x. This valuation multiple is fair, but we don’t have much faith in the company. We're fairly confident there are better stocks to buy right now.
Wall Street analysts have a consensus one-year price target of $67.20 on the company (compared to the current share price of $45.89).
Although the price target is bullish, readers should exercise caution because analysts tend to be overly optimistic. The firms they work for, often big banks, have relationships with companies that extend into fundraising, M&A advisory, and other rewarding business lines. As a result, they typically hesitate to say bad things for fear they will lose out. We at StockStory do not suffer from such conflicts of interest, so we’ll always tell it like it is.