
GEO Group (GEO)
GEO Group doesn’t excite us. Its sales have underperformed and its low returns on capital show it has few growth opportunities.― StockStory Analyst Team
1. News


2. Summary
Why We Think GEO Group Will Underperform
With a global footprint spanning three continents and approximately 81,000 beds across 100 facilities, GEO Group (NYSE:GEO) operates secure facilities, processing centers, and reentry services for government agencies in the United States, Australia, and South Africa.
- Sales trends were unexciting over the last five years as its 2.3% annual growth was below the typical business services company
- ROIC of 8.3% reflects management’s challenges in identifying attractive investment opportunities
- The good news is that its earnings per share have outperformed its peers over the last five years, increasing by 14.1% annually


GEO Group’s quality is insufficient. We believe there are better businesses elsewhere.
Why There Are Better Opportunities Than GEO Group


At $14.56 per share, GEO Group trades at 11.8x forward P/E. This multiple is lower than most business services companies, but for good reason.
Cheap stocks can look like great bargains at first glance, but you often get what you pay for. These mediocre businesses often have less earnings power, meaning there is more reliance on a re-rating to generate good returns - an unlikely scenario for low-quality companies.
3. GEO Group (GEO) Research Report: Q4 CY2025 Update
Private corrections company GEO Group (NYSE:GEO) reported revenue ahead of Wall Street’s expectations in Q4 CY2025, with sales up 16.5% year on year to $707.7 million. On the other hand, next quarter’s revenue guidance of $685 million was less impressive, coming in 1.2% below analysts’ estimates. Its GAAP profit of $0.23 per share was in line with analysts’ consensus estimates.
GEO Group (GEO) Q4 CY2025 Highlights:
- Revenue: $707.7 million vs analyst estimates of $669.1 million (16.5% year-on-year growth, 5.8% beat)
- EPS (GAAP): $0.23 vs analyst estimates of $0.23 (in line)
- Adjusted EBITDA: $126 million vs analyst estimates of $120.3 million (17.8% margin, 4.7% beat)
- Revenue Guidance for Q1 CY2026 is $685 million at the midpoint, below analyst estimates of $693.6 million
- EPS (GAAP) guidance for the upcoming financial year 2026 is $1.03 at the midpoint, missing analyst estimates by 17.4%
- EBITDA guidance for the upcoming financial year 2026 is $500 million at the midpoint, below analyst estimates of $536.1 million
- Operating Margin: 11.8%, in line with the same quarter last year
- Market Capitalization: $2.16 billion
Company Overview
With a global footprint spanning three continents and approximately 81,000 beds across 100 facilities, GEO Group (NYSE:GEO) operates secure facilities, processing centers, and reentry services for government agencies in the United States, Australia, and South Africa.
GEO Group's business model revolves around public-private partnerships with government agencies to provide correctional and detention services. The company both owns and leases facilities, ranging from maximum-security prisons to minimum-security and community reentry centers. Beyond physical infrastructure, GEO provides comprehensive services including security, administrative support, rehabilitation programs, education, and food services.
The company operates through four main segments. U.S. Secure Services manages detention and correctional facilities domestically. Electronic Monitoring and Supervision Services provides technology-based supervision using radio frequency, GPS, and alcohol monitoring devices. Reentry Services focuses on community-based programs to help individuals reintegrate into society. International Services handles secure facilities in Australia and South Africa.
A typical government client might contract with GEO Group to manage a detention facility for Immigration and Customs Enforcement (ICE), where the company provides everything from physical security to healthcare services. In another scenario, a state corrections department might lease a GEO-owned facility and have the company provide specialized rehabilitation programs.
GEO generates revenue primarily through government contracts, with payment structures typically based on either a per-diem rate per occupied bed or fixed-fee arrangements. Contract terms vary but often include base periods with option years for renewal. The company also offers facility design and construction services, leveraging its architectural expertise to develop new facilities or renovate existing ones.
The company maintains a business development team that pursues new contracts through government Request for Proposal (RFP) processes, while also working to renew existing agreements with federal, state, and local agencies.
4. Safety & Security Services
Rising concerns over physical security, cybersecurity threats, and workplace safety regulations will present opportunities for companies in this sector. AI and digitization will enhance surveillance, access control, and threat detection, which could benefit key players in Safety & Security Services. These trends could also introduce ethical and regulatory concerns over data privacy and automated decision-making in security operations, giving rise to headline risks. Finally, increasing scrutiny on private security practices and evolving criminal justice policies again mean that companies in the space need to operate with the utmost care or risk being the poster child of abuse of power.
GEO Group's primary competitors include CoreCivic (formerly Corrections Corporation of America), Management and Training Corporation, and several smaller private corrections companies like Emerald Companies and LaSalle Southwest Corrections. In the international market, they compete with G4S (now part of Allied Universal), Sodexo Justice Services, and Serco.
5. Revenue Growth
A company’s long-term sales performance is one signal of its overall quality. Any business can have short-term success, but a top-tier one grows for years.
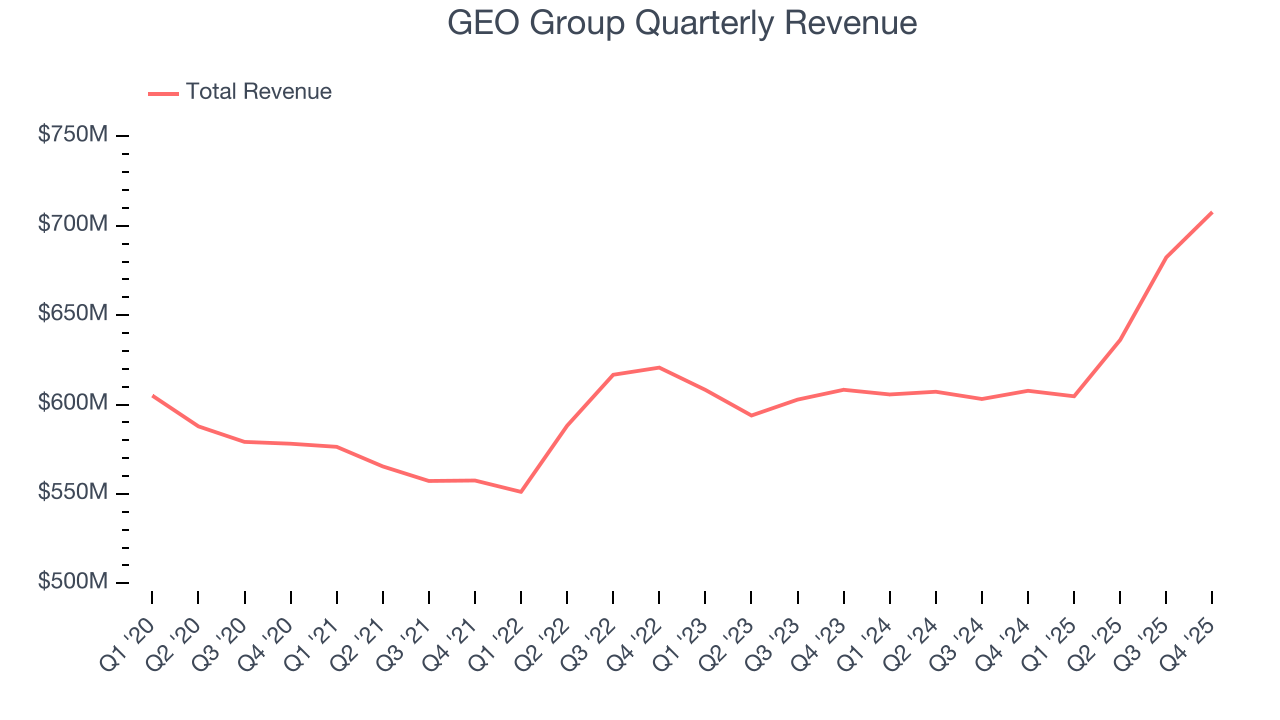
With $2.63 billion in revenue over the past 12 months, GEO Group is a mid-sized business services company, which sometimes brings disadvantages compared to larger competitors benefiting from better economies of scale.
As you can see below, GEO Group’s 2.3% annualized revenue growth over the last five years was sluggish. This shows it failed to generate demand in any major way and is a rough starting point for our analysis.
We at StockStory place the most emphasis on long-term growth, but within business services, a half-decade historical view may miss recent innovations or disruptive industry trends. GEO Group’s annualized revenue growth of 4.4% over the last two years is above its five-year trend, which is encouraging. 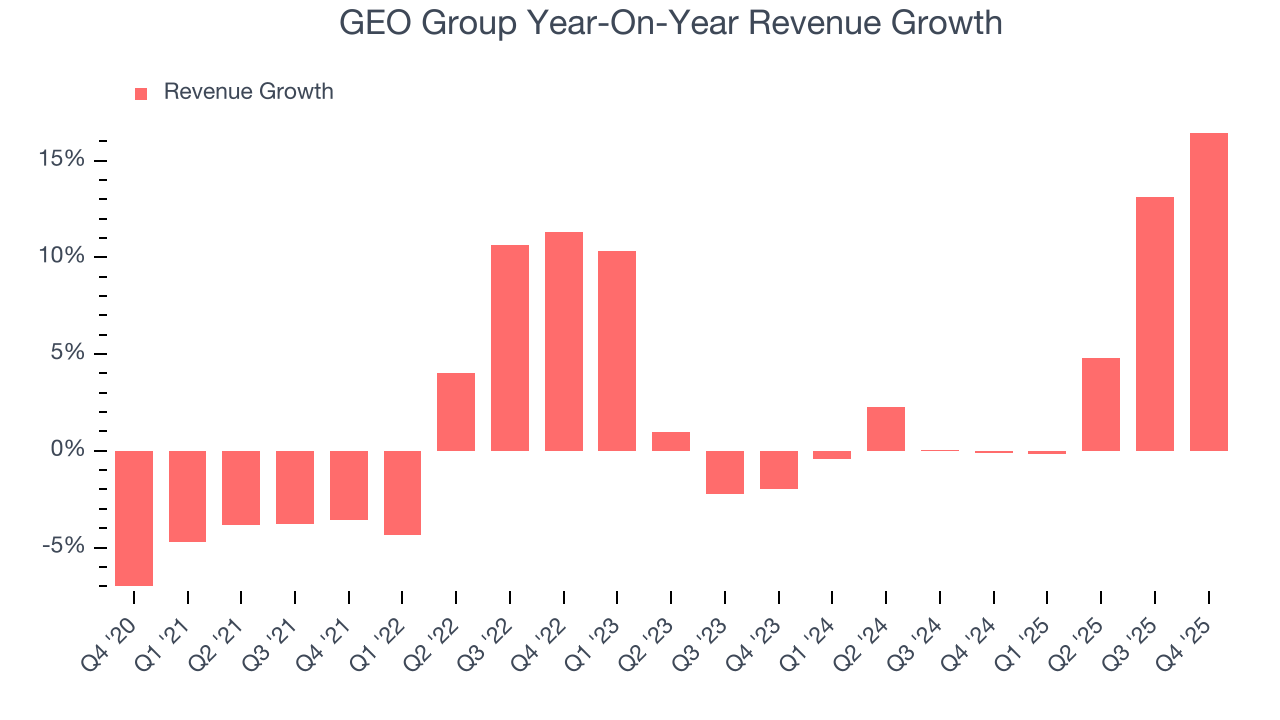
This quarter, GEO Group reported year-on-year revenue growth of 16.5%, and its $707.7 million of revenue exceeded Wall Street’s estimates by 5.8%. Company management is currently guiding for a 13.3% year-on-year increase in sales next quarter.
Looking further ahead, sell-side analysts expect revenue to grow 13.1% over the next 12 months, an improvement versus the last two years. This projection is healthy and implies its newer products and services will catalyze better top-line performance.
6. Operating Margin
GEO Group has managed its cost base well over the last five years. It demonstrated solid profitability for a business services business, producing an average operating margin of 13.2%.
Looking at the trend in its profitability, GEO Group’s operating margin decreased by 3.3 percentage points over the last five years. This raises questions about the company’s expense base because its revenue growth should have given it leverage on its fixed costs, resulting in better economies of scale and profitability.
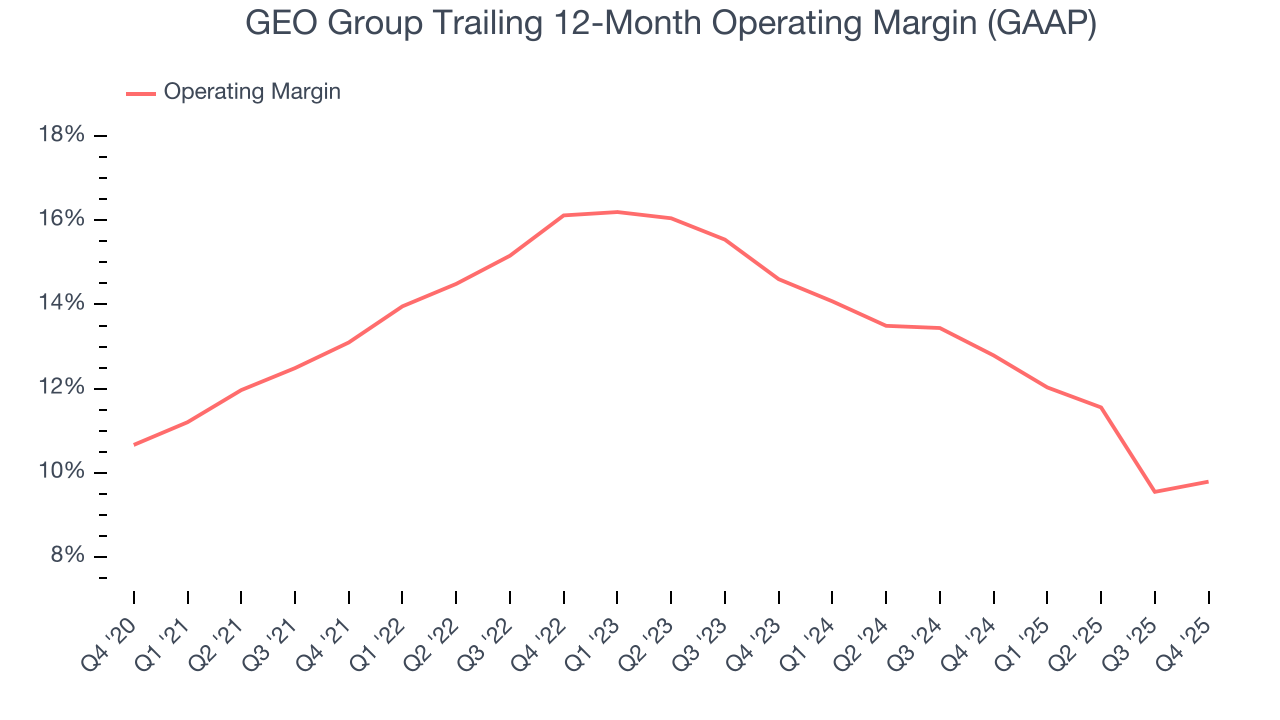
In Q4, GEO Group generated an operating margin profit margin of 11.8%, in line with the same quarter last year. This indicates the company’s overall cost structure has been relatively stable.
7. Earnings Per Share
Revenue trends explain a company’s historical growth, but the long-term change in earnings per share (EPS) points to the profitability of that growth – for example, a company could inflate its sales through excessive spending on advertising and promotions.
GEO Group’s EPS grew at a spectacular 14.1% compounded annual growth rate over the last five years, higher than its 2.3% annualized revenue growth. However, we take this with a grain of salt because its operating margin didn’t improve and it didn’t repurchase its shares, meaning the delta came from reduced interest expenses or taxes.
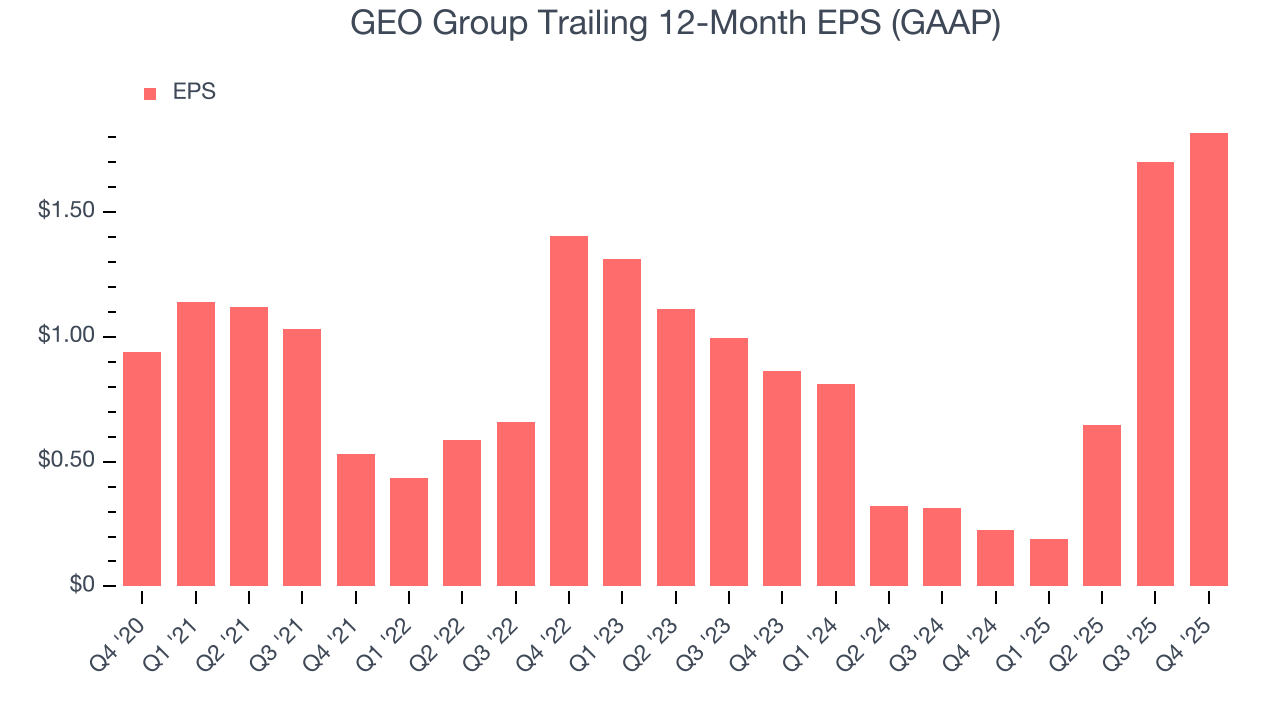
Like with revenue, we analyze EPS over a shorter period to see if we are missing a change in the business.
For GEO Group, its two-year annual EPS growth of 45.1% was higher than its five-year trend. We love it when earnings growth accelerates, especially when it accelerates off an already high base.
In Q4, GEO Group reported EPS of $0.23, up from $0.11 in the same quarter last year. Despite growing year on year, this print slightly missed analysts’ estimates, but we care more about long-term EPS growth than short-term movements. Over the next 12 months, Wall Street expects GEO Group’s full-year EPS of $1.82 to shrink by 32.4%.
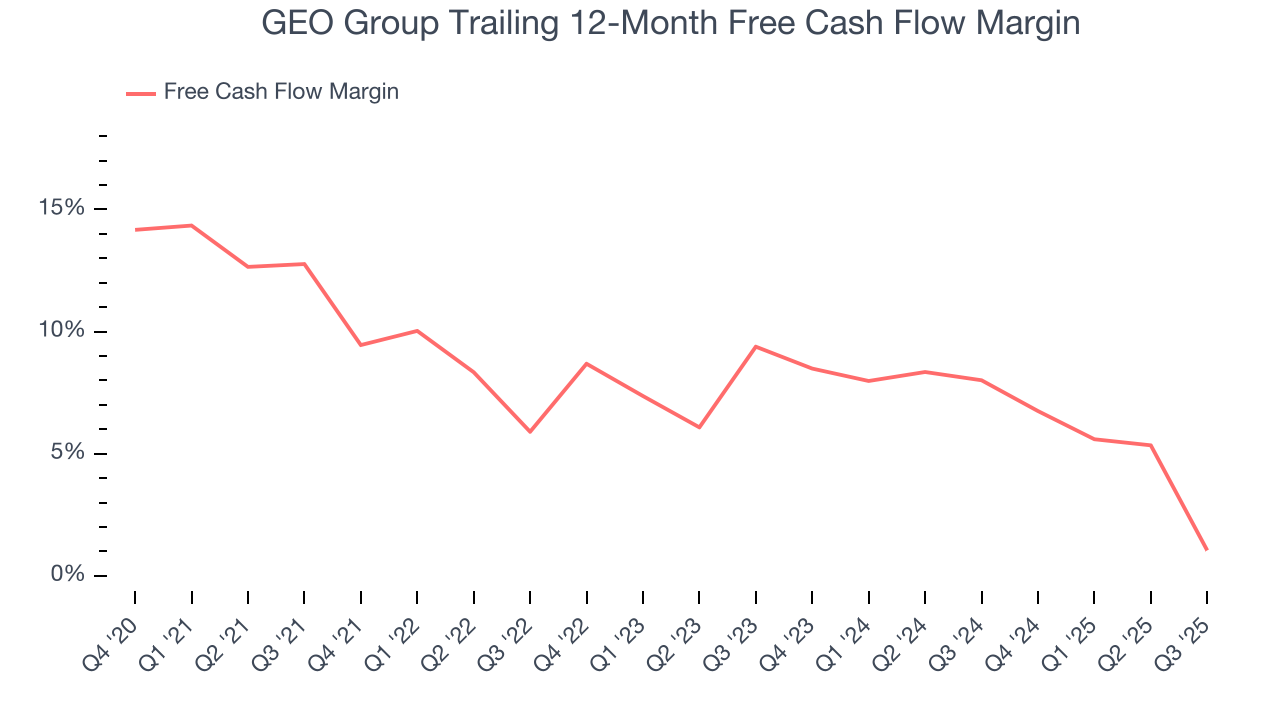
8. Cash Is King
Free cash flow isn't a prominently featured metric in company financials and earnings releases, but we think it's telling because it accounts for all operating and capital expenses, making it tough to manipulate. Cash is king.
GEO Group has shown impressive cash profitability, giving it the option to reinvest or return capital to investors. The company’s free cash flow margin averaged 7.2% over the last five years, better than the broader business services sector.
Taking a step back, we can see that GEO Group’s margin dropped by 12.2 percentage points during that time. If its declines continue, it could signal increasing investment needs and capital intensity.
9. Return on Invested Capital (ROIC)
EPS and free cash flow tell us whether a company was profitable while growing its revenue. But was it capital-efficient? Enter ROIC, a metric showing how much operating profit a company generates relative to the money it has raised (debt and equity).
GEO Group historically did a mediocre job investing in profitable growth initiatives. Its five-year average ROIC was 8.3%, somewhat low compared to the best business services companies that consistently pump out 25%+.
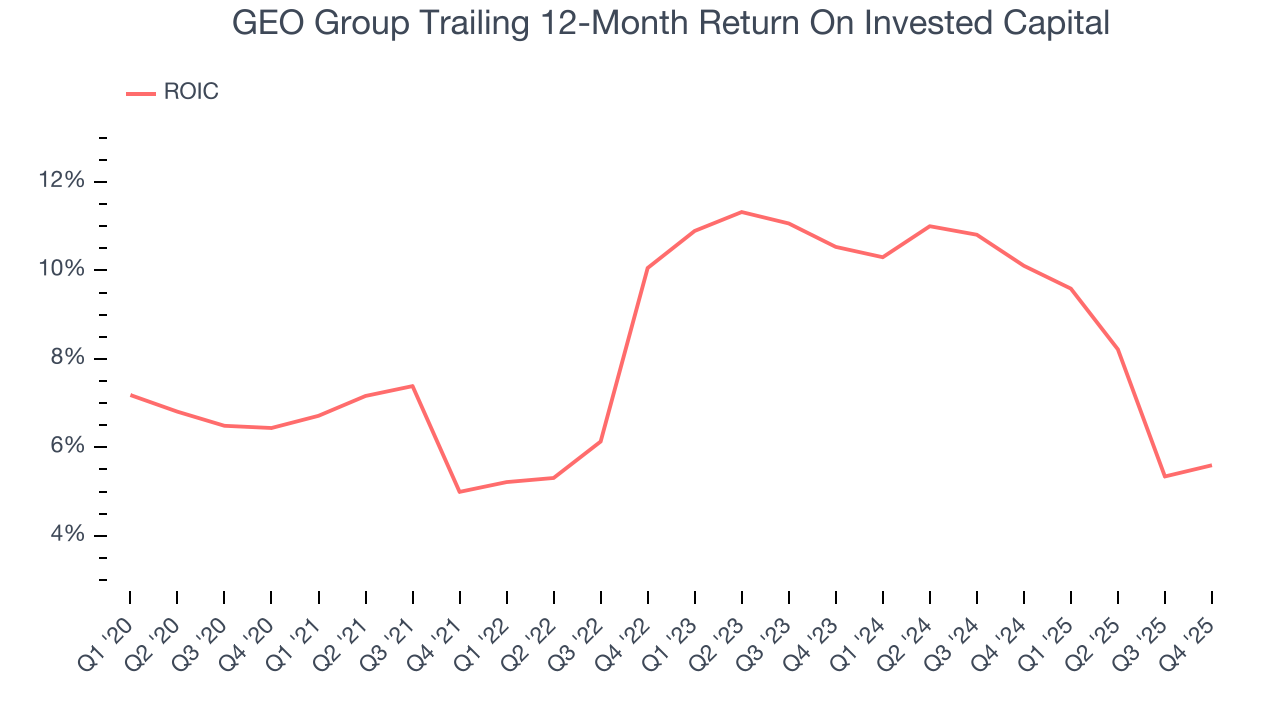
We like to invest in businesses with high returns, but the trend in a company’s ROIC is what often surprises the market and moves the stock price. Unfortunately, GEO Group’s ROIC has stayed the same over the last few years. If the company wants to become an investable business, it must improve its returns by generating more profitable growth.
10. Balance Sheet Assessment
GEO Group reported $71.99 million of cash and $1.73 billion of debt on its balance sheet in the most recent quarter. As investors in high-quality companies, we primarily focus on two things: 1) that a company’s debt level isn’t too high and 2) that its interest payments are not excessively burdening the business.
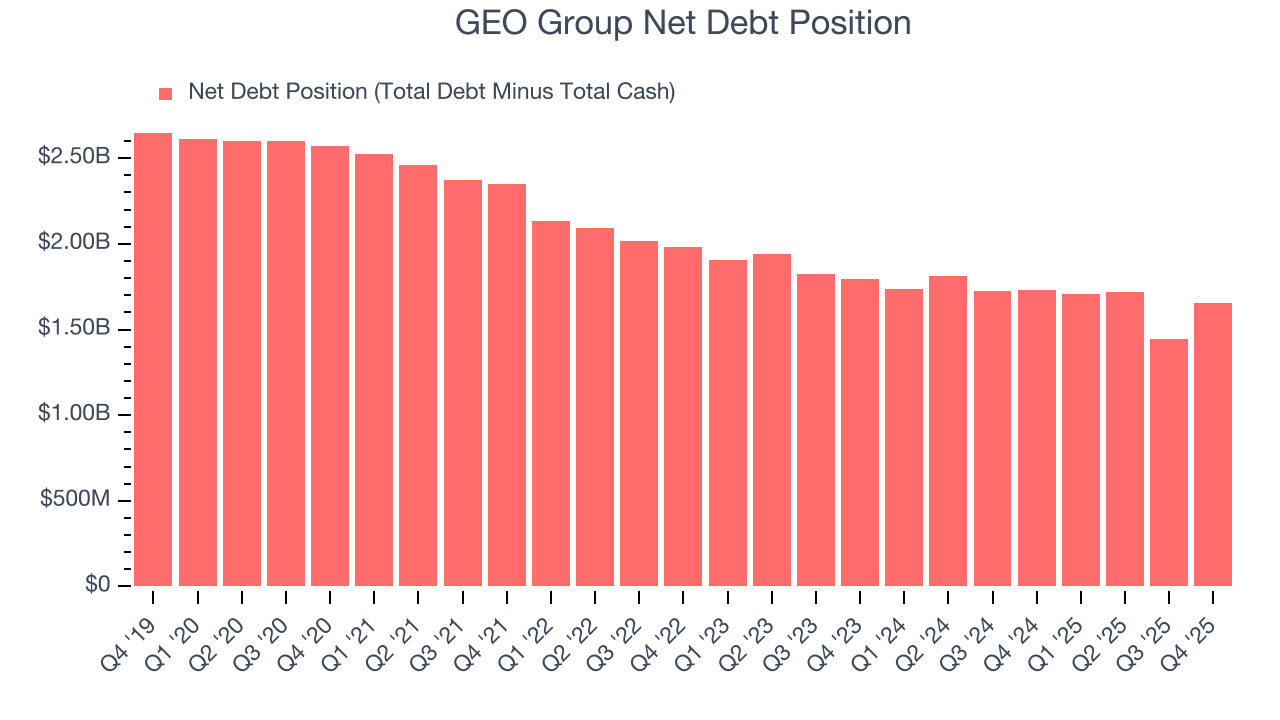
With $464.4 million of EBITDA over the last 12 months, we view GEO Group’s 3.6× net-debt-to-EBITDA ratio as safe. We also see its $79.68 million of annual interest expenses as appropriate. The company’s profits give it plenty of breathing room, allowing it to continue investing in growth initiatives.
11. Key Takeaways from GEO Group’s Q4 Results
We were impressed by how significantly GEO Group blew past analysts’ revenue expectations this quarter. On the other hand, its full-year revenue guidance missed and its full-year EPS guidance fell short of Wall Street’s estimates. Overall, this was a weaker quarter. The stock traded down 2.1% to $15.50 immediately after reporting.
12. Is Now The Time To Buy GEO Group?
Updated: March 14, 2026 at 11:58 PM EDT
We think that the latest earnings result is only one piece of the bigger puzzle. If you’re deciding whether to own GEO Group, you should also grasp the company’s longer-term business quality and valuation.
GEO Group isn’t a terrible business, but it isn’t one of our picks. First off, its revenue growth was weak over the last five years. While its spectacular EPS growth over the last five years shows its profits are trickling down to shareholders, the downside is its projected EPS for the next year is lacking. On top of that, its declining adjusted operating margin shows the business has become less efficient.
GEO Group’s P/E ratio based on the next 12 months is 11.8x. While this valuation is reasonable, we don’t really see a big opportunity at the moment. We're fairly confident there are better investments elsewhere.
Wall Street analysts have a consensus one-year price target of $29.50 on the company (compared to the current share price of $14.56).
Although the price target is bullish, readers should exercise caution because analysts tend to be overly optimistic. The firms they work for, often big banks, have relationships with companies that extend into fundraising, M&A advisory, and other rewarding business lines. As a result, they typically hesitate to say bad things for fear they will lose out. We at StockStory do not suffer from such conflicts of interest, so we’ll always tell it like it is.