
Graham Corporation (GHM)
Graham Corporation is in a league of its own. Its rapid revenue growth gives it operating leverage, making it more profitable as it expands.― StockStory Analyst Team
1. News


2. Summary
Why We Like Graham Corporation
Founded when its founder patented a unique design for a vacuum system used in the sugar refining process, Graham (NYSE:GHM) provides vacuum and heat transfer equipment for the energy, petrochemical, refining, and chemical sectors.
- Market share has increased this cycle as its 20.1% annual revenue growth over the last five years was exceptional
- Incremental sales over the last five years have been highly profitable as its earnings per share increased by 42% annually, topping its revenue gains
- Backlog has averaged 27.8% growth over the past two years, showing it has a pipeline of unfulfilled orders that will support revenue in the future


Graham Corporation is a no-brainer. The price seems fair when considering its quality, and we think now is a favorable time to invest.
Why Is Now The Time To Buy Graham Corporation?


Graham Corporation’s stock price of $84.40 implies a valuation ratio of 42.2x forward P/E. Yes, the stock’s seemingly high valuation multiple could mean short-term volatility. But given its business quality, we think the multiple is justified.
Our analysis and backtests consistently tell us that buying high-quality companies and holding them for many years leads to market outperformance. Over the long term, entry price doesn’t matter nearly as much as business fundamentals.
3. Graham Corporation (GHM) Research Report: Q4 CY2025 Update
Industrial fluid and energy systems manufacturer Graham Corporation (NYSE: GHM) beat Wall Street’s revenue expectations in Q4 CY2025, with sales up 20.5% year on year to $56.7 million. The company expects the full year’s revenue to be around $236 million, close to analysts’ estimates. Its non-GAAP profit of $0.31 per share was 69.1% above analysts’ consensus estimates.
Graham Corporation (GHM) Q4 CY2025 Highlights:
- Revenue: $56.7 million vs analyst estimates of $52.35 million (20.5% year-on-year growth, 8.3% beat)
- Adjusted EPS: $0.31 vs analyst estimates of $0.18 (69.1% beat)
- Adjusted EBITDA: $6.04 million vs analyst estimates of $4.81 million (10.7% margin, 25.7% beat)
- The company lifted its revenue guidance for the full year to $236 million at the midpoint from $230 million, a 2.6% increase
- EBITDA guidance for the full year is $26 million at the midpoint, above analyst estimates of $25.38 million
- Operating Margin: 5.5%, down from 6.5% in the same quarter last year
- Free Cash Flow was $2.43 million, up from -$2.11 million in the same quarter last year
- Backlog: $515.6 million at quarter end, up 33.9% year on year
- Market Capitalization: $810.4 million
Company Overview
Founded when its founder patented a unique design for a vacuum system used in the sugar refining process, Graham (NYSE:GHM) provides vacuum and heat transfer equipment for the energy, petrochemical, refining, and chemical sectors.
The company primarily serves the defense, space, energy, and process industries. Graham's product offerings include custom-engineered vacuum and heat transfer equipment, cryogenic pumps, and turbomachinery technologies.
The company operates through two main segments: its core business in Batavia, which focuses on surface condensers and ejectors for defense, energy, and petrochemical markets, and its subsidiary Barber-Nichols LLC (BN) in Arvada, Colorado, which specializes in turbomachinery products for space, aerospace, cryogenic, defense, and energy markets. Graham also has a presence in China and India through wholly-owned subsidiaries that provide sales and engineering support.
Graham's product portfolio includes equipment for nuclear and non-nuclear propulsion systems, power generation, fluid transfer, and thermal management in defense applications. For the space industry, the company provides equipment for propulsion, power, energy management, and life support systems. In the energy sector, Graham supplies vacuum and heat transfer systems for oil refining, cogeneration, and various alternative power applications, including hydrogen. The company also serves chemical and petrochemical industries with equipment used in fertilizer, ethylene, methanol, and other downstream chemical facilities.
The company's revenue structure is primarily based on the sale of its custom-engineered products. Graham's business model revolves around high-value, engineered-to-order equipment that often requires significant upfront engineering and design work. The company's sales are heavily weighted towards domestic markets, with a growing concentration in the defense industry.
A notable recent acquisition was that of P3 Technologies, LLC in November 2023. This acquisition brought custom turbomachinery engineering and manufacturing capabilities to Graham, serving the space, new energy, defense, and medical industries.
4. Engineered Components and Systems
Engineered components and systems companies possess technical know-how in sometimes narrow areas such as metal forming or intelligent robotics. Lately, automation and connected equipment collecting analyzable data have been trending, creating new demand. On the other hand, like the broader industrials sector, engineered components and systems companies are at the whim of economic cycles. Consumer spending and interest rates, for example, can greatly impact the industrial production that drives demand for these companies’ offerings.
Competitors offering similar products include SPX Flow (NYSE:FLOW), Gardner Denver (NYSE:GDI), and Chart Industries (NYSE:GTLS).
5. Revenue Growth
Reviewing a company’s long-term sales performance reveals insights into its quality. Any business can put up a good quarter or two, but the best consistently grow over the long haul. Thankfully, Graham Corporation’s 20.1% annualized revenue growth over the last five years was incredible. Its growth beat the average industrials company and shows its offerings resonate with customers.
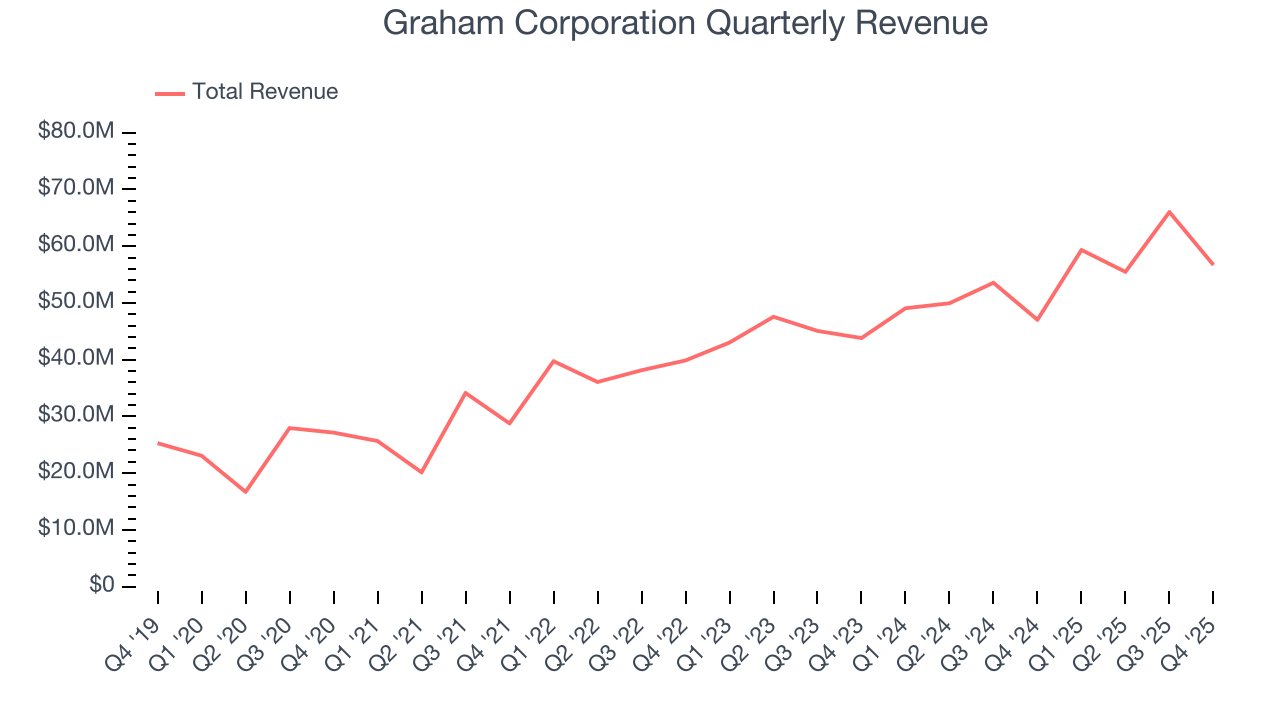
We at StockStory place the most emphasis on long-term growth, but within industrials, a half-decade historical view may miss cycles, industry trends, or a company capitalizing on catalysts such as a new contract win or a successful product line. Graham Corporation’s annualized revenue growth of 15% over the last two years is below its five-year trend, but we still think the results suggest healthy demand. 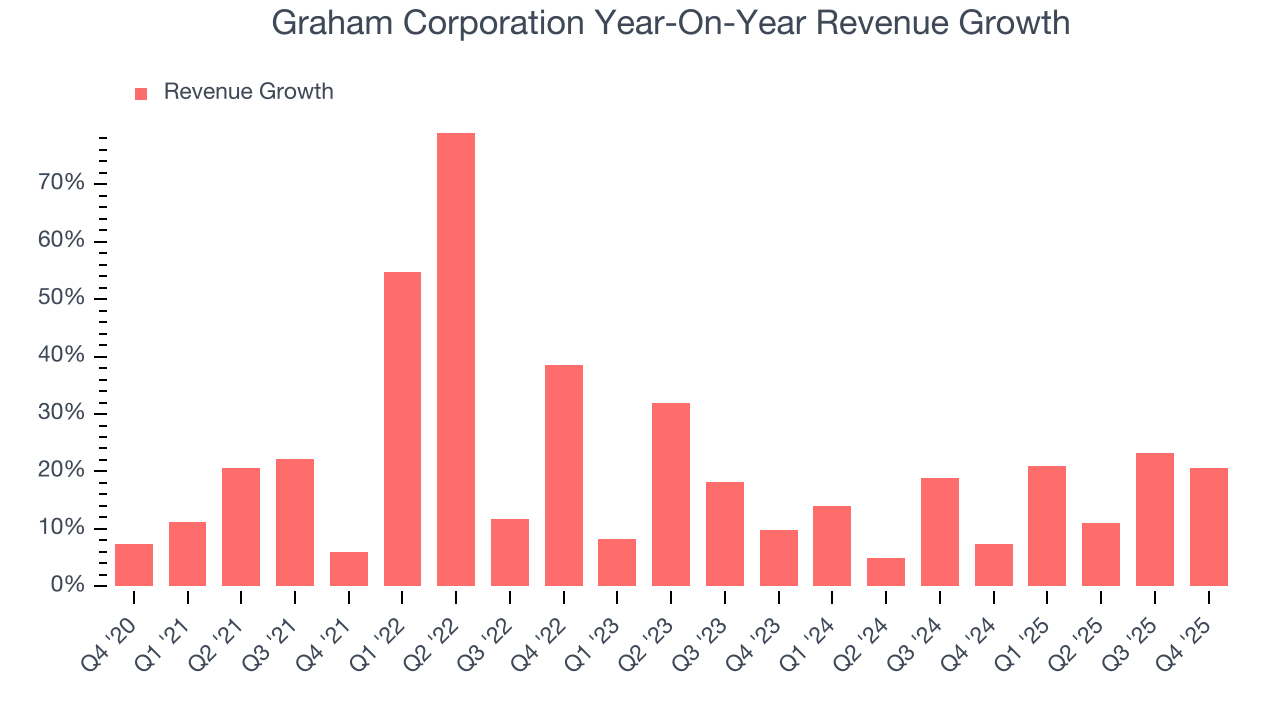
We can better understand the company’s revenue dynamics by analyzing its backlog, or the value of its outstanding orders that have not yet been executed or delivered. Graham Corporation’s backlog reached $515.6 million in the latest quarter and averaged 27.8% year-on-year growth over the last two years. Because this number is better than its revenue growth, we can see the company accumulated more orders than it could fulfill and deferred revenue to the future. This could imply elevated demand for Graham Corporation’s products and services but raises concerns about capacity constraints. 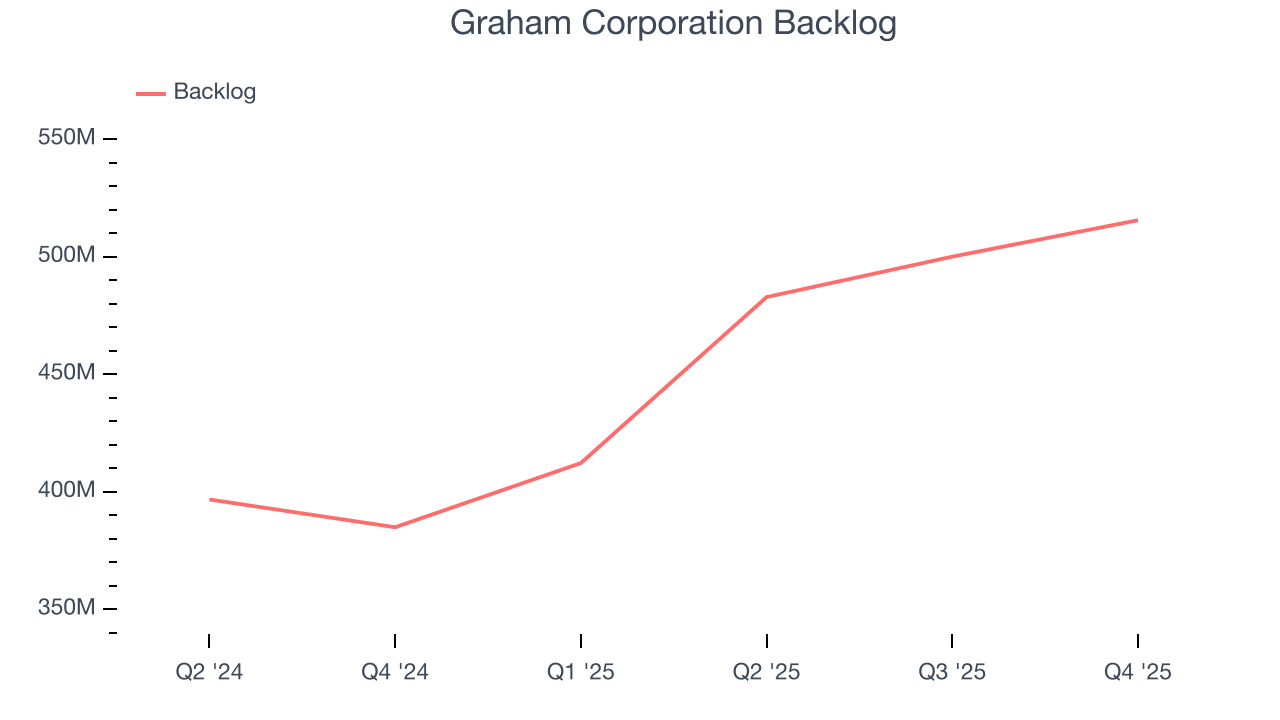
This quarter, Graham Corporation reported robust year-on-year revenue growth of 20.5%, and its $56.7 million of revenue topped Wall Street estimates by 8.3%.
Looking ahead, sell-side analysts expect revenue to grow 6.6% over the next 12 months, a deceleration versus the last two years. This projection doesn't excite us and suggests its products and services will see some demand headwinds.
6. Gross Margin & Pricing Power
Graham Corporation has bad unit economics for an industrials business, signaling it operates in a competitive market. As you can see below, it averaged a 19.9% gross margin over the last five years. That means Graham Corporation paid its suppliers a lot of money ($80.12 for every $100 in revenue) to run its business. 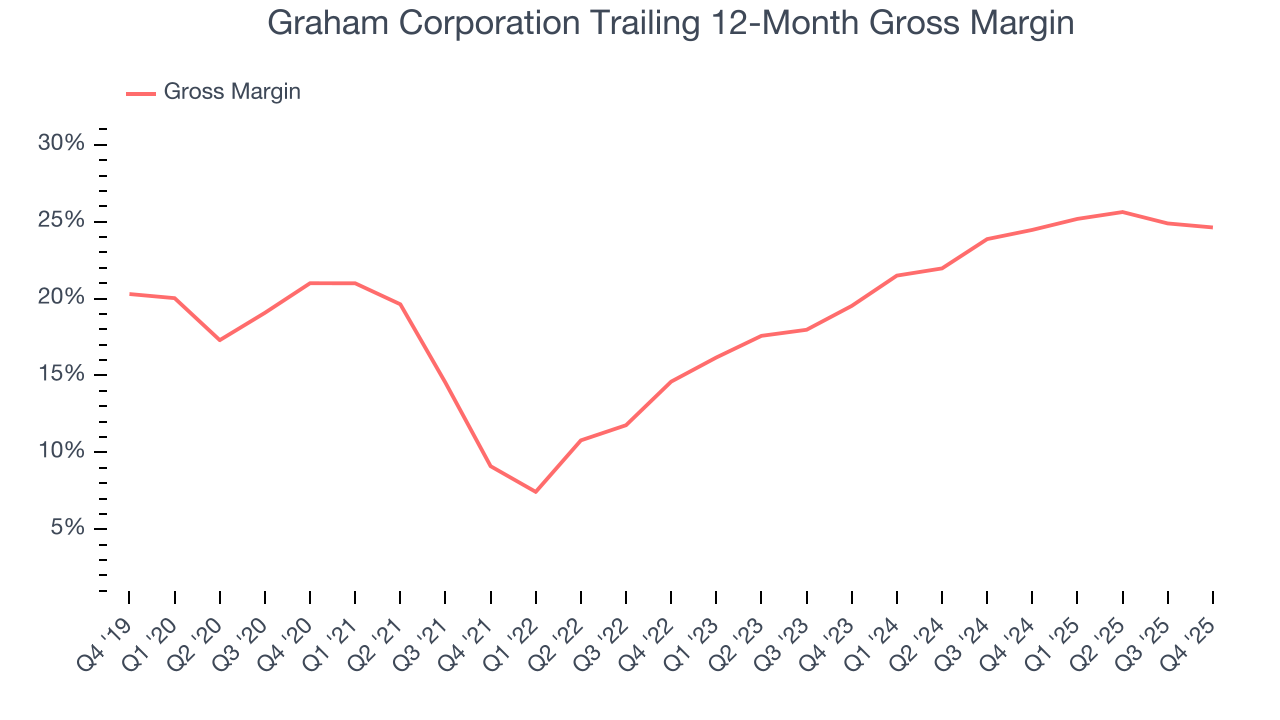
Graham Corporation’s gross profit margin came in at 23.8% this quarter, marking a 1.1 percentage point decrease from 24.8% in the same quarter last year. On a wider time horizon, the company’s full-year margin has remained steady over the past four quarters, suggesting its input costs (such as raw materials and manufacturing expenses) have been stable and it isn’t under pressure to lower prices.
7. Operating Margin
Operating margin is a key measure of profitability. Think of it as net income - the bottom line - excluding the impact of taxes and interest on debt, which are less connected to business fundamentals.
Graham Corporation was profitable over the last five years but held back by its large cost base. Its average operating margin of 2.5% was weak for an industrials business. This result isn’t too surprising given its low gross margin as a starting point.
On the plus side, Graham Corporation’s operating margin rose by 14.2 percentage points over the last five years, as its sales growth gave it immense operating leverage.
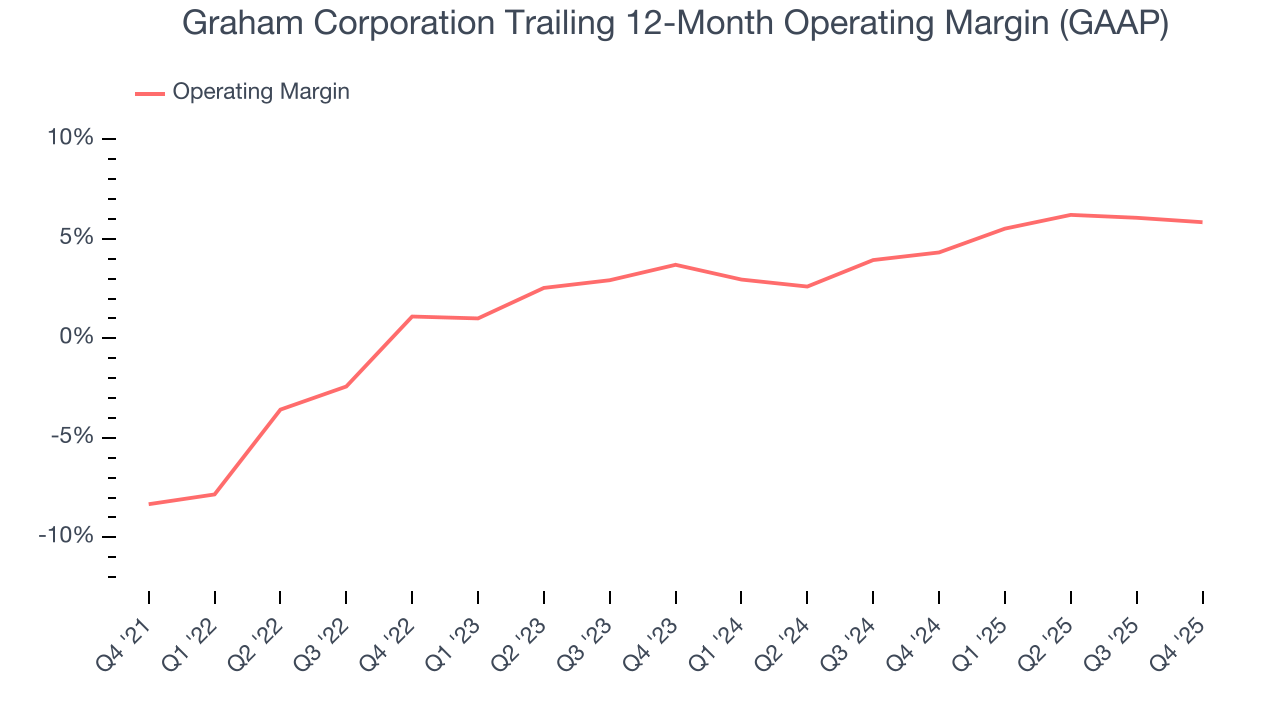
This quarter, Graham Corporation generated an operating margin profit margin of 5.5%, down 1 percentage points year on year. Since Graham Corporation’s gross margin decreased more than its operating margin, we can assume its recent inefficiencies were driven more by weaker leverage on its cost of sales rather than increased marketing, R&D, and administrative overhead expenses.
8. Earnings Per Share
We track the long-term change in earnings per share (EPS) for the same reason as long-term revenue growth. Compared to revenue, however, EPS highlights whether a company’s growth is profitable.
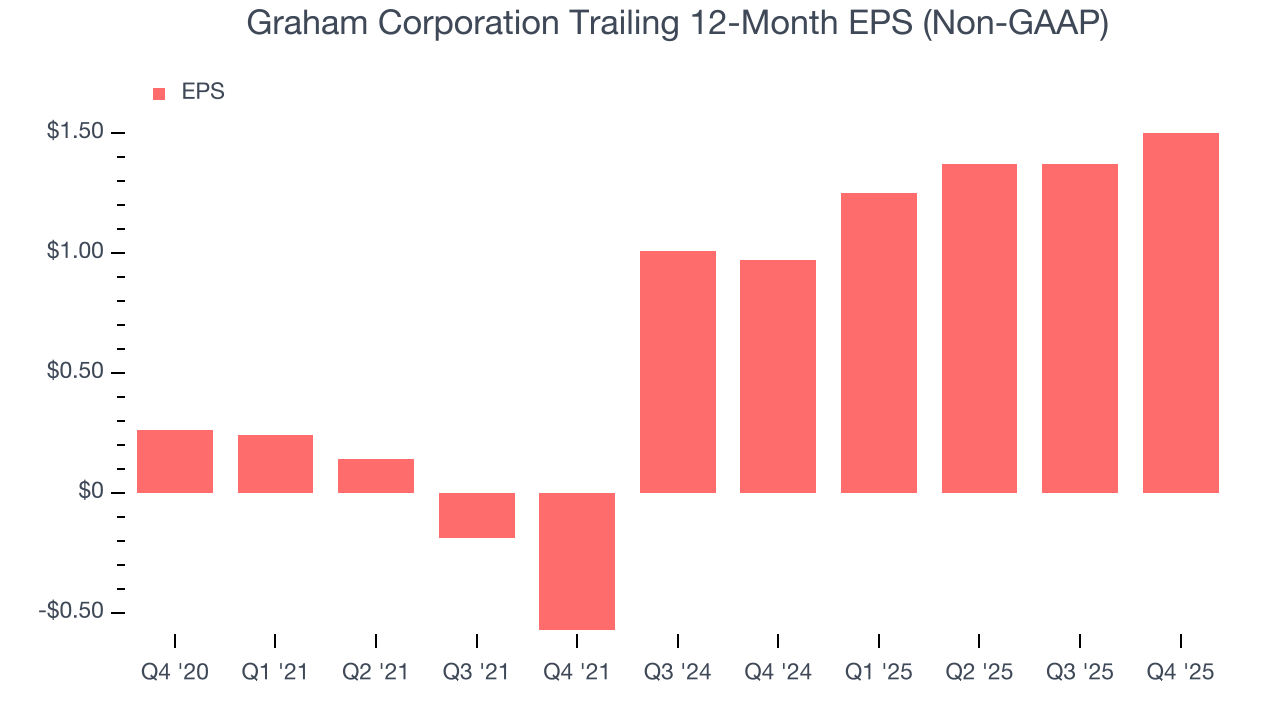
Graham Corporation’s EPS grew at an astounding 42% compounded annual growth rate over the last five years, higher than its 20.1% annualized revenue growth. This tells us the company became more profitable on a per-share basis as it expanded.
We can take a deeper look into Graham Corporation’s earnings quality to better understand the drivers of its performance. As we mentioned earlier, Graham Corporation’s operating margin declined this quarter but expanded by 14.2 percentage points over the last five years. This was the most relevant factor (aside from the revenue impact) behind its higher earnings; interest expenses and taxes can also affect EPS but don’t tell us as much about a company’s fundamentals.
Like with revenue, we analyze EPS over a shorter period to see if we are missing a change in the business.
For Graham Corporation, its one-year annual EPS growth of 83.3% was higher than its five-year trend. We love it when earnings growth accelerates, especially when it accelerates off an already high base.
In Q4, Graham Corporation reported adjusted EPS of $0.31, up from $0.18 in the same quarter last year. This print easily cleared analysts’ estimates, and shareholders should be content with the results. Over the next 12 months, Wall Street expects Graham Corporation’s full-year EPS of $1.50 to grow 17%.
9. Cash Is King
Although earnings are undoubtedly valuable for assessing company performance, we believe cash is king because you can’t use accounting profits to pay the bills.
Graham Corporation has shown weak cash profitability over the last five years, giving the company limited opportunities to return capital to shareholders. Its free cash flow margin averaged 3.3%, subpar for an industrials business.
Taking a step back, an encouraging sign is that Graham Corporation’s margin expanded by 15.4 percentage points during that time. The company’s improvement shows it’s heading in the right direction, and we can see it became a less capital-intensive business because its free cash flow profitability rose more than its operating profitability.
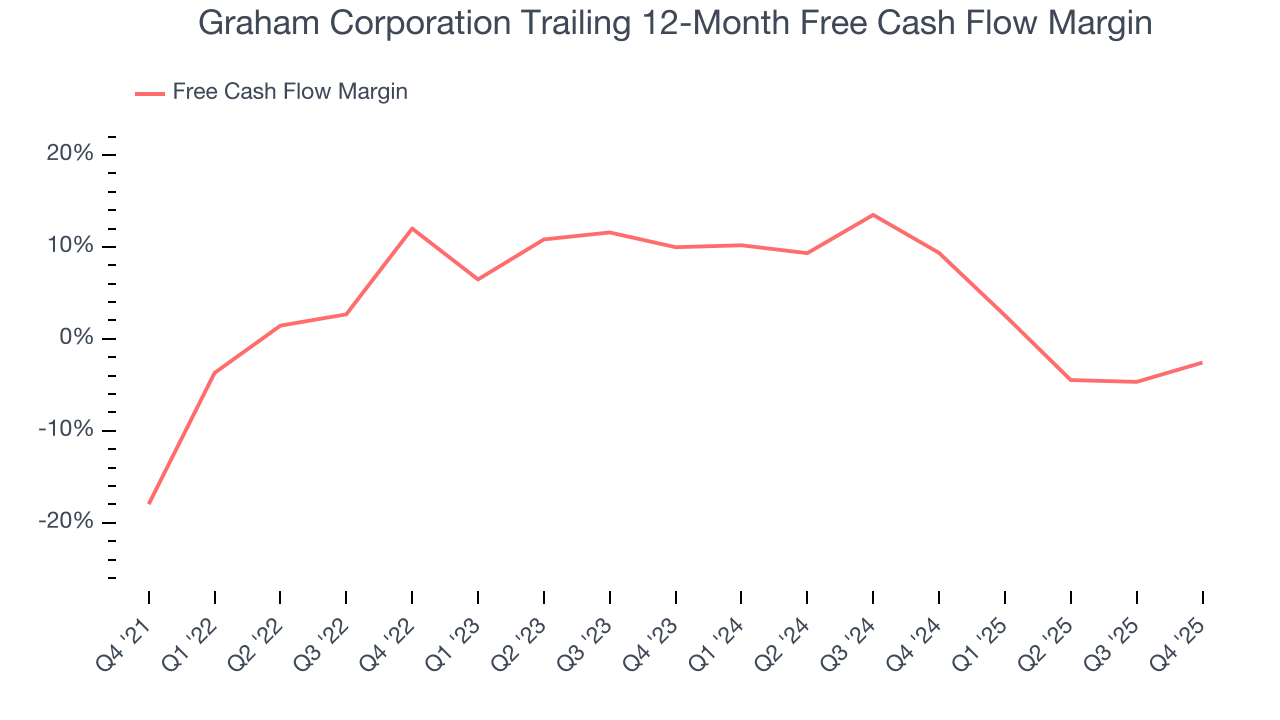
Graham Corporation’s free cash flow clocked in at $2.43 million in Q4, equivalent to a 4.3% margin. Its cash flow turned positive after being negative in the same quarter last year, building on its favorable historical trend.
10. Return on Invested Capital (ROIC)
EPS and free cash flow tell us whether a company was profitable while growing its revenue. But was it capital-efficient? A company’s ROIC explains this by showing how much operating profit it makes compared to the money it has raised (debt and equity).
Graham Corporation historically did a mediocre job investing in profitable growth initiatives. Its five-year average ROIC was 3.5%, lower than the typical cost of capital (how much it costs to raise money) for industrials companies.
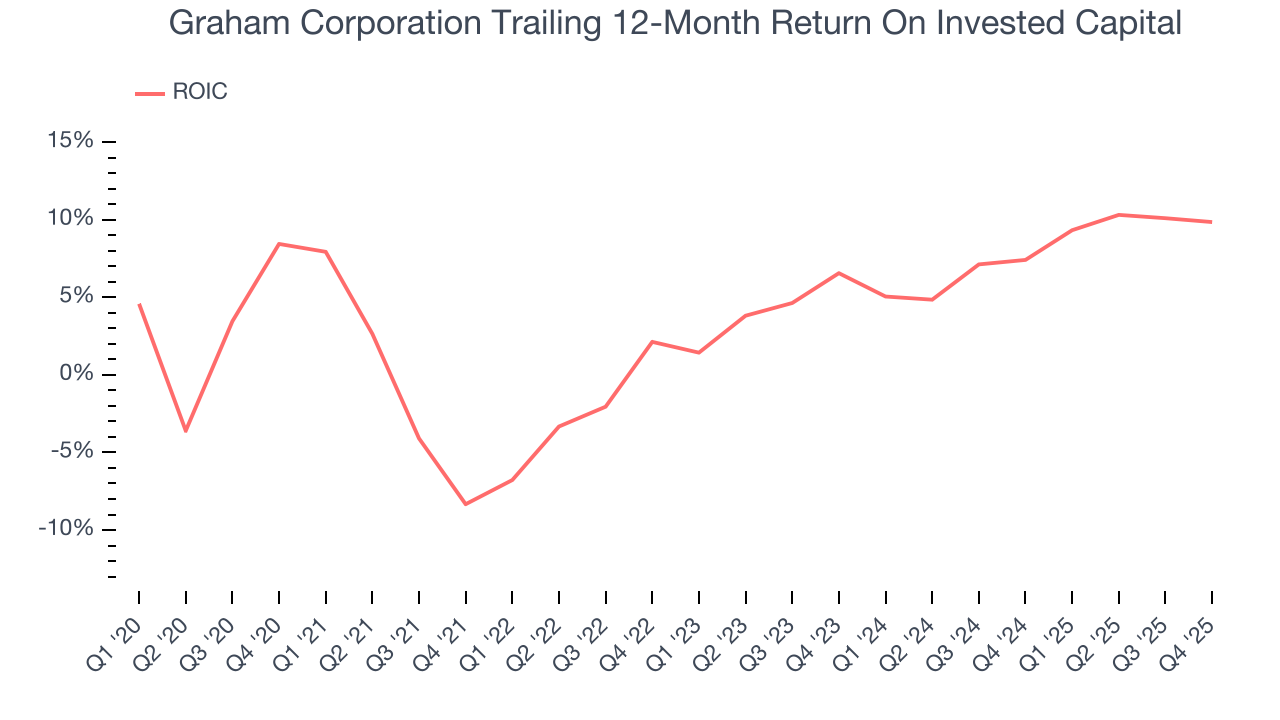
We like to invest in businesses with high returns, but the trend in a company’s ROIC is what often surprises the market and moves the stock price. Over the last few years, Graham Corporation’s ROIC has increased. This is a good sign, but we recognize its lack of profitable growth during the COVID era was the primary reason for the change.
11. Balance Sheet Assessment
Businesses that maintain a cash surplus face reduced bankruptcy risk.
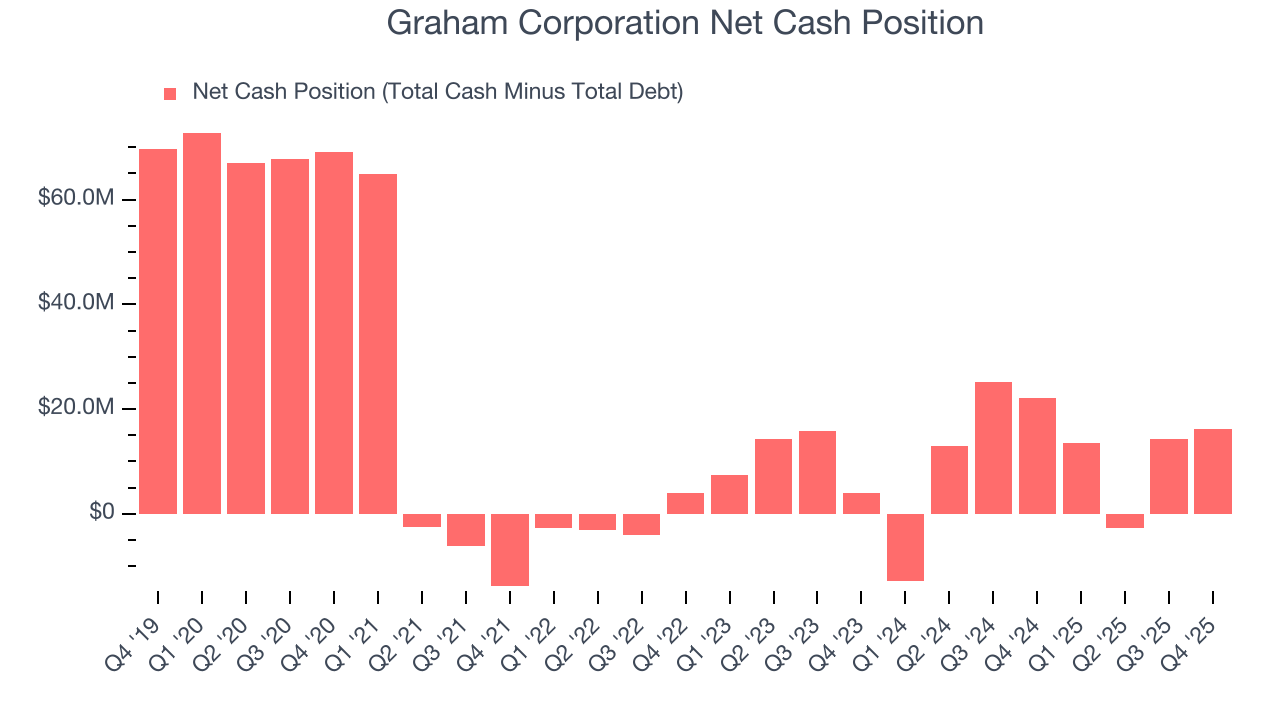
Graham Corporation is a well-capitalized company with $22.25 million of cash and $6.05 million of debt on its balance sheet. This $16.2 million net cash position gives it the freedom to borrow money, return capital to shareholders, or invest in growth initiatives. Leverage is not an issue here.
12. Key Takeaways from Graham Corporation’s Q4 Results
It was good to see Graham Corporation beat analysts’ EPS expectations this quarter. We were also excited its EBITDA outperformed Wall Street’s estimates by a wide margin. Zooming out, we think this was a solid print. The stock remained flat at $73.75 immediately following the results.
13. Is Now The Time To Buy Graham Corporation?
Updated: February 16, 2026 at 10:13 PM EST
Before deciding whether to buy Graham Corporation or pass, we urge investors to consider business quality, valuation, and the latest quarterly results.
Graham Corporation is an amazing business ranking highly on our list. First of all, the company’s revenue growth was exceptional over the last five years. And while its relatively low ROIC suggests management has struggled to find compelling investment opportunities, its backlog growth has been marvelous. On top of that, Graham Corporation’s rising cash profitability gives it more optionality.
Graham Corporation’s P/E ratio based on the next 12 months is 42.2x. Despite the higher valuation, we still like Graham Corporation at this price given it’s one of the best businesses out there. We think it deserves a spot in your portfolio.
Wall Street analysts have a consensus one-year price target of $88.25 on the company (compared to the current share price of $84.40), implying they see 4.6% upside in buying Graham Corporation in the short term.