
General Mills (GIS)
General Mills doesn’t excite us. Not only has it failed to grow sales but also its cash conversion has caved, showing it’s struggling to adapt.― StockStory Analyst Team
1. News
2. Summary
Why We Think General Mills Will Underperform
Best known for its portfolio of powerhouse breakfast cereal brands, General Mills (NYSE:GIS) is a packaged foods company that has also made a mark in cereals, baking products, and snacks.
- Sales stagnated over the last three years and signal the need for new growth strategies
- Sales are projected to tank by 3.3% over the next 12 months as demand evaporates further
- A bright spot is that its scale advantages are evident in its $19.16 billion revenue base, which provides operating leverage when demand is strong


General Mills doesn’t satisfy our quality benchmarks. You should search for better opportunities.
Why There Are Better Opportunities Than General Mills


General Mills is trading at $47.17 per share, or 12.8x forward P/E. General Mills’s multiple may seem like a great deal among consumer staples peers, but we think there are valid reasons why it’s this cheap.
Our advice is to pay up for elite businesses whose advantages are tailwinds to earnings growth. Don’t get sucked into lower-quality businesses just because they seem like bargains. These mediocre businesses often never achieve a higher multiple as hoped, a phenomenon known as a “value trap”.
3. General Mills (GIS) Research Report: Q4 CY2025 Update
Packaged foods company General Mills (NYSE:GIS) announced better-than-expected revenue in Q4 CY2025, but sales fell by 7.2% year on year to $4.86 billion. Its non-GAAP profit of $1.10 per share was 7.1% above analysts’ consensus estimates.
General Mills (GIS) Q4 CY2025 Highlights:
- Revenue: $4.86 billion vs analyst estimates of $4.77 billion (7.2% year-on-year decline, 1.9% beat)
- Adjusted EPS: $1.10 vs analyst estimates of $1.03 (7.1% beat)
- Adjusted EBITDA: $850.9 million vs analyst estimates of $935.5 million (17.5% margin, 9% miss)
- Operating Margin: 15%, down from 20.6% in the same quarter last year
- Free Cash Flow Margin: 13.9%, down from 18.9% in the same quarter last year
- Organic Revenue fell 1% year on year vs analyst estimates of 2.8% declines (179.5 basis point beat)
- Sales Volumes fell 9% year on year (3% in the same quarter last year)
- Market Capitalization: $25.08 billion
Company Overview
Best known for its portfolio of powerhouse breakfast cereal brands, General Mills (NYSE:GIS) is a packaged foods company that has also made a mark in cereals, baking products, and snacks.
The company traces its roots back to 1866 when it started as Minneapolis Milling Company. The early years were marked by innovation, including the development of a more efficient grinding mill. In the 1920s, the company merged with 26 other mills to form General Mills.
Through organic development as well as mergers and acquisitions of companies such as Betty Crocker and Pillsbury, General Mills built a powerful portfolio of packaged foods brands. Today, Cheerios, Chex, Betty Crocker, Yoplait, and Haagen-Dazs are some of the company’s gems and also some of the most recognized brands in American households.
General Mills caters to middle-income households seeking convenience through trusted brands. The heads or caretakers of these households are usually busy and don’t have the time to cook meals or prepare snacks from scratch. The company’s products add convenience to everyday life, and they are often brands that customers have been eating since childhood. General Mills products are sold nearly everywhere. Retailers from the largest supermarkets to the corner deli or bodega all carry that box of Cheerios or the pint of Haagen-Dazs ice cream. Given the company’s scale and traffic-driving brands, General Mills often has prominent placement on retailer shelves.
4. Shelf-Stable Food
As America industrialized and moved away from an agricultural economy, people faced more demands on their time. Packaged foods emerged as a solution offering convenience to the evolving American family, whether it be canned goods or snacks. Today, Americans seek brands that are high in quality, reliable, and reasonably priced. Furthermore, there's a growing emphasis on health-conscious and sustainable food options. Packaged food stocks are considered resilient investments. People always need to eat, so these companies can enjoy consistent demand as long as they stay on top of changing consumer preferences. The industry spans from multinational corporations to smaller specialized firms and is subject to food safety and labeling regulations.
Competitors in packaged food with broad brand portfolios include Kellogg (NYSE:K), Mondelez (NASDAQ:MDLZ), Kraft Heinz (NASDAQ:KHC), and Nestle (SWX:NESN).
5. Revenue Growth
Reviewing a company’s long-term sales performance reveals insights into its quality. Any business can experience short-term success, but top-performing ones enjoy sustained growth for years.
With $18.78 billion in revenue over the past 12 months, General Mills is larger than most consumer staples companies and benefits from economies of scale, enabling it to gain more leverage on its fixed costs than smaller competitors. Its size also gives it negotiating leverage with distributors, allowing its products to reach more shelves. However, its scale is a double-edged sword because there are only so many big store chains to sell into, making it harder to find incremental growth. To accelerate sales, General Mills likely needs to optimize its pricing or lean into new products and international expansion.
As you can see below, General Mills’s revenue declined by 1% per year over the last three years as consumers bought less of its products.
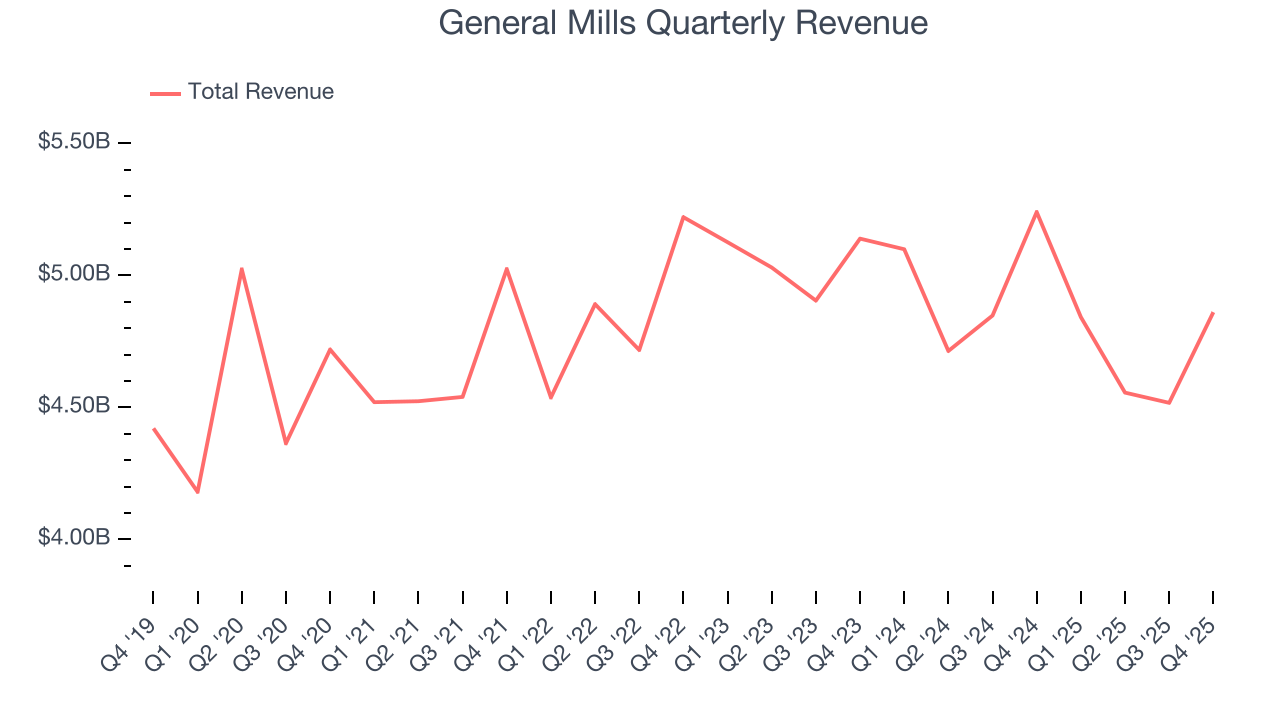
This quarter, General Mills’s revenue fell by 7.2% year on year to $4.86 billion but beat Wall Street’s estimates by 1.9%.
Looking ahead, sell-side analysts expect revenue to remain flat over the next 12 months. This projection is underwhelming and implies its newer products will not lead to better top-line performance yet.
6. Volume Growth
Revenue growth can be broken down into changes in price and volume (the number of units sold). While both are important, volume is the lifeblood of a successful staples business as there’s a ceiling to what consumers will pay for everyday goods; they can always trade down to non-branded products if the branded versions are too expensive.
To analyze whether General Mills generated its growth (or lack thereof) from changes in price or volume, we can compare its volume growth to its organic revenue growth, which excludes non-fundamental impacts on company financials like mergers and currency fluctuations.
Over the last two years, General Mills’s average quarterly volumes have shrunk by 3%. This isn’t ideal for a consumer staples company, where demand is typically stable. In the context of its 2.4% average organic sales declines, we can see that most of the company’s losses have come from fewer customers purchasing its products.
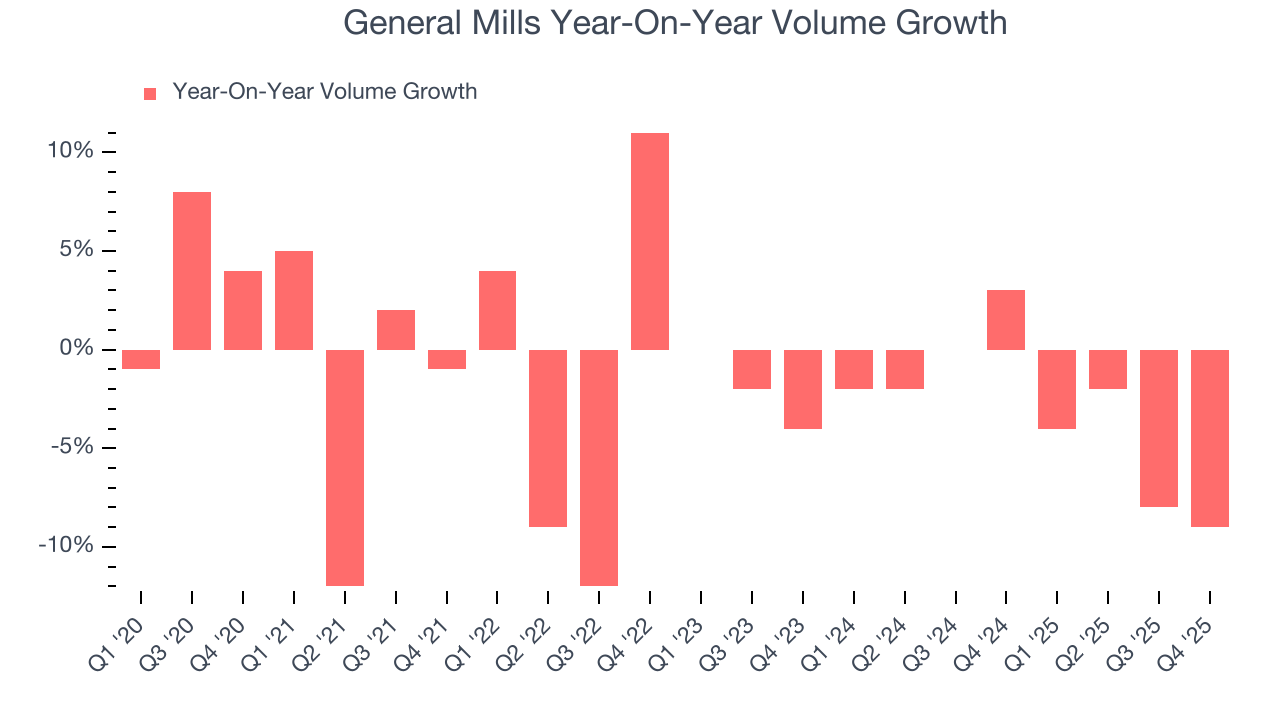
In General Mills’s Q4 2026, sales volumes dropped 9% year on year. This result represents a further deceleration from its historical levels, showing the business is struggling to move its products.
7. Gross Margin & Pricing Power
General Mills’s unit economics are higher than the typical consumer staples company, giving it the flexibility to invest in areas such as marketing and talent to reach more consumers. As you can see below, it averaged a decent 34.6% gross margin over the last two years. Said differently, General Mills paid its suppliers $65.44 for every $100 in revenue. 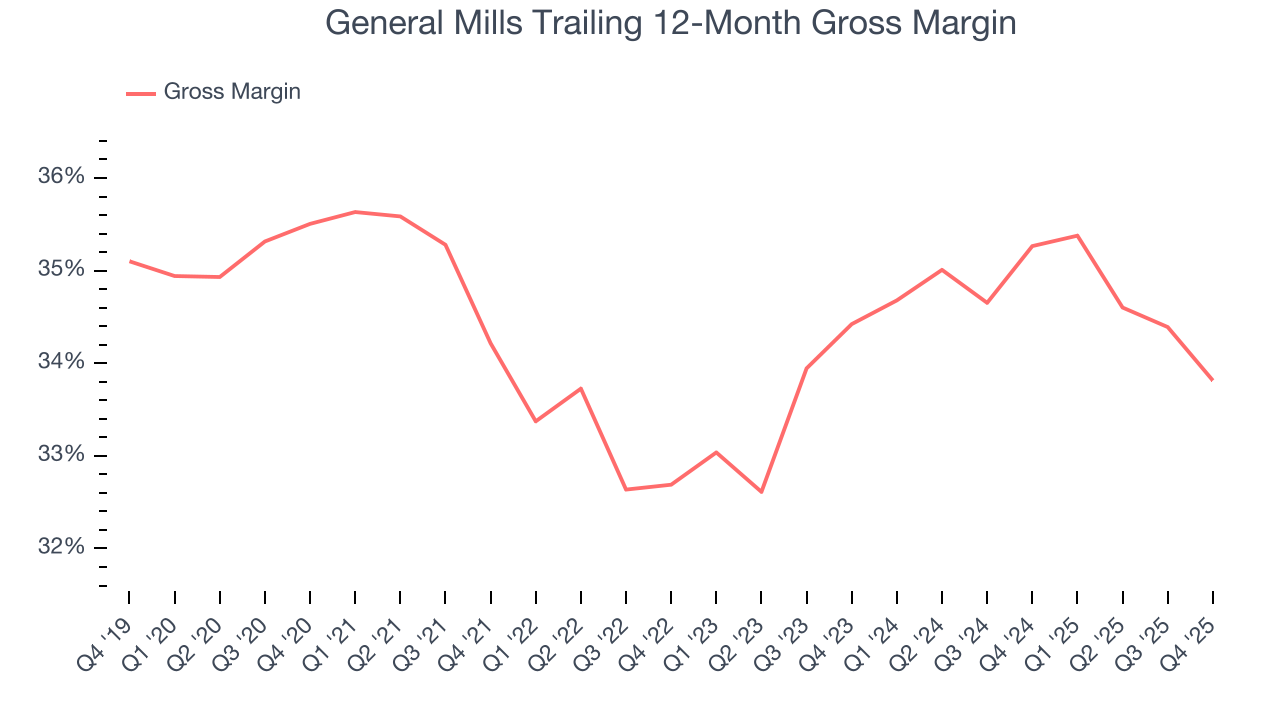
General Mills produced a 34.8% gross profit margin in Q4, down 2 percentage points year on year. General Mills’s full-year margin has also been trending down over the past 12 months, decreasing by 1.5 percentage points. If this move continues, it could suggest a more competitive environment with some pressure to lower prices and higher input costs (such as raw materials and manufacturing expenses).
8. Operating Margin
Operating margin is a key profitability metric because it accounts for all expenses enabling a business to operate smoothly, including marketing and advertising, IT systems, wages, and other administrative costs.
General Mills has been an efficient company over the last two years. It was one of the more profitable businesses in the consumer staples sector, boasting an average operating margin of 19.3%.
Looking at the trend in its profitability, General Mills’s operating margin rose by 2.4 percentage points over the last year, showing its efficiency has improved.
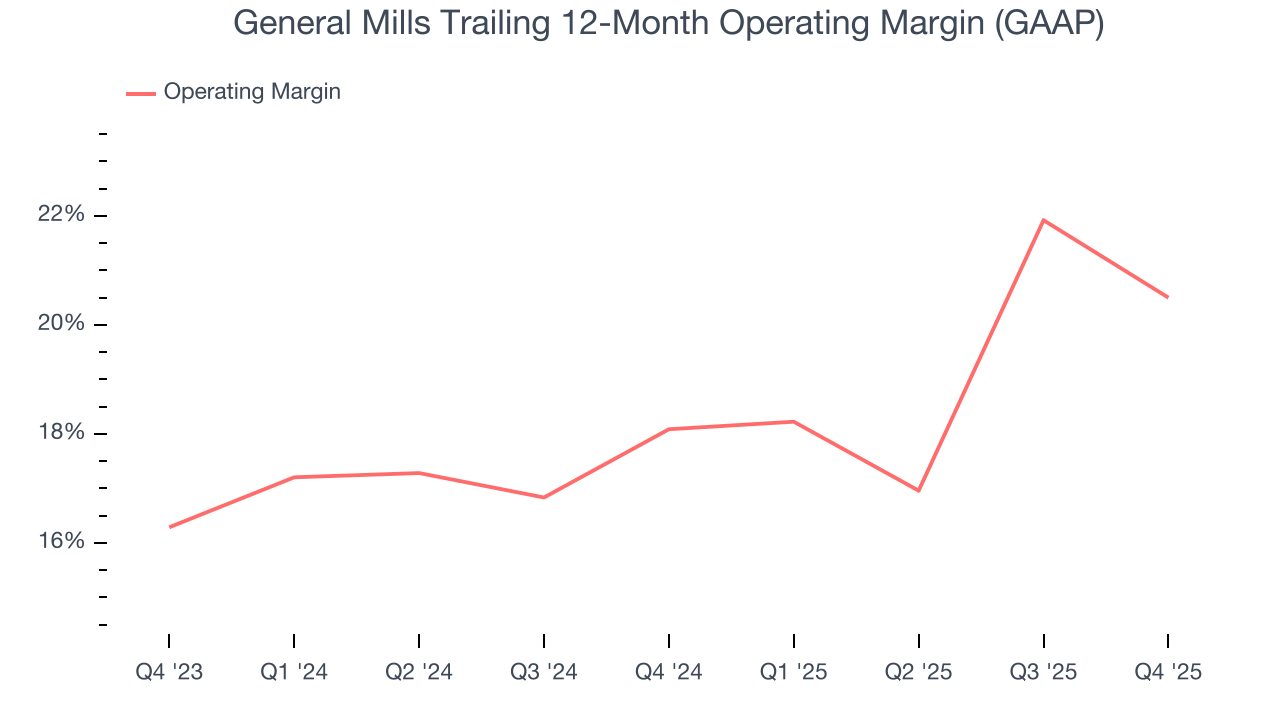
This quarter, General Mills generated an operating margin profit margin of 15%, down 5.6 percentage points year on year. Since General Mills’s operating margin decreased more than its gross margin, we can assume it was less efficient because expenses such as marketing, and administrative overhead increased.
9. Earnings Per Share
We track the change in earnings per share (EPS) for the same reason as long-term revenue growth. Compared to revenue, however, EPS highlights whether a company’s growth is profitable.
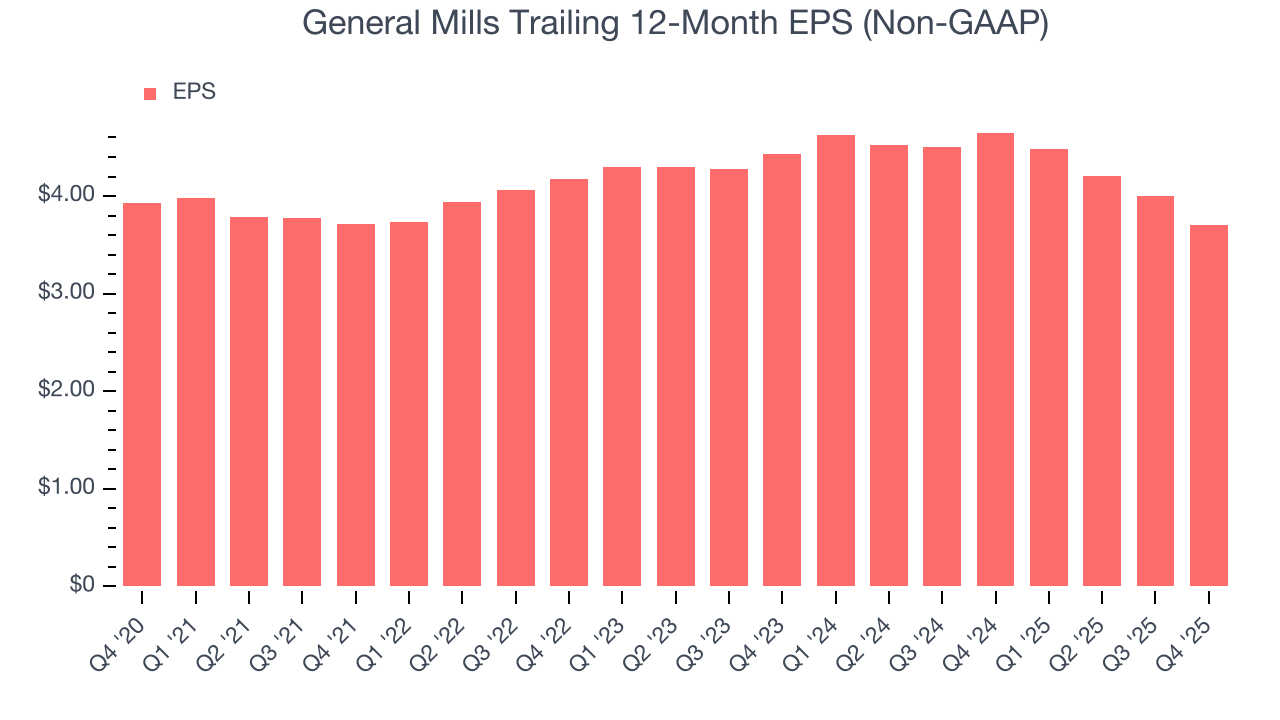
In Q4, General Mills reported adjusted EPS of $1.10, down from $1.40 in the same quarter last year. Despite falling year on year, this print beat analysts’ estimates by 7.1%. Over the next 12 months, Wall Street expects General Mills’s full-year EPS of $3.70 to grow 1.9%.
10. Cash Is King
Although earnings are undoubtedly valuable for assessing company performance, we believe cash is king because you can’t use accounting profits to pay the bills.
General Mills has shown robust cash profitability, giving it an edge over its competitors and the ability to reinvest or return capital to investors. The company’s free cash flow margin averaged 11.8% over the last two years, quite impressive for a consumer staples business.
Taking a step back, we can see that General Mills’s margin dropped by 4.6 percentage points over the last year. This decrease warrants extra caution because General Mills failed to grow its revenue organically. Its cash profitability could decay further if it tries to reignite growth through investments.
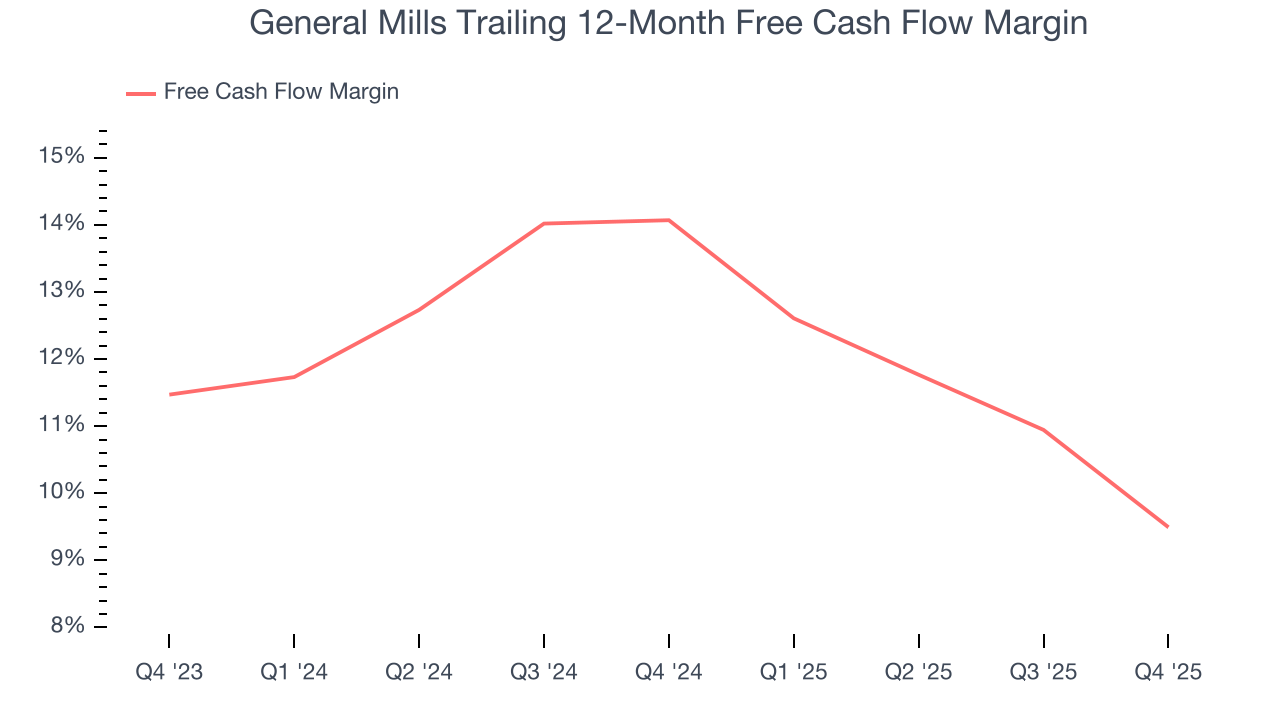
General Mills’s free cash flow clocked in at $675.7 million in Q4, equivalent to a 13.9% margin. The company’s cash profitability regressed as it was 5 percentage points lower than in the same quarter last year, but it’s still above its two-year average. We wouldn’t read too much into this quarter’s decline because investment needs can be seasonal, leading to short-term swings. Long-term trends are more important.
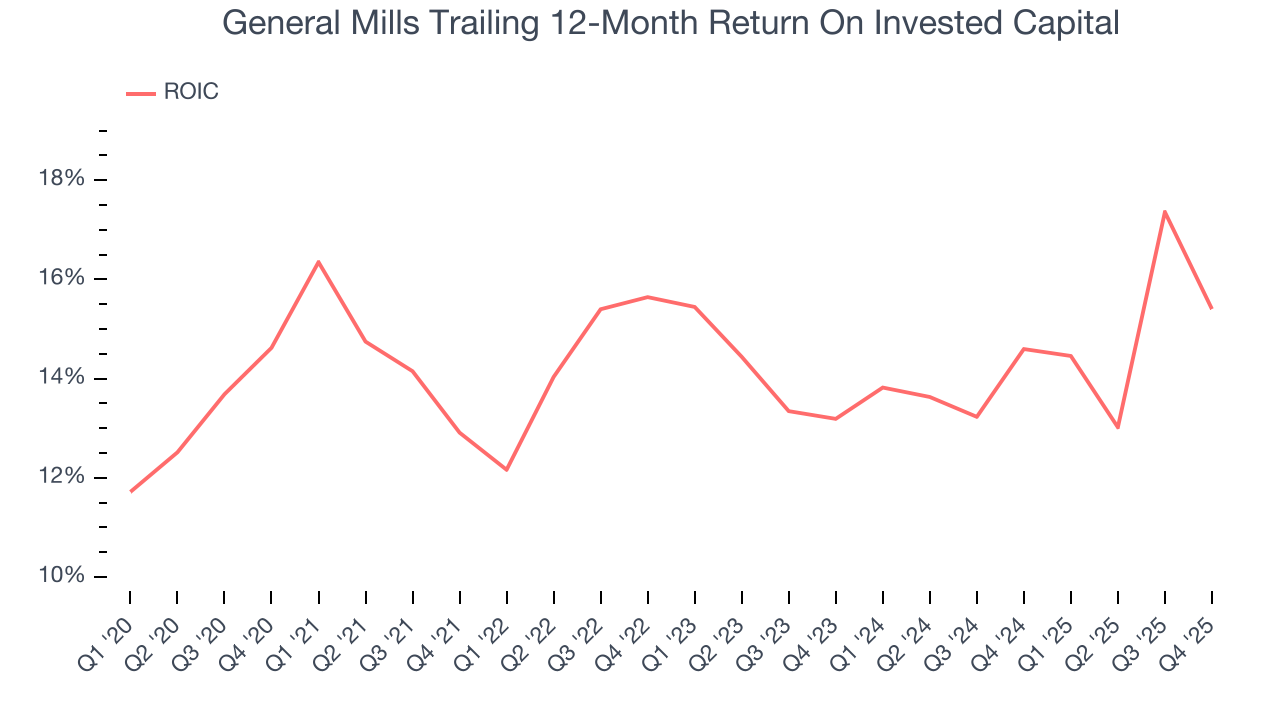
11. Return on Invested Capital (ROIC)
EPS and free cash flow tell us whether a company was profitable while growing its revenue. But was it capital-efficient? A company’s ROIC explains this by showing how much operating profit it makes compared to the money it has raised (debt and equity).
Although General Mills hasn’t been the highest-quality company lately because of its poor revenue and EPS performance, it historically found a few growth initiatives that worked. Its five-year average ROIC was 14.3%, higher than most consumer staples businesses.
12. Balance Sheet Assessment
General Mills reported $683.4 million of cash and $13.73 billion of debt on its balance sheet in the most recent quarter. As investors in high-quality companies, we primarily focus on two things: 1) that a company’s debt level isn’t too high and 2) that its interest payments are not excessively burdening the business.
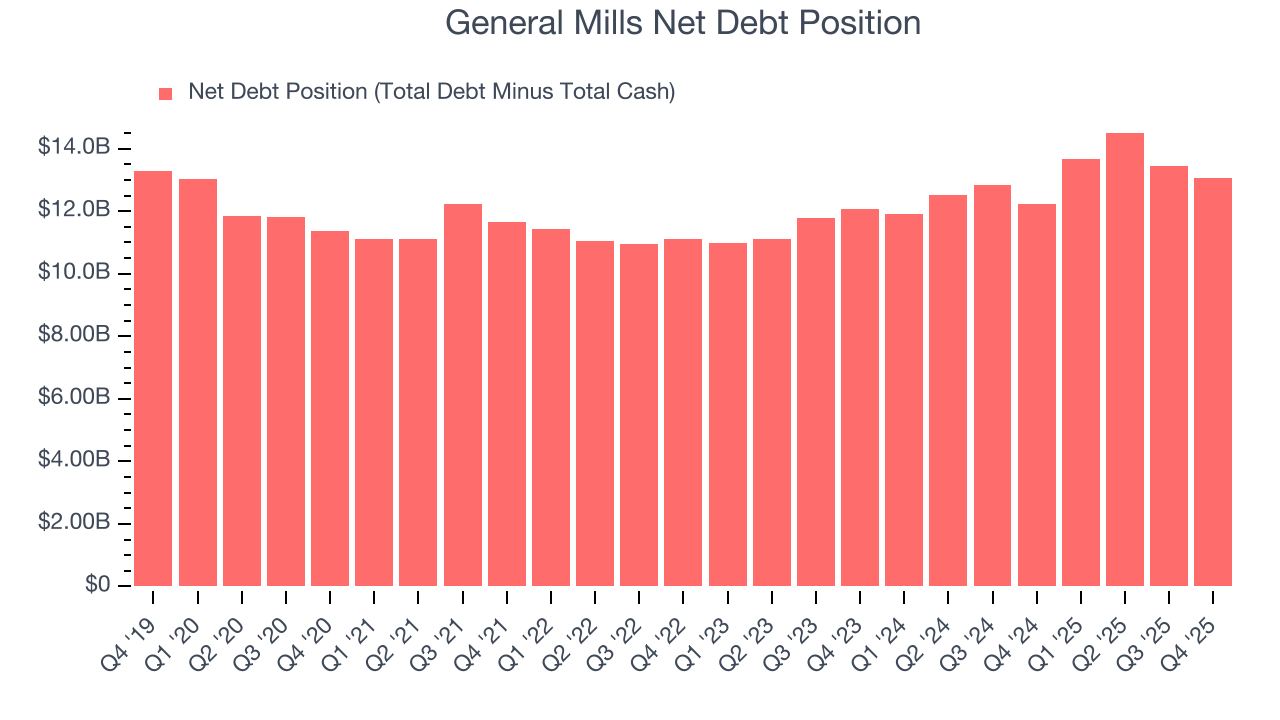
With $3.39 billion of EBITDA over the last 12 months, we view General Mills’s 3.8× net-debt-to-EBITDA ratio as safe. We also see its $282.9 million of annual interest expenses as appropriate. The company’s profits give it plenty of breathing room, allowing it to continue investing in growth initiatives.
13. Key Takeaways from General Mills’s Q4 Results
It was encouraging to see General Mills beat analysts’ organic revenue expectations this quarter. We were also happy its revenue outperformed Wall Street’s estimates. On the other hand, its EBITDA missed. Overall, this quarter could have been better. The stock traded up 1.9% to $47.93 immediately after reporting.
14. Is Now The Time To Buy General Mills?
Updated: December 17, 2025 at 7:14 AM EST
Before deciding whether to buy General Mills or pass, we urge investors to consider business quality, valuation, and the latest quarterly results.
General Mills isn’t a terrible business, but it doesn’t pass our bar. To kick things off, its revenue has declined over the last three years, and analysts don’t see anything changing over the next 12 months. And while its unparalleled brand awareness makes it a household name consumers consistently turn to, the downside is its shrinking sales volumes suggest it’ll need to change its strategy to succeed. On top of that, its cash profitability fell over the last year.
General Mills’s P/E ratio based on the next 12 months is 12.5x. This valuation multiple is fair, but we don’t have much faith in the company. We're fairly confident there are better investments elsewhere.
Wall Street analysts have a consensus one-year price target of $52.74 on the company (compared to the current share price of $47.93).