
Corning (GLW)
Corning catches our eye. Its sales and EPS are anticipated to grow nicely over the next 12 months, a welcome sign for investors.― StockStory Analyst Team
1. News


2. Summary
Why Corning Is Interesting
Supplying windows for some of the United States’s earliest spacecraft, Corning (NYSE:GLW) provides glass and other electronic components for the consumer electronics, telecommunications, automotive, and healthcare industries.
- Demand for the next 12 months is expected to accelerate above its two-year trend as Wall Street forecasts robust revenue growth of 15.7%
- Offerings are difficult to replicate at scale and result in a stellar gross margin of 38.1%
- One risk is its underwhelming 6.4% return on capital reflects management’s difficulties in finding profitable growth opportunities


Corning has some respectable qualities. The stock is up 218% over the last five years.
Why Should You Watch Corning


Corning is trading at $131.57 per share, or 41.4x forward P/E. The rich valuation multiple means there is a lot of good news priced into the stock; short-term price swings could result if anything bursts that bubble.
Corning can improve its fundamentals over time by putting up good numbers quarter after quarter, year after year. Once that happens, we’ll be happy to recommend the stock.
3. Corning (GLW) Research Report: Q4 CY2025 Update
Glass and electronic component manufacturer Corning (NYSE:GLW) missed Wall Street’s revenue expectations in Q4 CY2025, but sales rose 8.8% year on year to $4.22 billion. Next quarter’s revenue guidance of $4.25 billion underwhelmed, coming in 0.5% below analysts’ estimates. Its non-GAAP profit of $0.72 per share was 2.1% above analysts’ consensus estimates.
Corning (GLW) Q4 CY2025 Highlights:
- Revenue: $4.22 billion vs analyst estimates of $4.37 billion (8.8% year-on-year growth, 3.5% miss)
- Adjusted EPS: $0.72 vs analyst estimates of $0.71 (2.1% beat)
- Adjusted EBITDA: $1.07 billion vs analyst estimates of $1.22 billion (25.3% margin, 12.3% miss)
- Revenue Guidance for Q1 CY2026 is $4.25 billion at the midpoint, below analyst estimates of $4.27 billion
- Adjusted EPS guidance for Q1 CY2026 is $0.68 at the midpoint, roughly in line with what analysts were expecting
- Operating Margin: 15.9%, up from 10.1% in the same quarter last year
- Free Cash Flow Margin: 14.7%, up from 10.6% in the same quarter last year
- Market Capitalization: $94.09 billion
Company Overview
Supplying windows for some of the United States’s earliest spacecraft, Corning (NYSE:GLW) provides glass and other electronic components for the consumer electronics, telecommunications, automotive, and healthcare industries.
Corning was founded in 1851 as Bay State Glass but was renamed to Corning Glass Works when it relocated to Corning, New York. It expanded its expertise in glass to ceramics and optical physics, enabling the company to offer new products such as optical fiber. Its growth was primarily driven by acquisitions such as MobileAccess Networks, which expanded its presence in the telecommunications infrastructure market, and Samsung Electronics’s Fiber Optics Business, which expanded its optical fiber manufacturing capacity.
The company is renowned for its Gorilla Glass (specialized glass) used in billions of smartphones, tablets, and TVs, providing durability and clarity for electronic displays. In addition to its specialized glass, the company offers fiber optics that enable high-speed internet connectivity and environmental products such as emission control devices that help reduce pollutants. Corning’s products cater to the consumer electronics, telecommunications, automotive, and healthcare industries today.
From tech giants and telecommunications companies to automotive manufacturers, the company sells its products through direct sales, distributors, and long-term contracts with original equipment manufacturers (OEMs). Corning offers its OEMs volume discounts to incentivize larger quantity purchases. In terms of contracts, it typically involves supply agreements and collaborative projects aimed at co-developing.
4. Electronic Components
Like many equipment and component manufacturers, electronic components companies are buoyed by secular trends such as connectivity and industrial automation. More specific pockets of strong demand include data centers and telecommunications, which can benefit companies whose optical and transceiver offerings fit those markets. But like the broader industrials sector, these companies are also at the whim of economic cycles. Consumer spending, for example, can greatly impact these companies’ volumes.
Competitors offering similar products include TE Connectivity (NYSE:TE), Asahi Glass (TSE:5201), and Schott AG (private).
5. Revenue Growth
A company’s long-term sales performance can indicate its overall quality. Any business can have short-term success, but a top-tier one grows for years. Unfortunately, Corning’s 7.2% annualized revenue growth over the last five years was mediocre. This was below our standard for the industrials sector and is a poor baseline for our analysis.
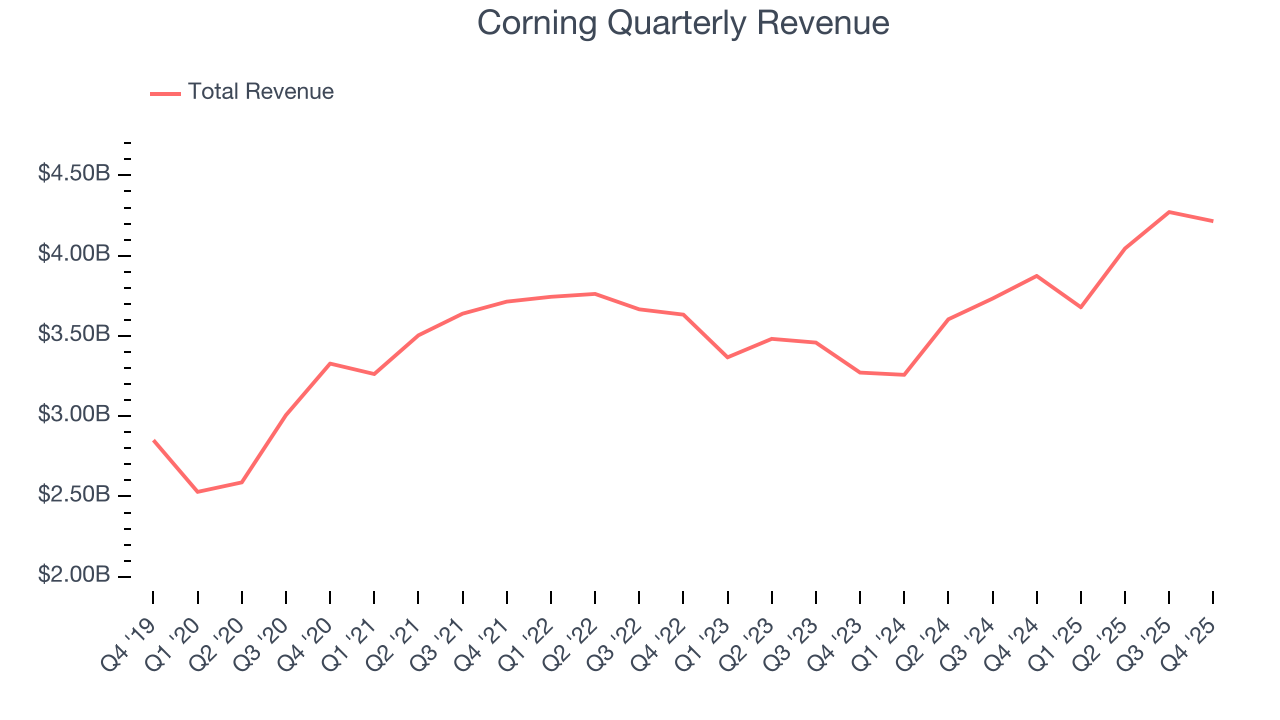
We at StockStory place the most emphasis on long-term growth, but within industrials, a half-decade historical view may miss cycles, industry trends, or a company capitalizing on catalysts such as a new contract win or a successful product line. Corning’s annualized revenue growth of 9.3% over the last two years is above its five-year trend, suggesting its demand recently accelerated. 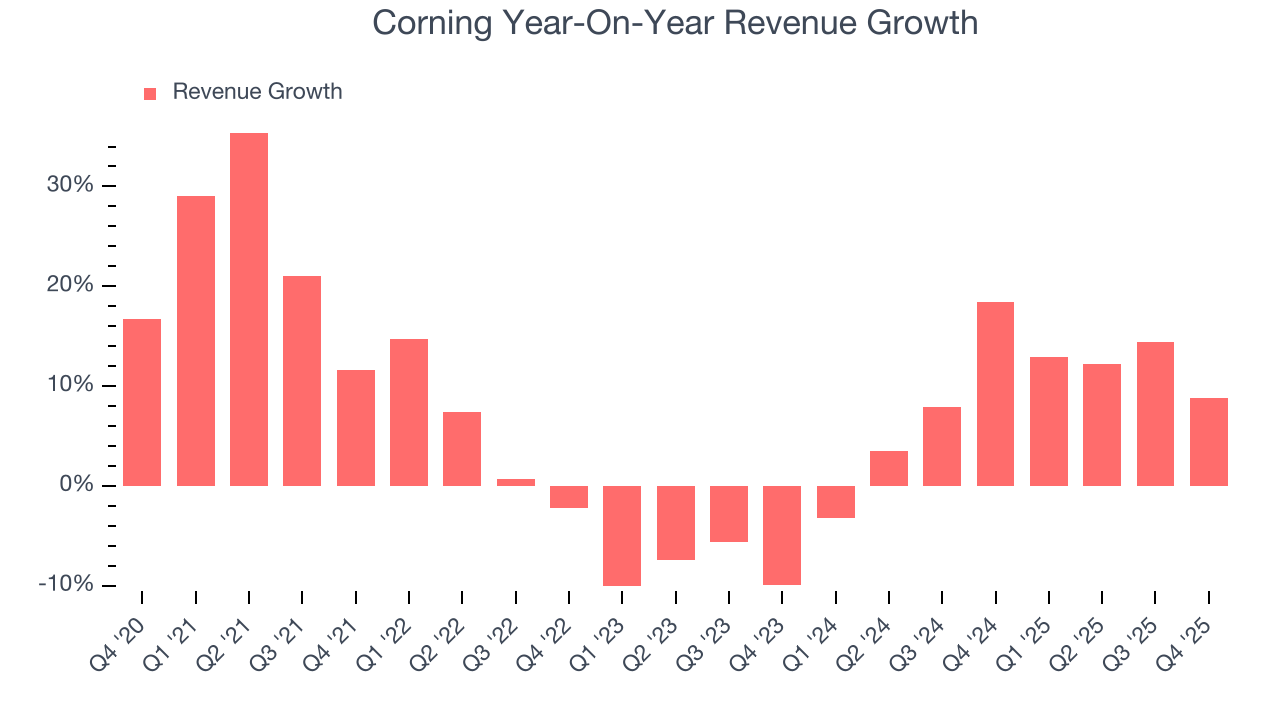
We can better understand the company’s revenue dynamics by analyzing its most important segments, Optical Communications and Display Technologies, which are 40.4% and 22.7% of revenue. Over the last two years, Corning’s Optical Communications revenue (optical fiber & cables) averaged 27.2% year-on-year growth while its Display Technologies revenue (glass for flat panel displays) averaged 2.9% growth. 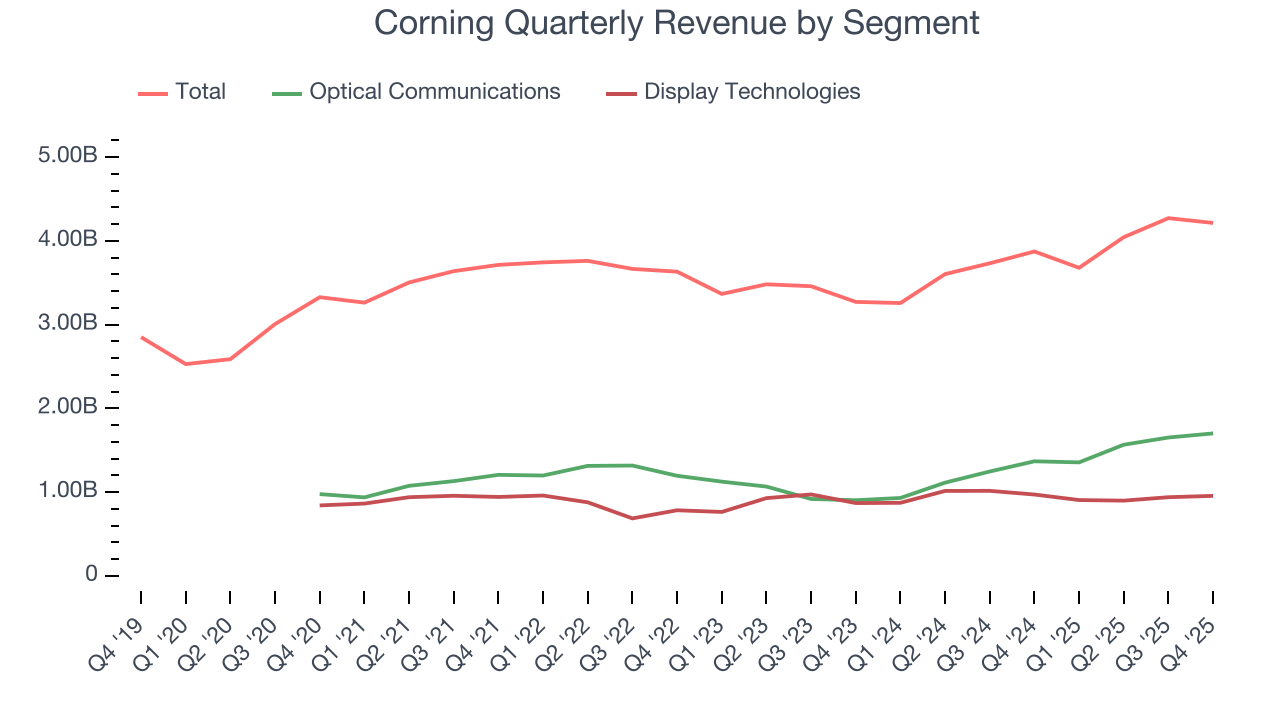
This quarter, Corning’s revenue grew by 8.8% year on year to $4.22 billion, missing Wall Street’s estimates. Company management is currently guiding for a 15.5% year-on-year increase in sales next quarter.
Looking further ahead, sell-side analysts expect revenue to grow 14.1% over the next 12 months, an improvement versus the last two years. This projection is eye-popping for a company of its scale and indicates its newer products and services will fuel better top-line performance.
6. Gross Margin & Pricing Power
All else equal, we prefer higher gross margins because they usually indicate that a company sells more differentiated products and commands stronger pricing power.
Corning’s unit economics are great compared to the broader industrials sector and signal that it enjoys product differentiation through quality or brand. As you can see below, it averaged an excellent 38% gross margin over the last five years. Said differently, roughly $37.95 was left to spend on selling, marketing, R&D, and general administrative overhead for every $100 in revenue. 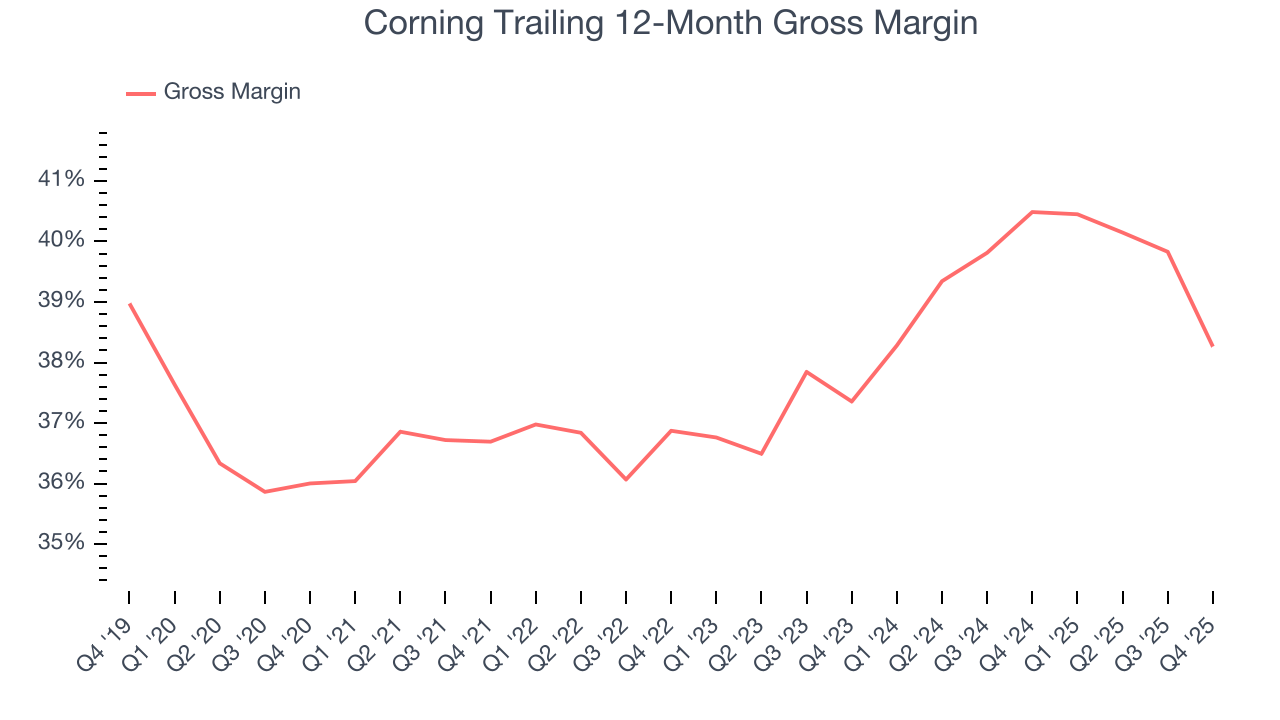
Corning produced a 35.5% gross profit margin in Q4, down 6.2 percentage points year on year. Corning’s full-year margin has also been trending down over the past 12 months, decreasing by 2.2 percentage points. If this move continues, it could suggest a more competitive environment with some pressure to lower prices and higher input costs (such as raw materials and manufacturing expenses).
7. Operating Margin
Corning’s operating margin has been trending up over the last 12 months and averaged 10.7% over the last five years. Its solid profitability for an industrials business shows it’s an efficient company that manages its expenses effectively. This result isn’t surprising as its high gross margin gives it a favorable starting point.
Analyzing the trend in its profitability, Corning’s operating margin might fluctuated slightly but has generally stayed the same over the last five years. This raises questions about the company’s expense base because its revenue growth should have given it leverage on its fixed costs, resulting in better economies of scale and profitability.
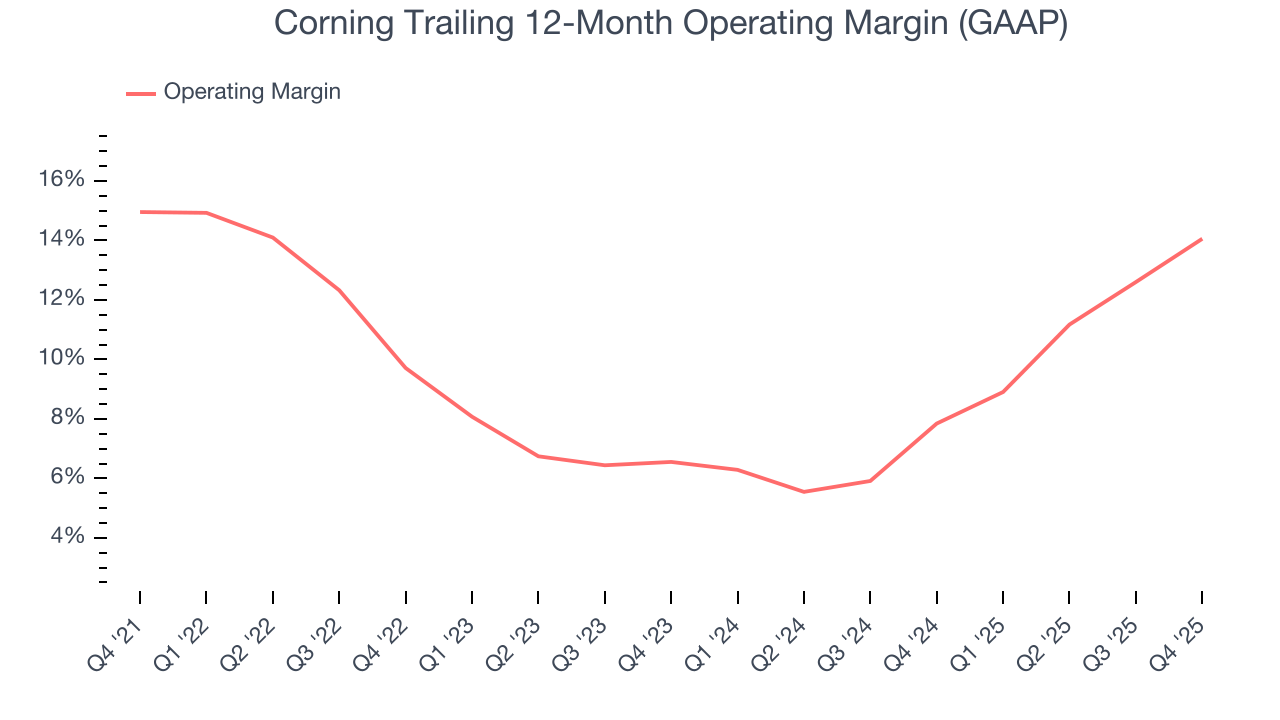
In Q4, Corning generated an operating margin profit margin of 15.9%, up 5.8 percentage points year on year. The increase was solid, and because its gross margin actually decreased, we can assume it was more efficient because its operating expenses like marketing, R&D, and administrative overhead grew slower than its revenue.
8. Earnings Per Share
We track the long-term change in earnings per share (EPS) for the same reason as long-term revenue growth. Compared to revenue, however, EPS highlights whether a company’s growth is profitable.
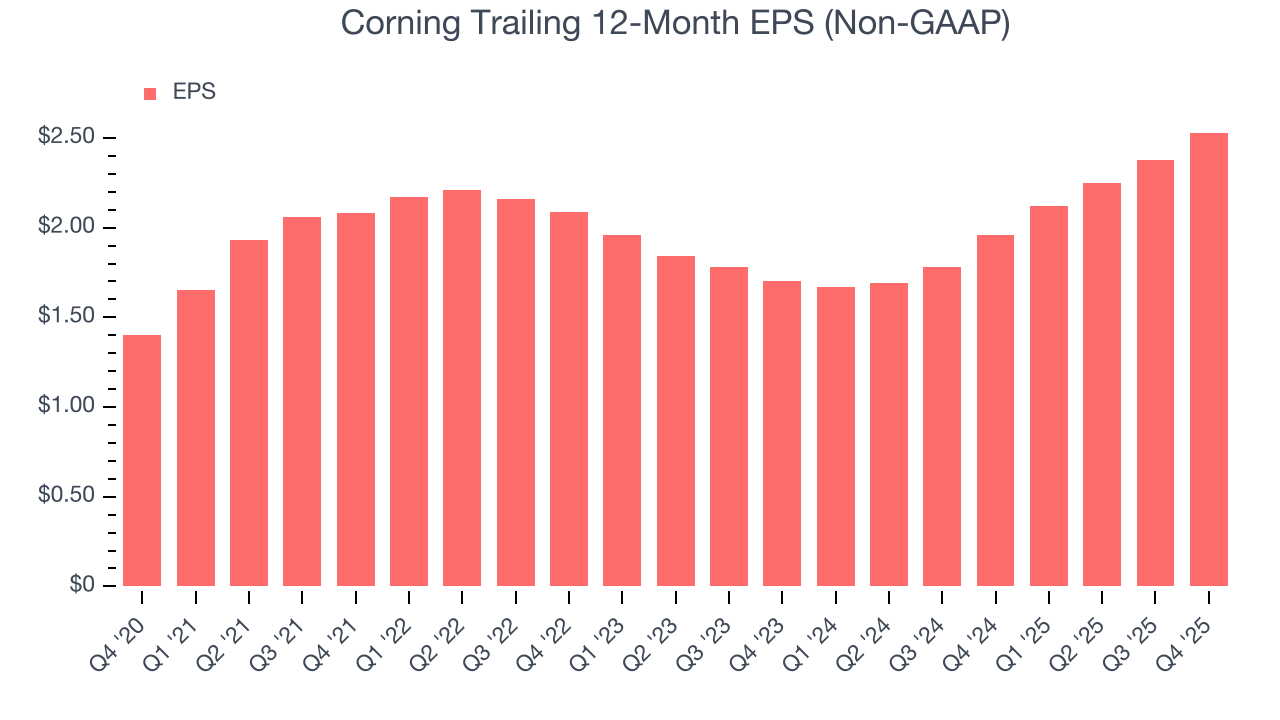
Corning’s EPS grew at a remarkable 12.6% compounded annual growth rate over the last five years, higher than its 7.2% annualized revenue growth. This tells us the company became more profitable on a per-share basis as it expanded.
Diving into the nuances of Corning’s earnings can give us a better understanding of its performance. A five-year view shows that Corning has repurchased its stock, shrinking its share count by 2.9%. This tells us its EPS outperformed its revenue not because of increased operational efficiency but financial engineering, as buybacks boost per share earnings. 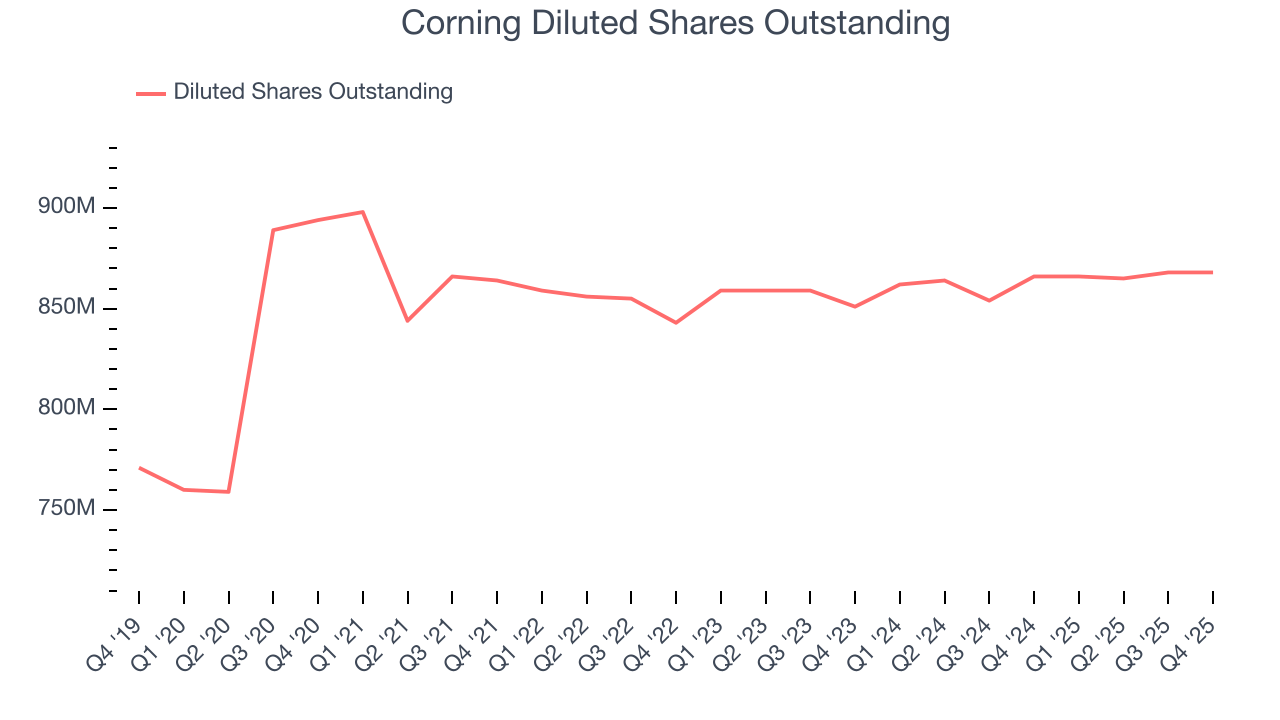
Like with revenue, we analyze EPS over a more recent period because it can provide insight into an emerging theme or development for the business.
For Corning, its two-year annual EPS growth of 22% was higher than its five-year trend. We love it when earnings growth accelerates, especially when it accelerates off an already high base.
In Q4, Corning reported adjusted EPS of $0.72, up from $0.57 in the same quarter last year. This print beat analysts’ estimates by 2.1%. Over the next 12 months, Wall Street expects Corning’s full-year EPS of $2.53 to grow 22.3%.
9. Cash Is King
Although earnings are undoubtedly valuable for assessing company performance, we believe cash is king because you can’t use accounting profits to pay the bills.
Corning has shown impressive cash profitability, enabling it to ride out cyclical downturns more easily while maintaining its investments in new and existing offerings. The company’s free cash flow margin averaged 9.2% over the last five years, better than the broader industrials sector.
Taking a step back, we can see that Corning’s margin dropped by 2.6 percentage points during that time. If its declines continue, it could signal increasing investment needs and capital intensity.
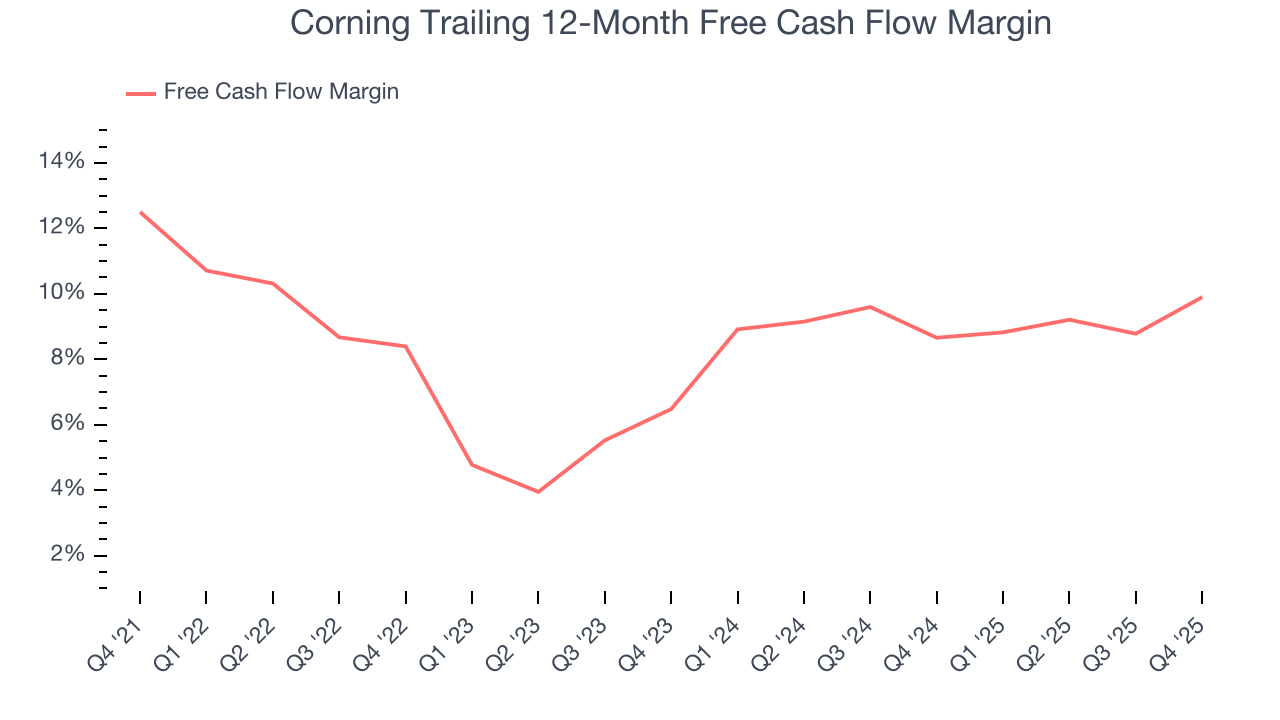
Corning’s free cash flow clocked in at $620 million in Q4, equivalent to a 14.7% margin. This result was good as its margin was 4.2 percentage points higher than in the same quarter last year. Its cash profitability was also above its five-year level, and we hope the company can build on this trend.
10. Return on Invested Capital (ROIC)
EPS and free cash flow tell us whether a company was profitable while growing its revenue. But was it capital-efficient? A company’s ROIC explains this by showing how much operating profit it makes compared to the money it has raised (debt and equity).
Corning historically did a mediocre job investing in profitable growth initiatives. Its five-year average ROIC was 6.7%, somewhat low compared to the best industrials companies that consistently pump out 20%+.
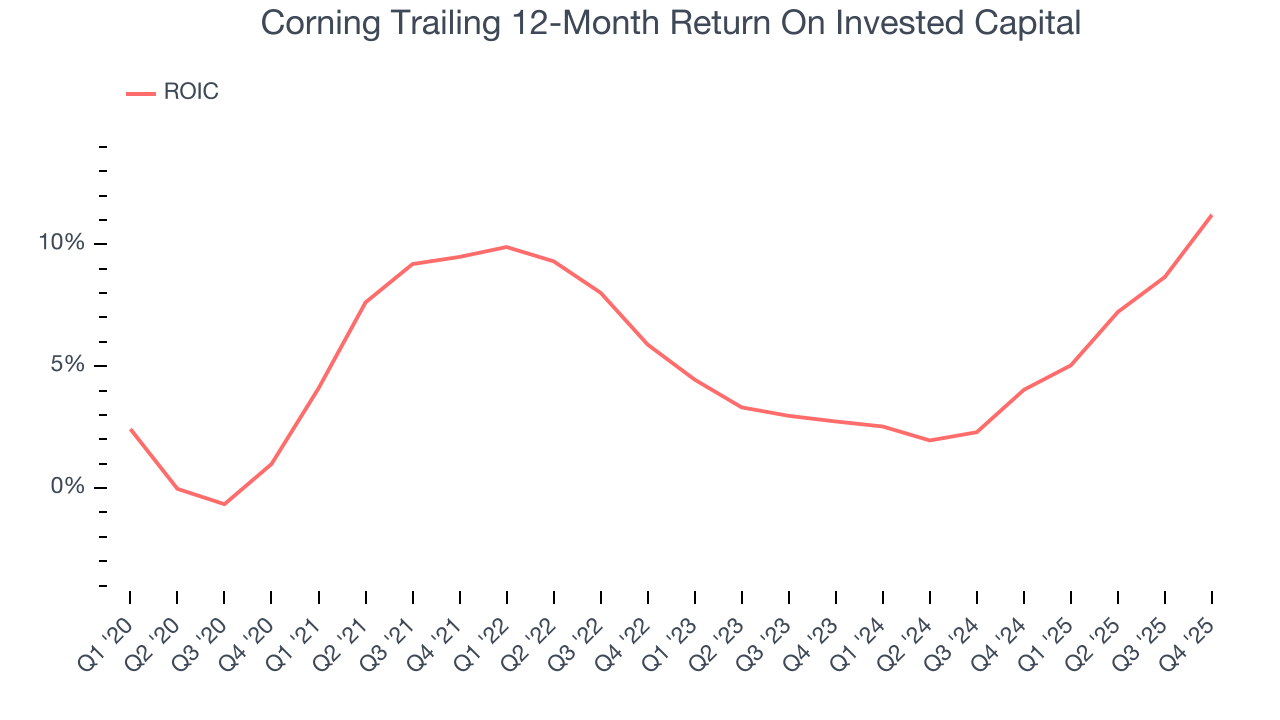
We like to invest in businesses with high returns, but the trend in a company’s ROIC is what often surprises the market and moves the stock price. Unfortunately, Corning’s ROIC has stayed the same over the last few years. If the company wants to become an investable business, it must improve its returns by generating more profitable growth.
11. Balance Sheet Assessment
Corning reported $1.53 billion of cash and $8.43 billion of debt on its balance sheet in the most recent quarter. As investors in high-quality companies, we primarily focus on two things: 1) that a company’s debt level isn’t too high and 2) that its interest payments are not excessively burdening the business.
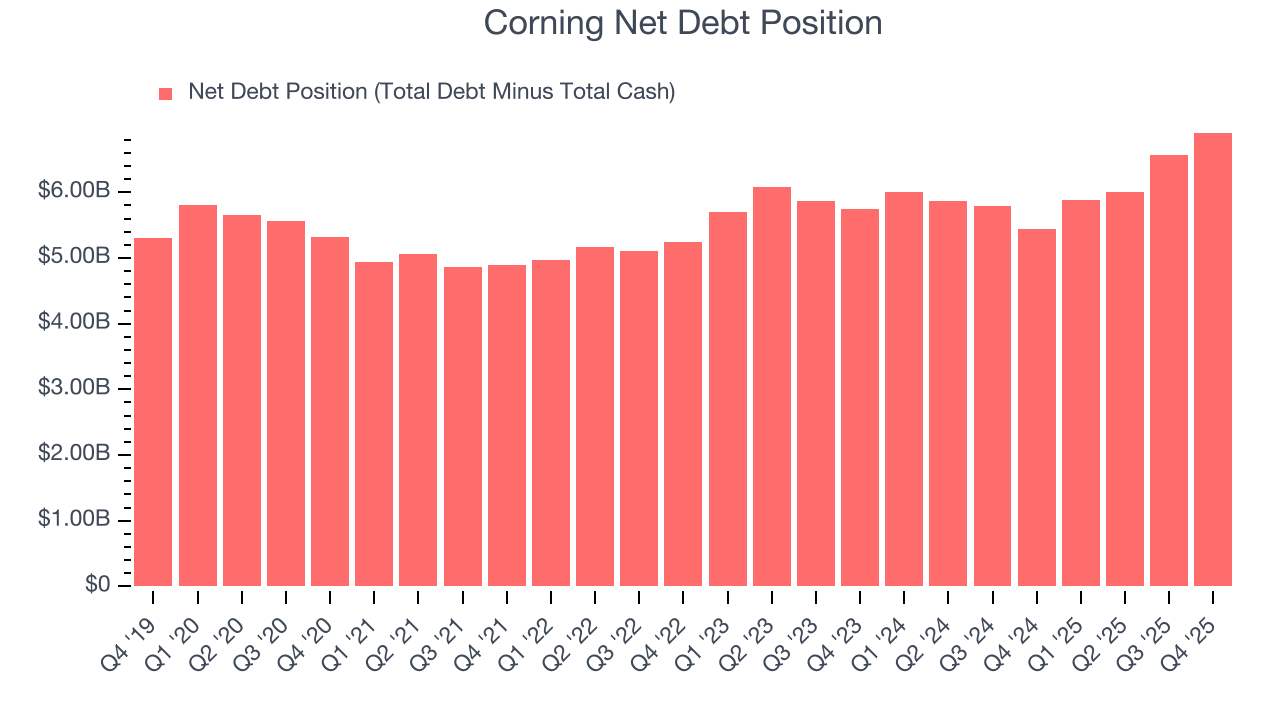
With $4.25 billion of EBITDA over the last 12 months, we view Corning’s 1.6× net-debt-to-EBITDA ratio as safe. We also see its $134 million of annual interest expenses as appropriate. The company’s profits give it plenty of breathing room, allowing it to continue investing in growth initiatives.
12. Key Takeaways from Corning’s Q4 Results
We were impressed by how significantly Corning blew past analysts’ Display Technologies revenue expectations this quarter. On the other hand, its revenue missed and its EBITDA fell short of Wall Street’s estimates. Overall, this was a softer quarter. The stock traded down 3.4% to $106.29 immediately following the results.
13. Is Now The Time To Buy Corning?
Updated: March 16, 2026 at 11:35 PM EDT
Before investing in or passing on Corning, we urge you to understand the company’s business quality (or lack thereof), valuation, and the latest quarterly results - in that order.
We think Corning is a solid business. Although its revenue growth was mediocre over the last five years, its growth over the next 12 months is expected to be higher. And while Corning’s relatively low ROIC suggests management has struggled to find compelling investment opportunities, its projected EPS for the next year implies the company’s fundamentals will improve. On top of that, its healthy gross margins indicate the value of its differentiated offerings.
Corning’s P/E ratio based on the next 12 months is 41.4x. This valuation tells us that a lot of optimism is priced in. Add this one to your watchlist and come back to it later.
Wall Street analysts have a consensus one-year price target of $128.31 on the company (compared to the current share price of $131.57).