
Hillenbrand (HI)
We wouldn’t buy Hillenbrand. Its weak sales growth and declining returns on capital show its demand and profits are shrinking.― StockStory Analyst Team
1. News


2. Summary
Why We Think Hillenbrand Will Underperform
Hillenbrand, Inc. (NYSE: HI) is an industrial company that designs, manufactures, and sells highly engineered processing equipment and solutions for various industries.
- Sales tumbled by 2.7% annually over the last two years, showing market trends are working against its favor during this cycle
- Incremental sales over the last five years were less profitable as its earnings per share were flat while its revenue grew
- Projected sales decline of 7.5% over the next 12 months indicates demand will continue deteriorating


Hillenbrand falls below our quality standards. We’re redirecting our focus to better businesses.
Why There Are Better Opportunities Than Hillenbrand


Hillenbrand is trading at $31.89 per share, or 12.4x forward P/E. Yes, this valuation multiple is lower than that of other industrials peers, but we’ll remind you that you often get what you pay for.
Our advice is to pay up for elite businesses whose advantages are tailwinds to earnings growth. Don’t get sucked into lower-quality businesses just because they seem like bargains. These mediocre businesses often never achieve a higher multiple as hoped, a phenomenon known as a “value trap”.
3. Hillenbrand (HI) Research Report: Q3 CY2025 Update
Industrial processing equipment and solutions provider Hillenbrand (NYSE:HI) reported Q3 CY2025 results exceeding the market’s revenue expectations, but sales fell by 22.1% year on year to $652.1 million. Its non-GAAP profit of $0.83 per share was 36.1% above analysts’ consensus estimates. As announced on October 15, 2025, Hillenbrand has entered into a definitive agreement to be acquired by an affiliate of Lone Star Funds ("Lone Star") in an all-cash transaction that equates to an enterprise value of approximately $3.8 billion.
Hillenbrand (HI) Q3 CY2025 Highlights:
- Revenue: $652.1 million vs analyst estimates of $594.1 million (22.1% year-on-year decline, 9.8% beat)
- Adjusted EPS: $0.83 vs analyst estimates of $0.61 (36.1% beat)
- Adjusted EBITDA: $107.9 million vs analyst estimates of $96.77 million (16.5% margin, 11.5% beat)
- Operating Margin: 12.3%, down from 14.4% in the same quarter last year
- Backlog: $1.57 billion at quarter end
- Market Capitalization: $2.23 billion
Company Overview
Hillenbrand, Inc. (NYSE: HI) is an industrial company that designs, manufactures, and sells highly engineered processing equipment and solutions for various industries.
The company operates through two primary segments: Advanced Process Solutions and Molding Technology Solutions. Hillenbrand's portfolio serves large end markets, including durable plastics, food, and recycling.
The Advanced Process Solutions segment is a provider of highly-engineered process and material handling equipment, systems, and aftermarket parts and services. Technologies within this segment include compounding, extrusion, material handling, conveying, mixing, ingredient automation, portion process, and screening and separating equipment. Advanced Process Solutions has global presence, with a significant portion of its revenue coming from outside the United States.
The Molding Technology Solutions segment is a leader in highly-engineered equipment, systems, and aftermarket parts and service for the plastic technology processing industry. This segment offers a product portfolio that includes injection molding and extrusion equipment, hot runner systems, process control systems, mold bases, and components. Molding Technology Solutions serves a diverse customer base across various end markets, including automotive, consumer goods, packaging, and electronics.
The company has a history of acquisitions that have expanded its technological capabilities, product offerings, and geographical presence. Recent notable acquisitions include Schenck Process Food and Performance Materials, Peerless Food Equipment, LINXIS Group, Herbold Meckesheim, and Gabler Engineering. These acquisitions have strengthened Hillenbrand's position in markets such as food processing and recycling.
4. General Industrial Machinery
Automation that increases efficiency and connected equipment that collects analyzable data have been trending, creating new demand for general industrial machinery companies. Those who innovate and create digitized solutions can spur sales and speed up replacement cycles, but all general industrial machinery companies are still at the whim of economic cycles. Consumer spending and interest rates, for example, can greatly impact the industrial production that drives demand for these companies’ offerings.
Competitors offering similar products include Matthews (NASDAQ:MATW), EnPro (NYSE:NPO), and Valmont (NYSE:VMI)
5. Revenue Growth
A company’s long-term performance is an indicator of its overall quality. Any business can have short-term success, but a top-tier one grows for years. Regrettably, Hillenbrand’s sales grew at a weak 1.2% compounded annual growth rate over the last five years. This was below our standards and is a tough starting point for our analysis.
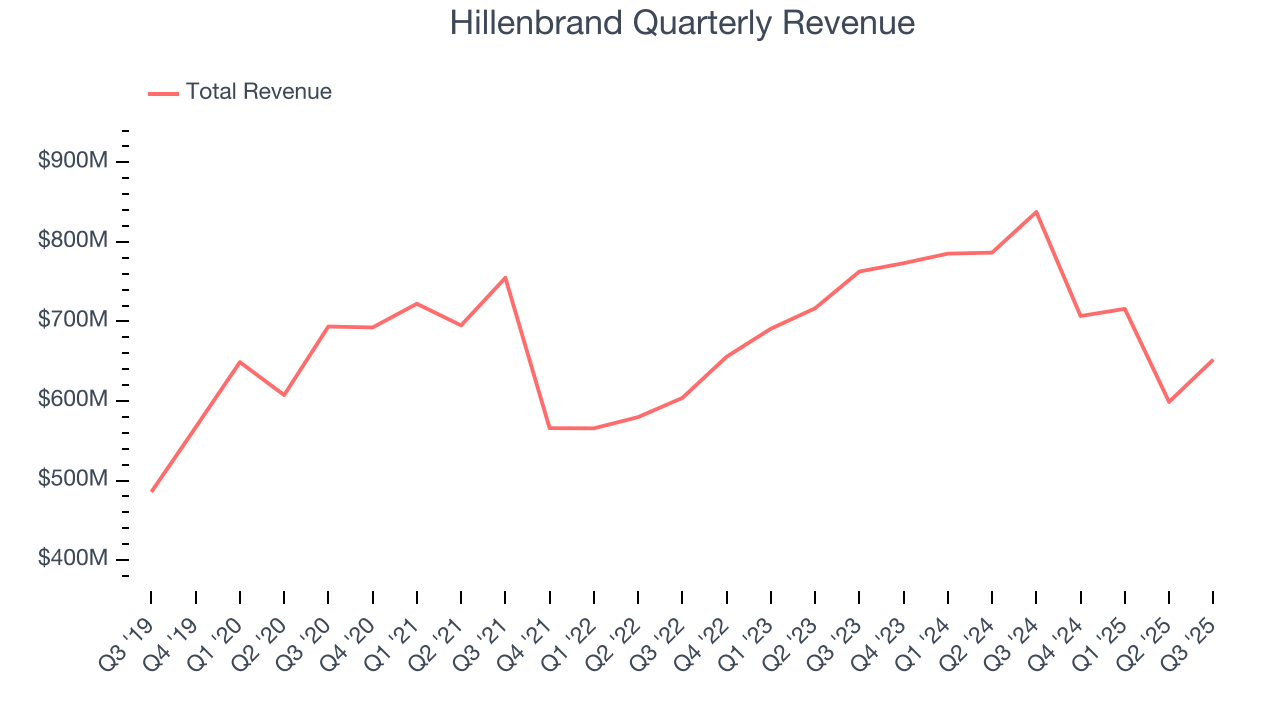
Long-term growth is the most important, but within industrials, a half-decade historical view may miss new industry trends or demand cycles. Hillenbrand’s performance shows it grew in the past but relinquished its gains over the last two years, as its revenue fell by 2.7% annually. 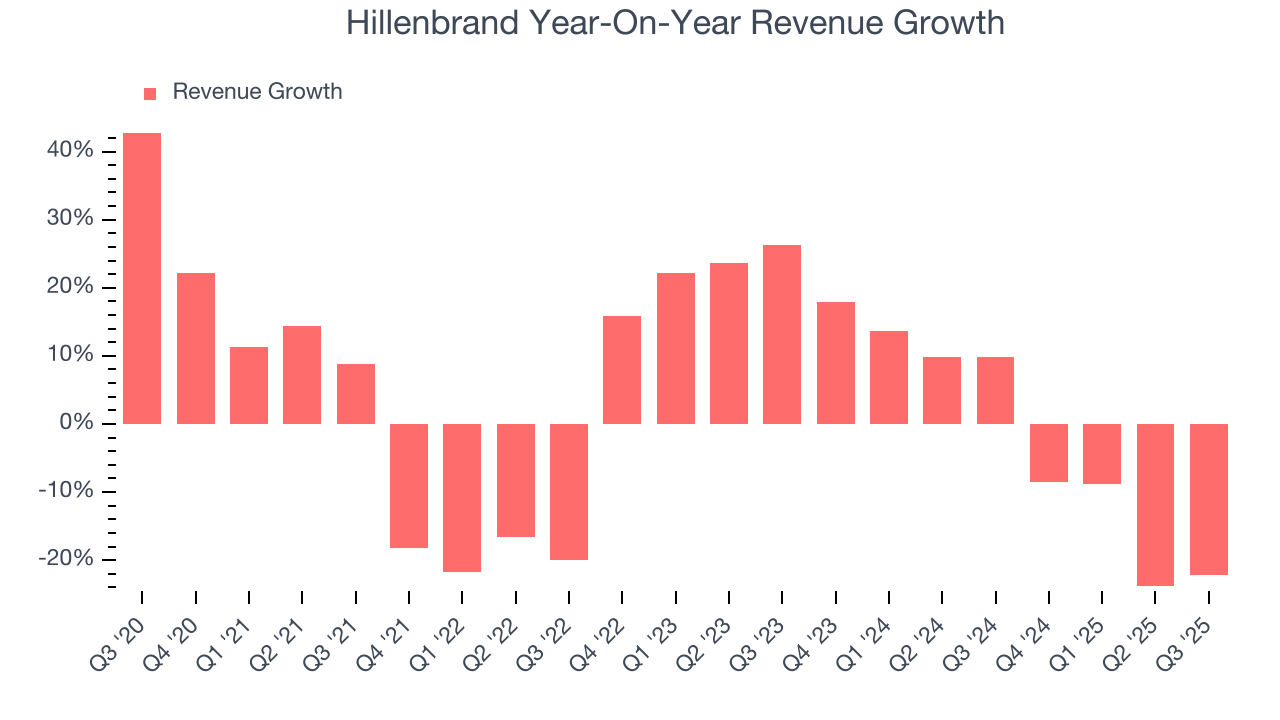
This quarter, Hillenbrand’s revenue fell by 22.1% year on year to $652.1 million but beat Wall Street’s estimates by 9.8%.
Looking ahead, sell-side analysts expect revenue to decline by 7.5% over the next 12 months, a deceleration versus the last two years. This projection is underwhelming and indicates its products and services will see some demand headwinds.
6. Gross Margin & Pricing Power
For industrials businesses, cost of sales is usually comprised of the direct labor, raw materials, and supplies needed to offer a product or service. These costs can be impacted by inflation and supply chain dynamics in the short term and a company’s purchasing power and scale over the long term.
Hillenbrand’s gross margin is good compared to other industrials businesses and signals it sells differentiated products, not commodities. As you can see below, it averaged an impressive 34% gross margin over the last five years. Said differently, Hillenbrand paid its suppliers $66.01 for every $100 in revenue. 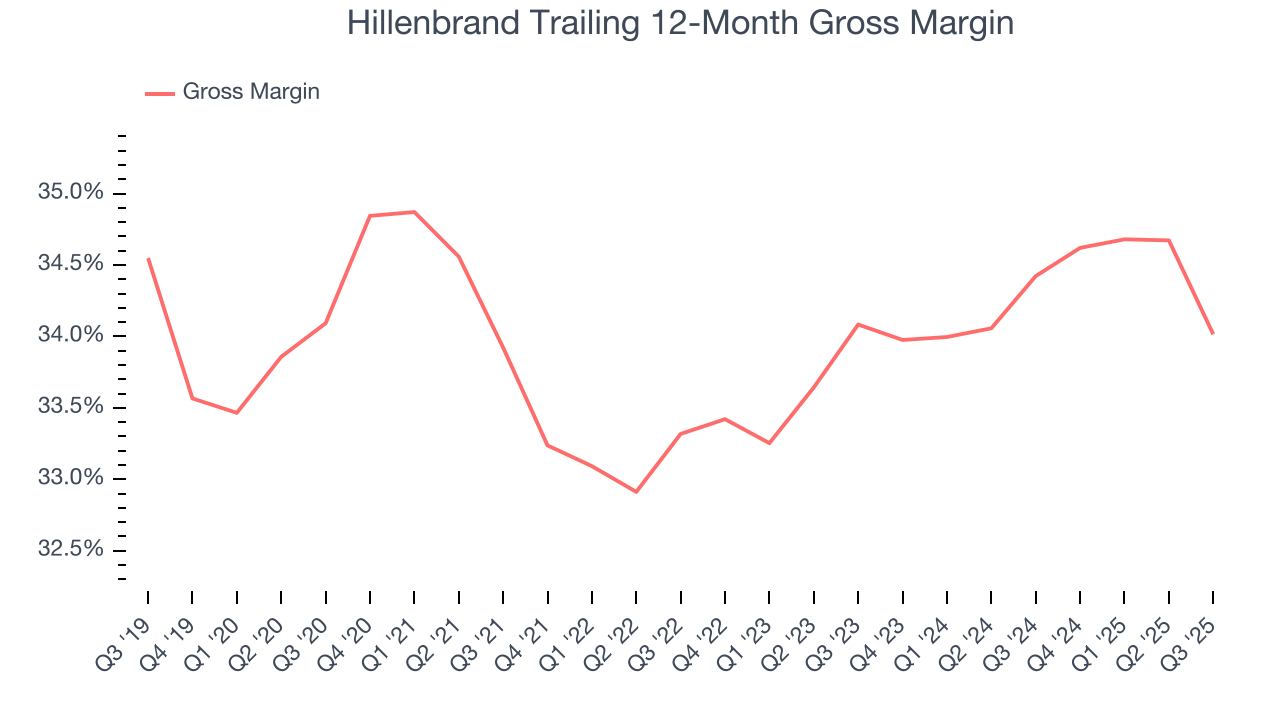
Hillenbrand’s gross profit margin came in at 34.8% this quarter, down 2.1 percentage points year on year. On a wider time horizon, the company’s full-year margin has remained steady over the past four quarters, suggesting its input costs (such as raw materials and manufacturing expenses) have been stable and it isn’t under pressure to lower prices.
7. Operating Margin
Operating margin is an important measure of profitability as it shows the portion of revenue left after accounting for all core expenses – everything from the cost of goods sold to advertising and wages. It’s also useful for comparing profitability across companies with different levels of debt and tax rates because it excludes interest and taxes.
Hillenbrand has been an efficient company over the last five years. It was one of the more profitable businesses in the industrials sector, boasting an average operating margin of 12.4%. This result isn’t too surprising as its gross margin gives it a favorable starting point.
Looking at the trend in its profitability, Hillenbrand’s operating margin decreased by 5.5 percentage points over the last five years. This raises questions about the company’s expense base because its revenue growth should have given it leverage on its fixed costs, resulting in better economies of scale and profitability.
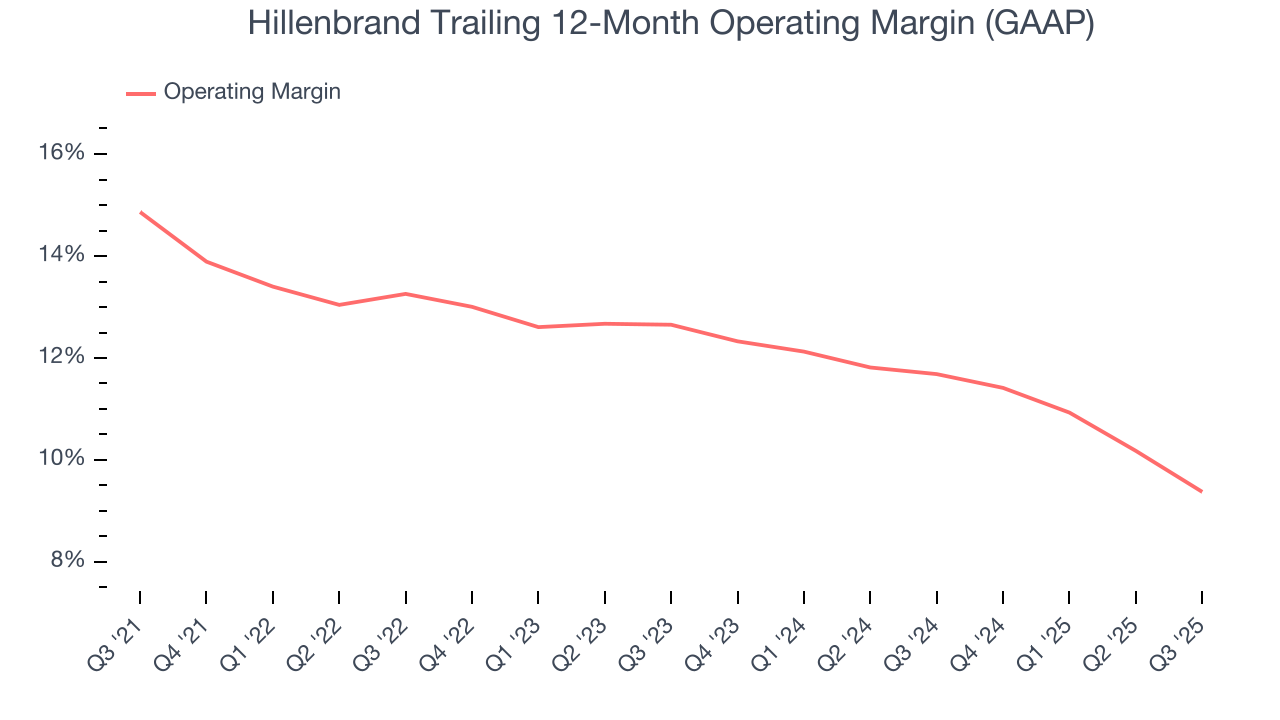
In Q3, Hillenbrand generated an operating margin profit margin of 12.3%, down 2.1 percentage points year on year. Since Hillenbrand’s operating margin decreased more than its gross margin, we can assume it was less efficient because expenses such as marketing, R&D, and administrative overhead increased.
8. Earnings Per Share
We track the long-term change in earnings per share (EPS) for the same reason as long-term revenue growth. Compared to revenue, however, EPS highlights whether a company’s growth is profitable.
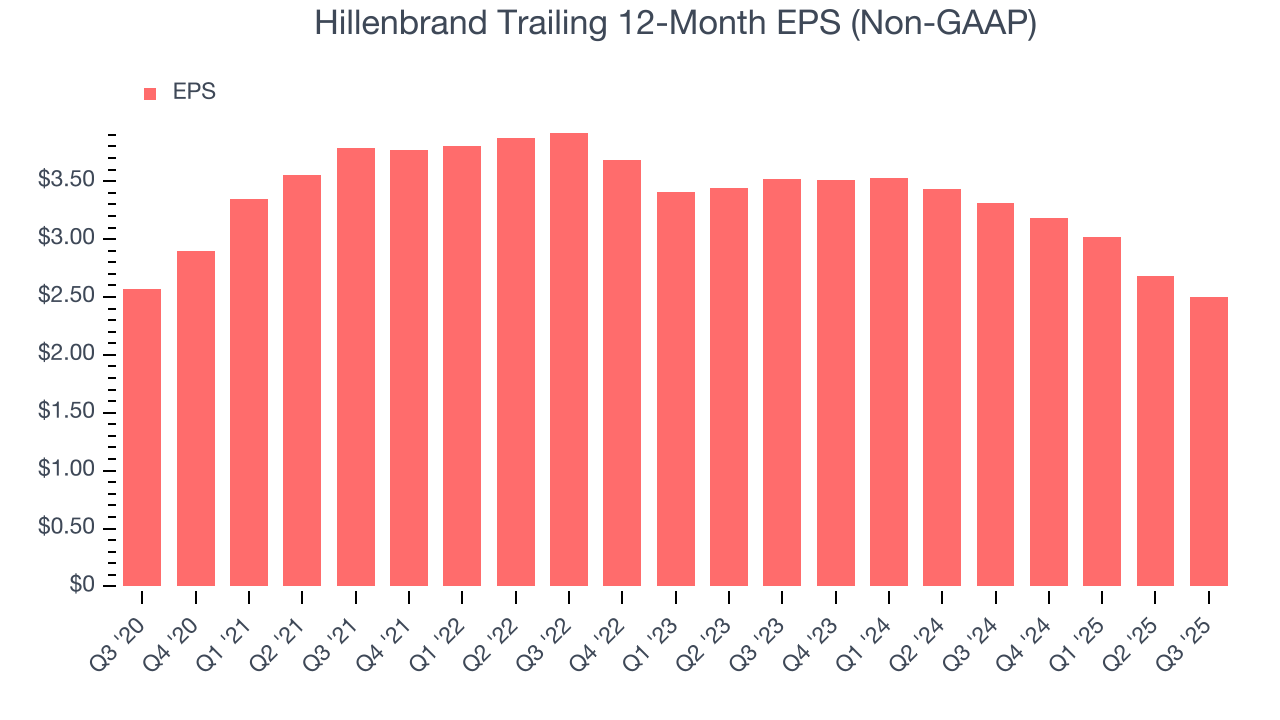
Hillenbrand’s flat EPS over the last five years was below its 1.2% annualized revenue growth. This tells us the company became less profitable on a per-share basis as it expanded due to non-fundamental factors such as interest expenses and taxes.
Like with revenue, we analyze EPS over a shorter period to see if we are missing a change in the business.
Hillenbrand’s two-year annual EPS declines of 15.7% were bad and lower than its two-year revenue losses.
We can take a deeper look into Hillenbrand’s earnings to better understand the drivers of its performance. Hillenbrand’s operating margin has declined over the last two years. This was the most relevant factor (aside from the revenue impact) behind its lower earnings; interest expenses and taxes can also affect EPS but don’t tell us as much about a company’s fundamentals.
In Q3, Hillenbrand reported adjusted EPS of $0.83, down from $1.01 in the same quarter last year. Despite falling year on year, this print easily cleared analysts’ estimates. Over the next 12 months, Wall Street expects Hillenbrand’s full-year EPS of $2.50 to grow 2.8%.
9. Cash Is King
Free cash flow isn't a prominently featured metric in company financials and earnings releases, but we think it's telling because it accounts for all operating and capital expenses, making it tough to manipulate. Cash is king.
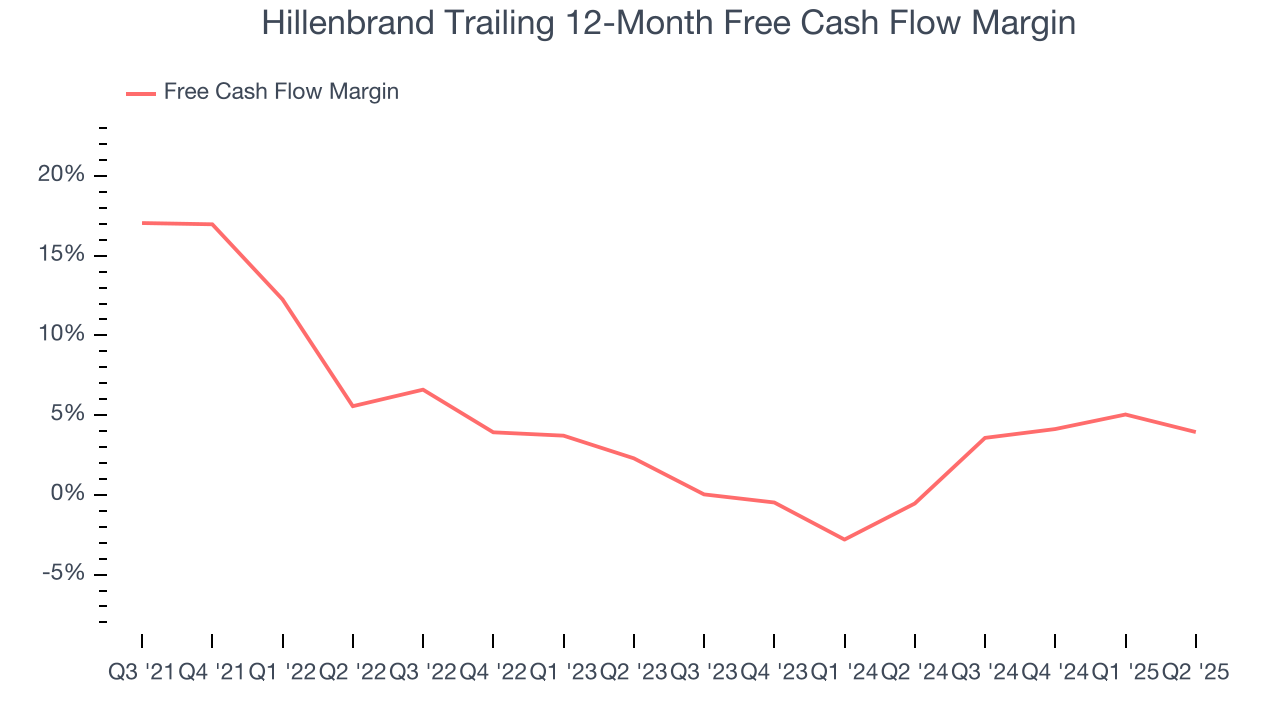
Hillenbrand has shown mediocre cash profitability over the last five years, giving the company limited opportunities to return capital to shareholders. Its free cash flow margin averaged 5.4%, subpar for an industrials business. The divergence from its good operating margin stems from its capital-intensive business model, which requires Hillenbrand to make large cash investments in working capital and capital expenditures.
Taking a step back, we can see that Hillenbrand’s margin dropped by 22 percentage points during that time. This along with its unexciting margin put the company in a tough spot, and shareholders are likely hoping it can reverse course. If the trend continues, it could signal it’s becoming a more capital-intensive business.
10. Return on Invested Capital (ROIC)
EPS and free cash flow tell us whether a company was profitable while growing its revenue. But was it capital-efficient? A company’s ROIC explains this by showing how much operating profit it makes compared to the money it has raised (debt and equity).
Hillenbrand’s management team makes decent investment decisions and generates value for shareholders. Its five-year average ROIC was 10.9%, slightly better than typical industrials business.
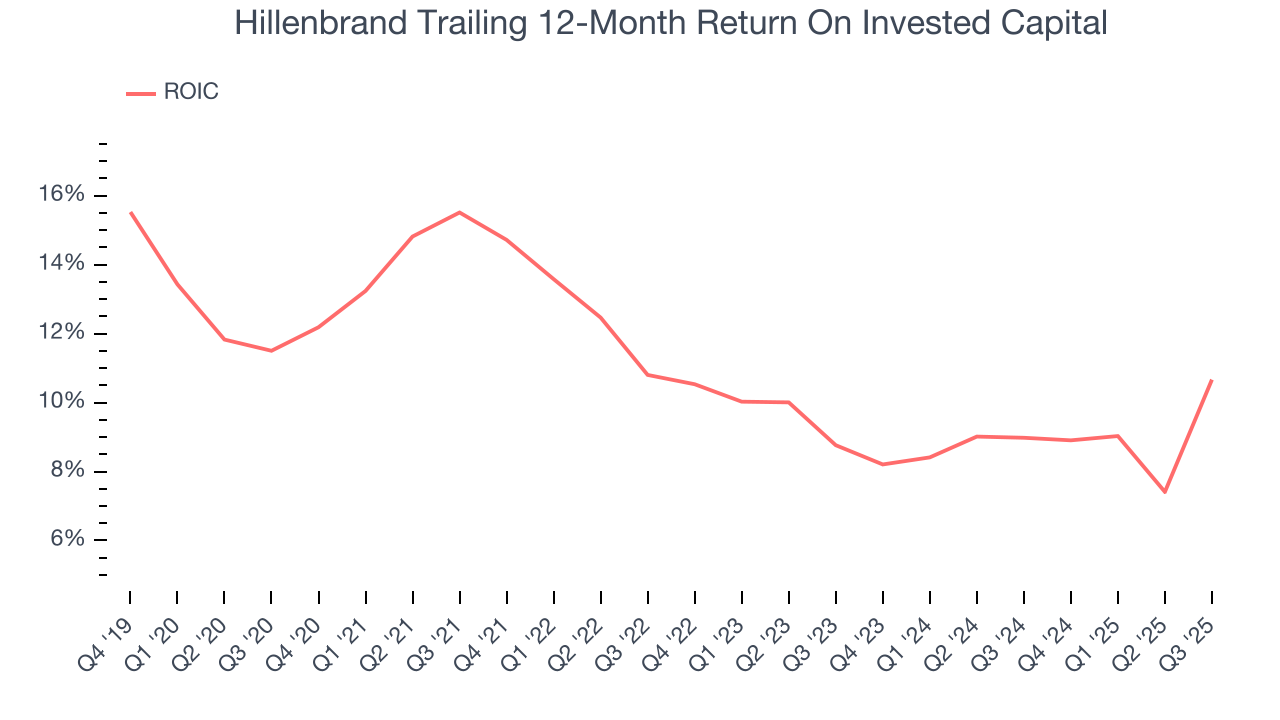
We like to invest in businesses with high returns, but the trend in a company’s ROIC is what often surprises the market and moves the stock price. On average, Hillenbrand’s ROIC decreased by 3.3 percentage points annually over the last few years. We like what management has done in the past, but its declining returns are perhaps a symptom of fewer profitable growth opportunities.
11. Balance Sheet Assessment
Hillenbrand reported $164.8 million of cash and $1.52 billion of debt on its balance sheet in the most recent quarter. As investors in high-quality companies, we primarily focus on two things: 1) that a company’s debt level isn’t too high and 2) that its interest payments are not excessively burdening the business.
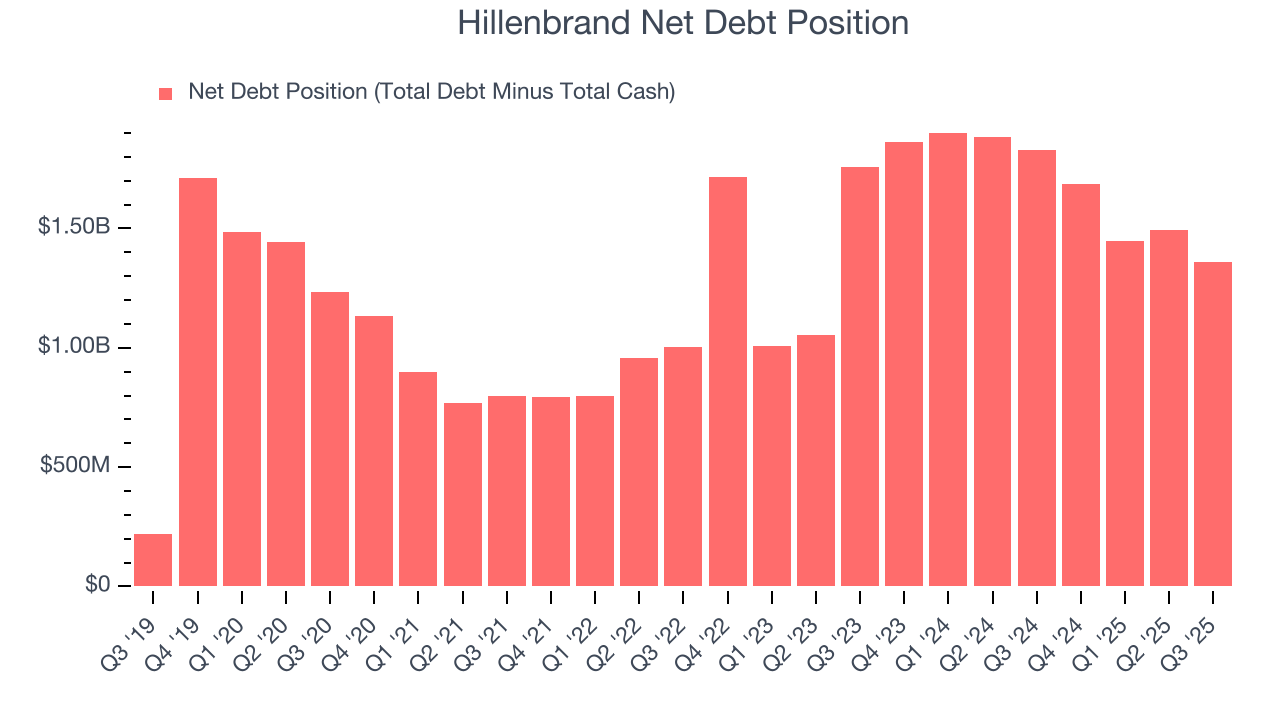
With $388.1 million of EBITDA over the last 12 months, we view Hillenbrand’s 3.5× net-debt-to-EBITDA ratio as safe. We also see its $44.7 million of annual interest expenses as appropriate. The company’s profits give it plenty of breathing room, allowing it to continue investing in growth initiatives.
12. Key Takeaways from Hillenbrand’s Q3 Results
It was good to see Hillenbrand beat analysts’ EPS expectations this quarter. We were also excited its EBITDA outperformed Wall Street’s estimates by a wide margin. Zooming out, we think this quarter featured some important positives. The stock remained flat at $31.64 immediately following the results.
13. Is Now The Time To Buy Hillenbrand?
Updated: January 23, 2026 at 10:24 PM EST
Before investing in or passing on Hillenbrand, we urge you to understand the company’s business quality (or lack thereof), valuation, and the latest quarterly results - in that order.
Hillenbrand doesn’t pass our quality test. First off, its revenue growth was weak over the last five years, and analysts expect its demand to deteriorate over the next 12 months. And while its sturdy operating margins show it has disciplined cost controls, the downside is its weak EPS growth over the last five years shows it’s failed to produce meaningful profits for shareholders. On top of that, its declining operating margin shows the business has become less efficient.
Hillenbrand’s P/E ratio based on the next 12 months is 12.4x. This valuation multiple is fair, but we don’t have much confidence in the company. There are more exciting stocks to buy at the moment.
Wall Street analysts have a consensus one-year price target of $32 on the company (compared to the current share price of $31.89).