
Hartford (HIG)
Hartford doesn’t excite us. Its sluggish sales growth shows demand is soft, a worrisome sign for investors in high-quality stocks.― StockStory Analyst Team
1. News

2. Summary
Why Hartford Is Not Exciting
Recognizable by its iconic stag logo that dates back to 1810, The Hartford (NYSE:HIG) provides property and casualty insurance, group benefits, and investment products to individuals and businesses across the United States.
- Estimated sales decline of 28.6% for the next 12 months implies a challenging demand environment
- Sizable asset base leads to capital growth challenges as its 5.8% annual book value per share increases over the last five years fell short of other insurance companies
- A consolation is that its expected book value per share growth of 22% for the next year suggests its capital position will strengthen considerably


Hartford’s quality is inadequate. We’re looking for better stocks elsewhere.
Why There Are Better Opportunities Than Hartford


Hartford is trading at $131.64 per share, or 2x forward P/B. This multiple is higher than most insurance companies, and we think it’s quite expensive for the weaker revenue growth you get.
There are stocks out there featuring similar valuation multiples with better fundamentals. We prefer to invest in those.
3. Hartford (HIG) Research Report: Q4 CY2025 Update
Insurance and financial services company The Hartford (NYSE:HIG) reported Q4 CY2025 results beating Wall Street’s revenue expectations, with sales up 6.7% year on year to $7.34 billion. Its non-GAAP profit of $4.06 per share was 26.2% above analysts’ consensus estimates.
Hartford (HIG) Q4 CY2025 Highlights:
- Net Premiums Earned: $6.14 billion vs analyst estimates of $4.54 billion (flat year on year, 35.2% beat)
- Revenue: $7.34 billion vs analyst estimates of $4.90 billion (6.7% year-on-year growth, 49.9% beat)
- Combined Ratio: 87.1% vs analyst estimates of 91.7% (460 basis point beat)
- Adjusted EPS: $4.06 vs analyst estimates of $3.22 (26.2% beat)
- Book Value per Share: $66.31 vs analyst estimates of $73.18 (18.3% year-on-year growth, 9.4% miss)
- Market Capitalization: $36.41 billion
Company Overview
Recognizable by its iconic stag logo that dates back to 1810, The Hartford (NYSE:HIG) provides property and casualty insurance, group benefits, and investment products to individuals and businesses across the United States.
The Hartford operates through five main business segments. Its Commercial Lines segment offers a range of insurance products to businesses of all sizes, including property, liability, workers' compensation, automobile, and specialty coverage. The company serves small businesses through its Spectrum package policies, while providing tailored solutions for medium and large enterprises, including specialized programs and loss-sensitive options.
The Personal Lines segment primarily focuses on automobile and homeowners insurance, with a significant portion of this business coming through an exclusive licensing arrangement with AARP that extends through 2032. This partnership gives The Hartford a competitive advantage in serving the growing over-50 demographic.
Through its Group Benefits segment, The Hartford provides employers with group life and disability insurance, leave management services, and voluntary benefits like critical illness and accident coverage. The company has positioned itself to capitalize on the growing trend of state-mandated paid family leave programs by offering both fully insured and administrative solutions.
Hartford Funds, another segment, manages approximately 60 actively managed mutual funds and various ETFs across different asset classes, distributed through broker-dealers, financial advisors, and other channels. The company's investment operations are managed by Hartford Investment Management Company (HIMCO), which develops customized investment strategies.
The Hartford's distribution strategy varies by segment, utilizing independent agents, brokers, direct-to-consumer channels, and partnerships with organizations like AARP to reach customers. The company has invested significantly in digital capabilities to enhance customer experience and strengthen its competitive position in the marketplace.
4. Multi-Line Insurance
Multi-line insurance companies operate a diversified business model, offering a broad suite of products that span both Property & Casualty (P&C) and Life & Health (L&H) insurance. This diversification allows them to generate revenue from multiple, often uncorrelated, underwriting pools while also earning investment income on their combined float. Interest rates matter for the sector (and make it cyclical), with higher rates allowing insurers to reinvest their fixed-income portfolios at more attractive yields and vice versa. The market environment also matters for P&C operations specifically, with a 'hard market' characterized by pricing increases that outstrip claim costs, resulting in higher profits while a 'soft market' is the opposite. On the other hand, a key headwind is increasing volatility and severity of catastrophe losses, driven by climate change, which poses a significant threat to P&C underwriting results.
The Hartford competes with major property and casualty insurers like Travelers (NYSE:TRV), Chubb (NYSE:CB), and Progressive (NYSE:PGR). In the group benefits space, its competitors include MetLife (NYSE:MET), Prudential Financial (NYSE:PRU), and Unum Group (NYSE:UNM), while Hartford Funds competes with asset managers such as BlackRock (NYSE:BLK) and Vanguard.
5. Revenue Growth
Insurance companies earn revenue from three primary sources: 1) The core insurance business itself, often called underwriting and represented in the income statement as premiums 2) Income from investing the “float” (premiums collected upfront not yet paid out as claims) in assets such as fixed-income assets and equities 3) Fees from various sources such as policy administration, annuities, or other value-added services. Over the last five years, Hartford grew its revenue at a mediocre 6.7% compounded annual growth rate. This was below our standard for the insurance sector and is a poor baseline for our analysis.
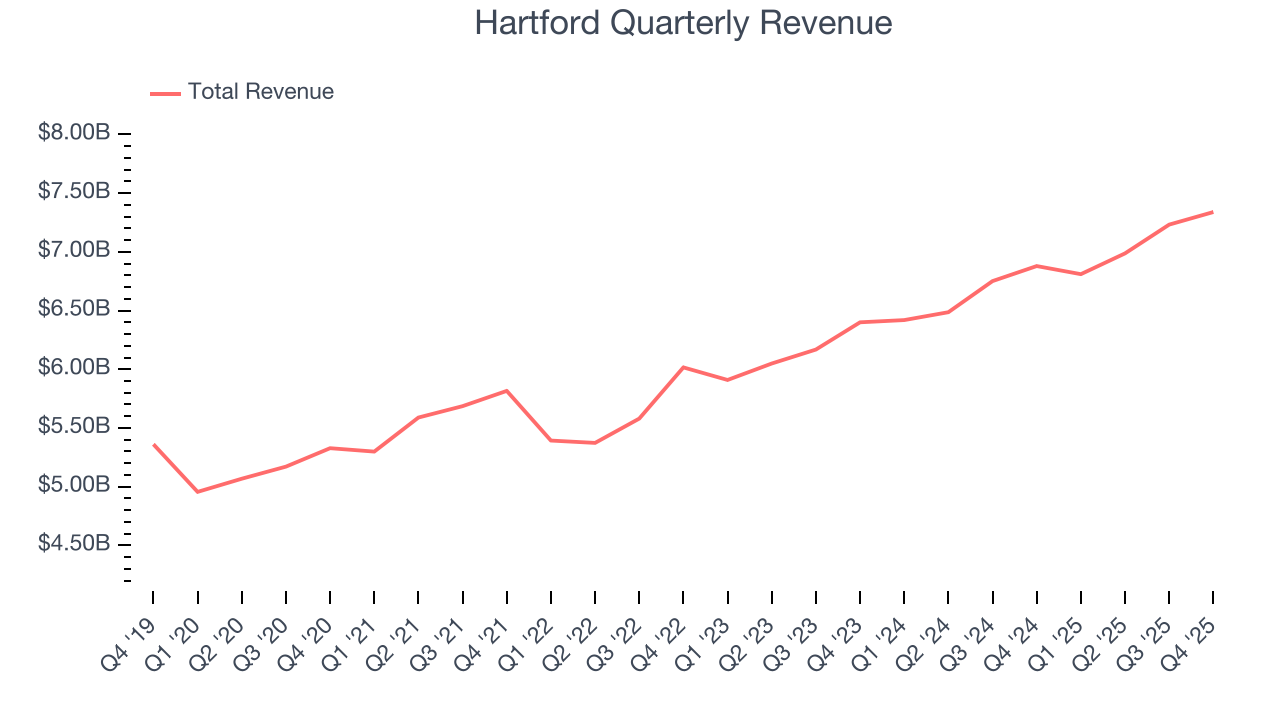
We at StockStory place the most emphasis on long-term growth, but within financials, a half-decade historical view may miss recent interest rate changes, market returns, and industry trends. Hartford’s annualized revenue growth of 7.5% over the last two years aligns with its five-year trend, suggesting its demand was stable. 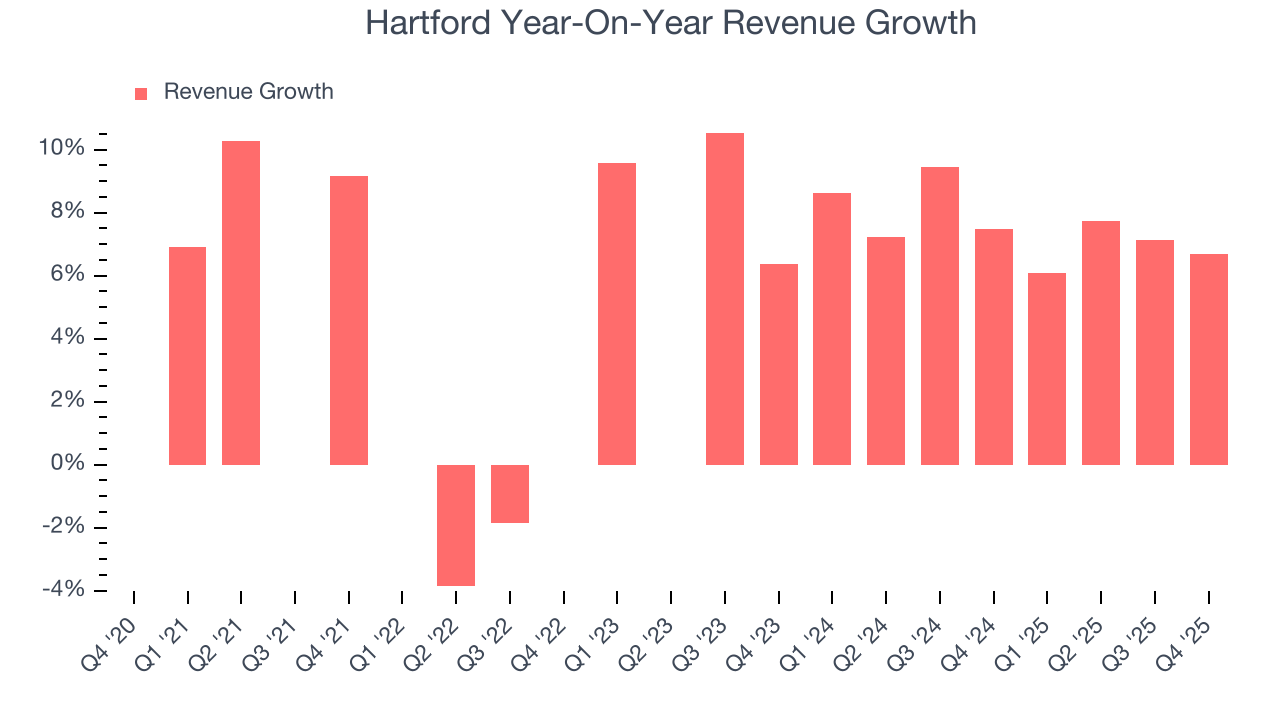 Note: Quarters not shown were determined to be outliers, impacted by outsized investment gains/losses that are not indicative of the recurring fundamentals of the business.
This quarter, Hartford reported year-on-year revenue growth of 6.7%, and its $7.34 billion of revenue exceeded Wall Street’s estimates by 49.9%.
Net premiums earned made up 89.8% of the company’s total revenue during the last five years, meaning Hartford barely relies on non-insurance activities to drive its overall growth.
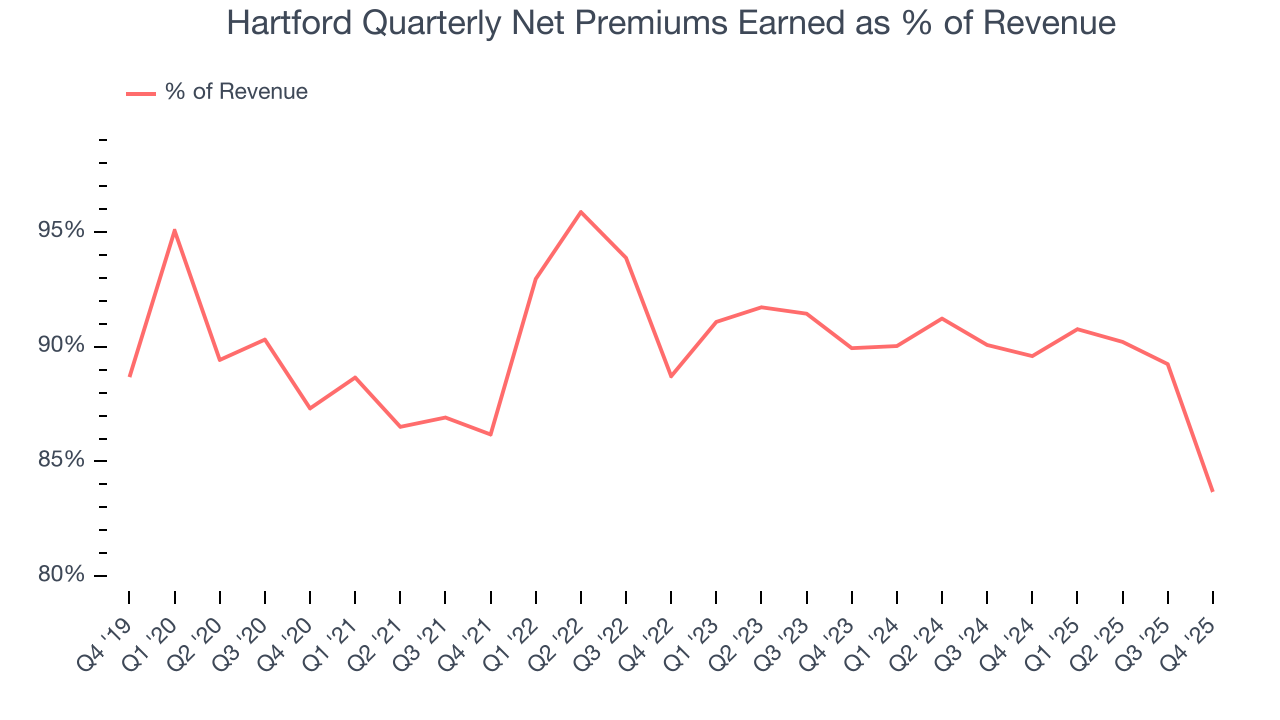
Our experience and research show the market cares primarily about an insurer’s net premiums earned growth as investment and fee income are considered more susceptible to market volatility and economic cycles.
6. Net Premiums Earned
When insurers sell policies, they protect themselves from extremely large losses or an outsized accumulation of losses with reinsurance (insurance for insurance companies). Net premiums earned are:
- Gross premiums - what’s ceded to reinsurers as a risk mitigation and transfer strategy
Hartford’s net premiums earned has grown at a 6.2% annualized rate over the last five years, slightly worse than the broader insurance industry and in line with its total revenue.
When analyzing Hartford’s net premiums earned over the last two years, we can paint a similar picture as it recorded an annual growth rate of 6%. Since two-year net premiums earned grew slower than total revenue over this period, it’s implied that other line items such as investment income grew at a faster rate. These extra revenue streams are important to the bottom line, yet their performance can be inconsistent. Some firms have been more successful and consistent in managing their float, but sharp fluctuations in the fixed income and equity markets can dramatically affect short-term results.
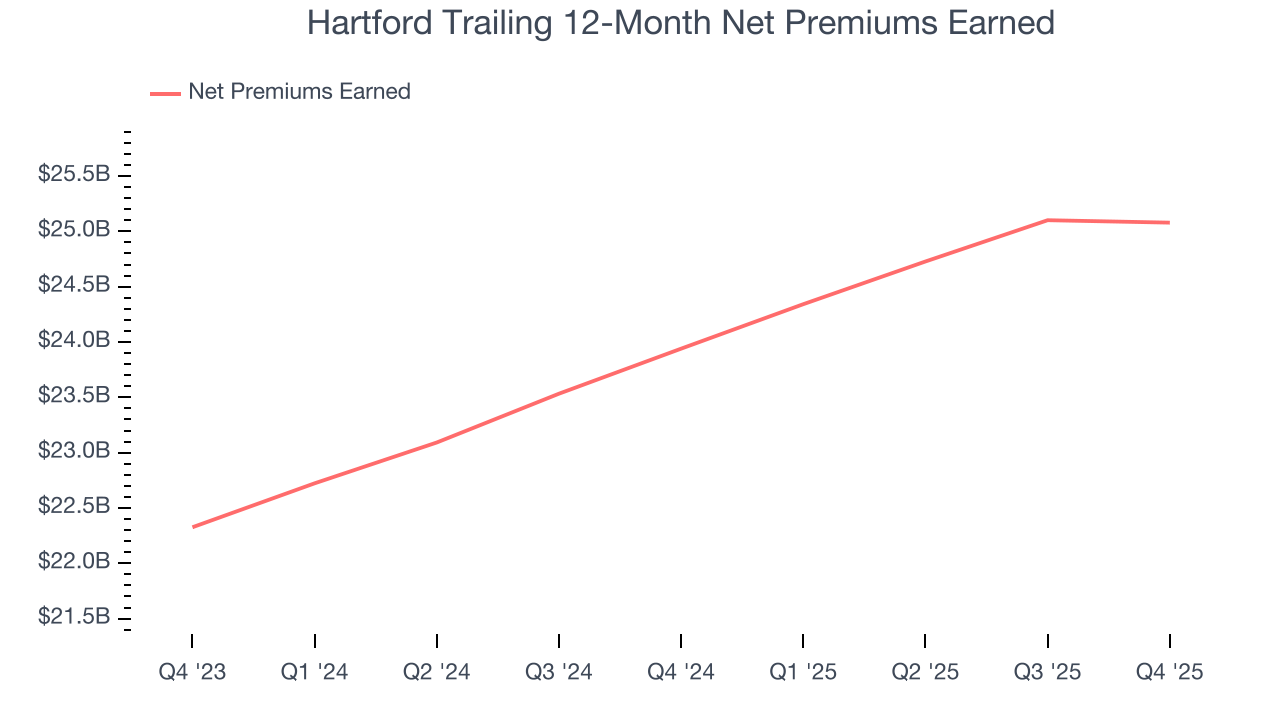
Hartford produced $6.14 billion of net premiums earned in Q4, flat year on year. But this was still enough to top Wall Street Consensus estimates by 35.2%.
7. Combined Ratio
Revenue growth is one major determinant of business quality, and the efficiency of operations is another. For insurance companies, we look at the combined ratio rather than the operating expenses and margins that define sectors such as consumer, tech, and industrials.
The combined ratio sums the costs of underwriting (salaries, commissions, overhead) as well as what an insurer pays out in claims (losses) and divides it by net premiums earned. If a company boasts a combined ratio under 100%, it is underwriting profitably. If above 100%, it is losing money on its core operations of selling insurance policies.
Given the calculation, a lower expense ratio is better. Over the last four years, Hartford’s combined ratio has swelled by 7.4 percentage points, going from 97.8% to 90.4%. However, fixed cost leverage was muted more recently as the company’s combined ratio was flat on a two-year basis.
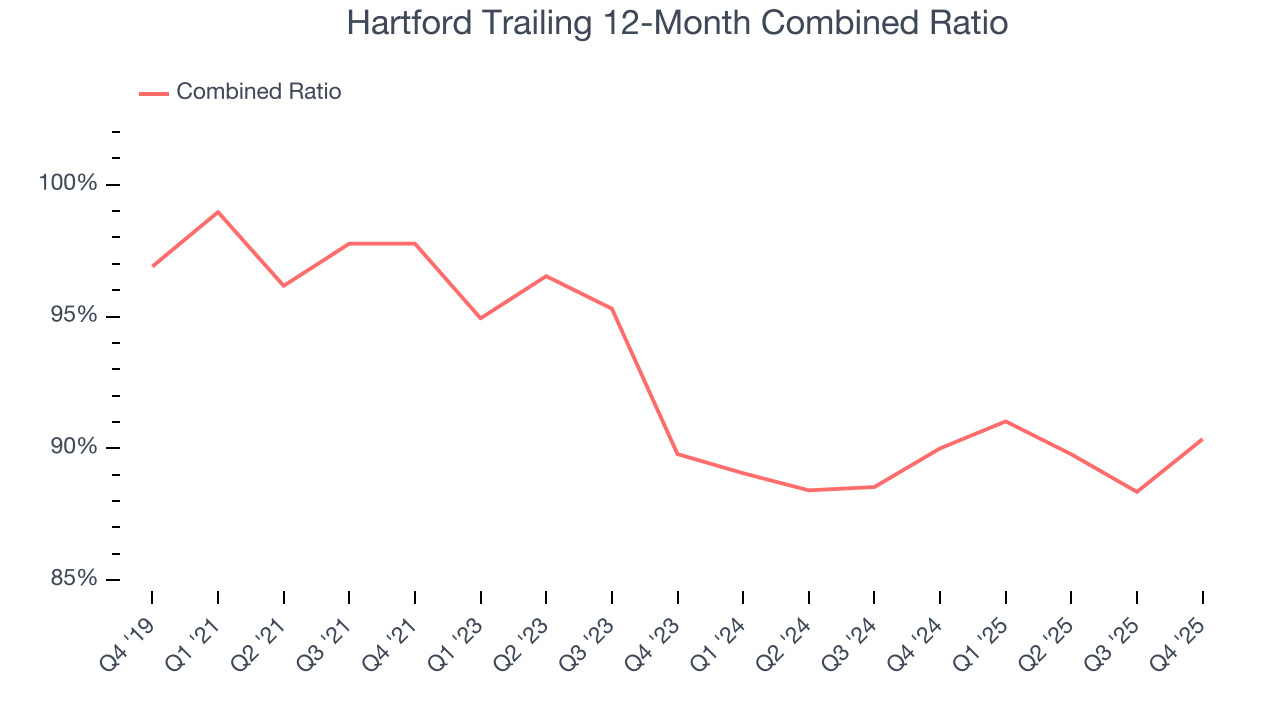
In Q4, Hartford’s combined ratio was 87.1%, beating analysts’ expectations by 460 basis points (100 basis points = 1 percentage point). This result was 8 percentage points worse than the same quarter last year.
8. Earnings Per Share
Revenue trends explain a company’s historical growth, but the long-term change in earnings per share (EPS) points to the profitability of that growth – for example, a company could inflate its sales through excessive spending on advertising and promotions.
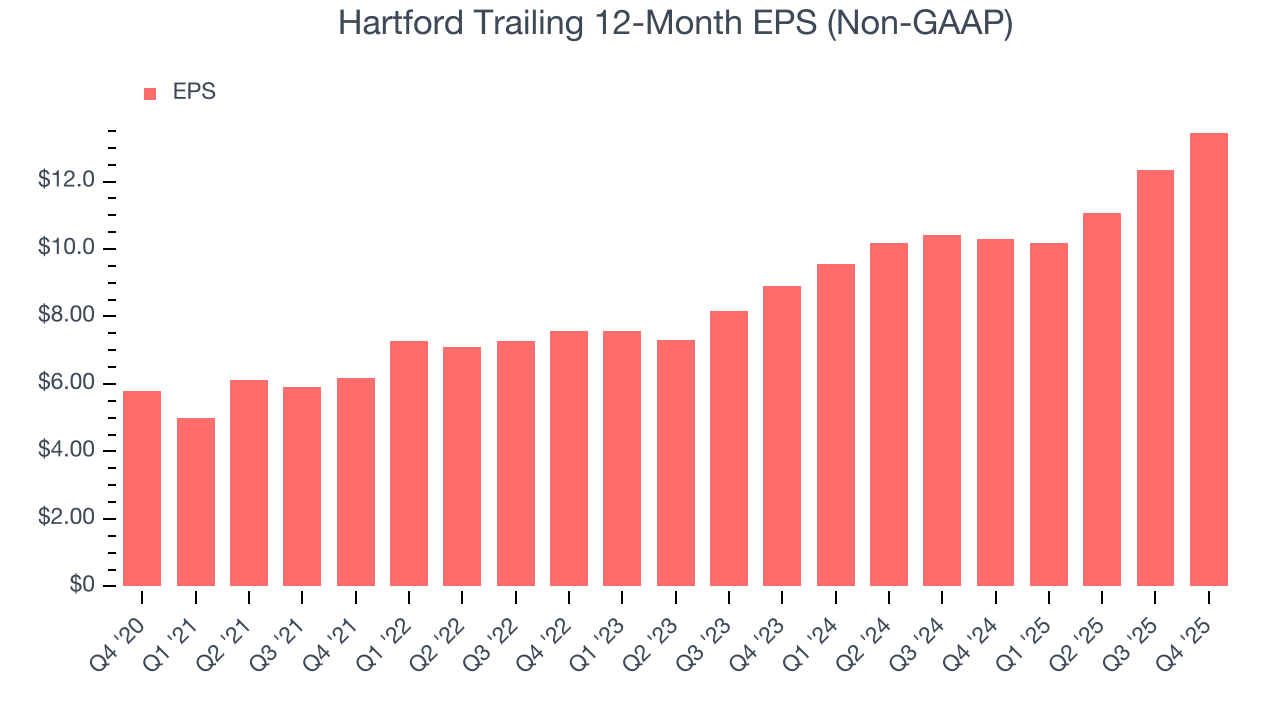
Hartford’s EPS grew at a remarkable 18.4% compounded annual growth rate over the last five years, higher than its 6.7% annualized revenue growth. However, this alone doesn’t tell us much about its business quality because its combined ratio didn’t improve.
Like with revenue, we analyze EPS over a more recent period because it can provide insight into an emerging theme or development for the business.
For Hartford, its two-year annual EPS growth of 22.9% was higher than its five-year trend. We love it when earnings growth accelerates, especially when it accelerates off an already high base.
In Q4, Hartford reported adjusted EPS of $4.06, up from $2.94 in the same quarter last year. This print easily cleared analysts’ estimates, and shareholders should be content with the results. Over the next 12 months, Wall Street expects Hartford’s full-year EPS of $13.45 to shrink by 1.1%.
9. Book Value Per Share (BVPS)
Insurance companies are balance sheet businesses, collecting premiums upfront and paying out claims over time. The float–premiums collected but not yet paid out–are invested, creating an asset base supported by a liability structure. Book value per share (BVPS) captures this dynamic by measuring these assets (investment portfolio, cash, reinsurance recoverables) less liabilities (claim reserves, debt, future policy benefits). BVPS is essentially the residual value for shareholders.
We therefore consider BVPS very important to track for insurers and a metric that sheds light on business quality because it reflects long-term capital growth and is harder to manipulate than more commonly-used metrics like EPS.
Hartford’s BVPS grew at a tepid 5.5% annual clip over the last five years. However, BVPS growth has accelerated recently, growing by 14.9% annually over the last two years from $50.23 to $66.31 per share.
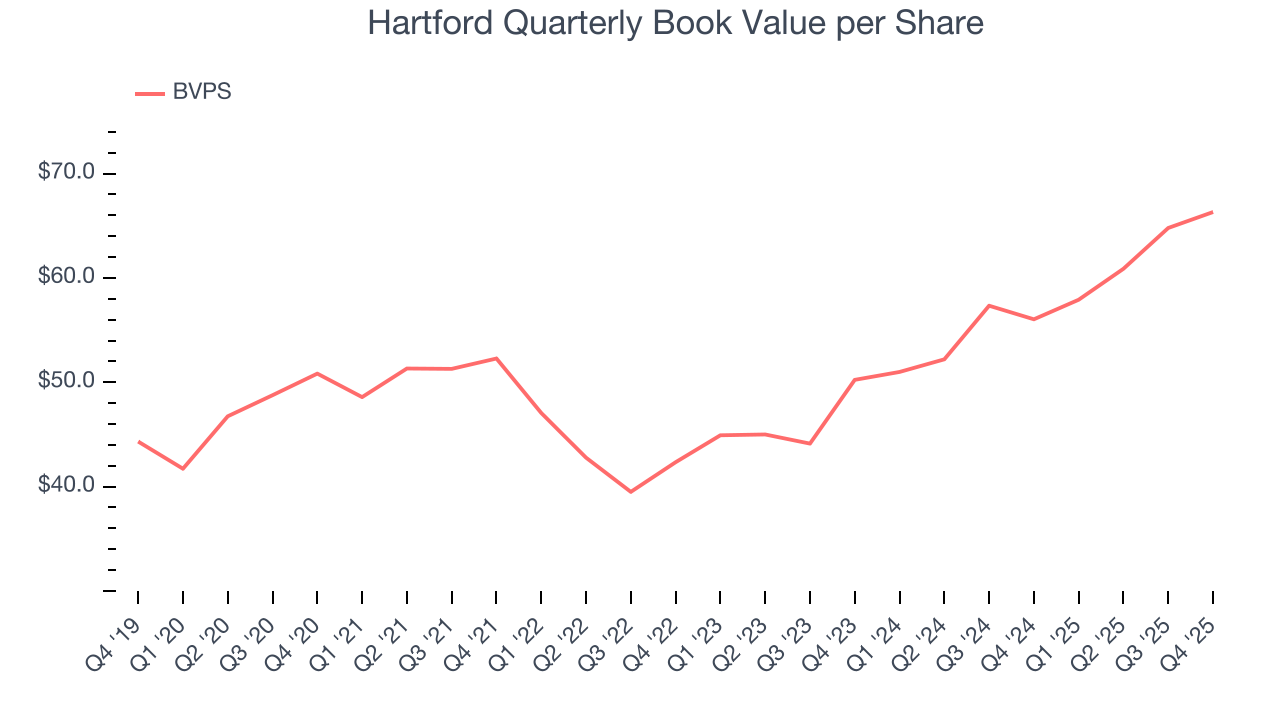
Over the next 12 months, Consensus estimates call for Hartford’s BVPS to grow by 22.2% to $73.18, elite growth rate.
10. Balance Sheet Assessment
The debt-to-equity ratio is a widely used measure to assess a company's balance sheet health. A higher ratio means that a business aggressively financed its growth with debt. This can result in higher earnings (if the borrowed funds are invested profitably) but also increases risk.
If debt levels are too high, there could be difficulties in meeting obligations, especially during economic downturns or periods of rising interest rates if the debt has variable-rate payments.
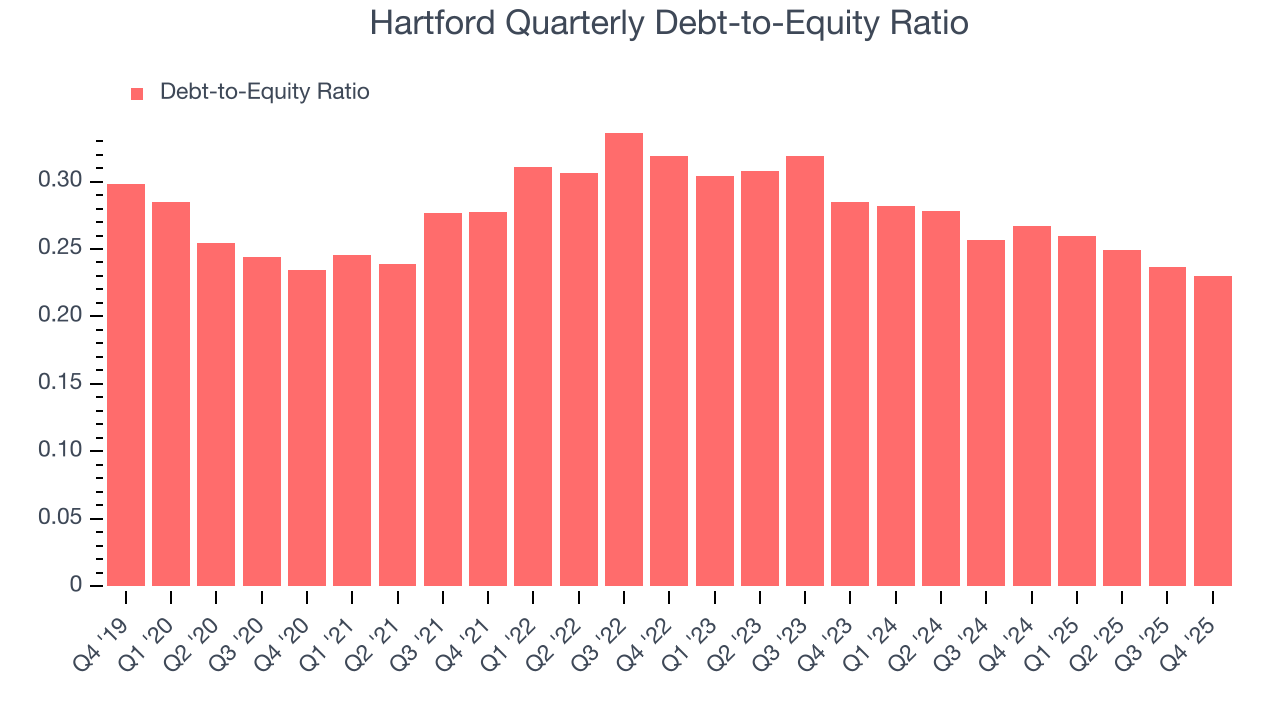
Hartford currently has $4.37 billion of debt and $18.98 billion of shareholder's equity on its balance sheet, and over the past four quarters, has averaged a debt-to-equity ratio of 0.2×. We think this is safe and raises no red flags. In general, we’re comfortable with any ratio below 1.0× for an insurance business. Anything below 0.5× is a bonus.
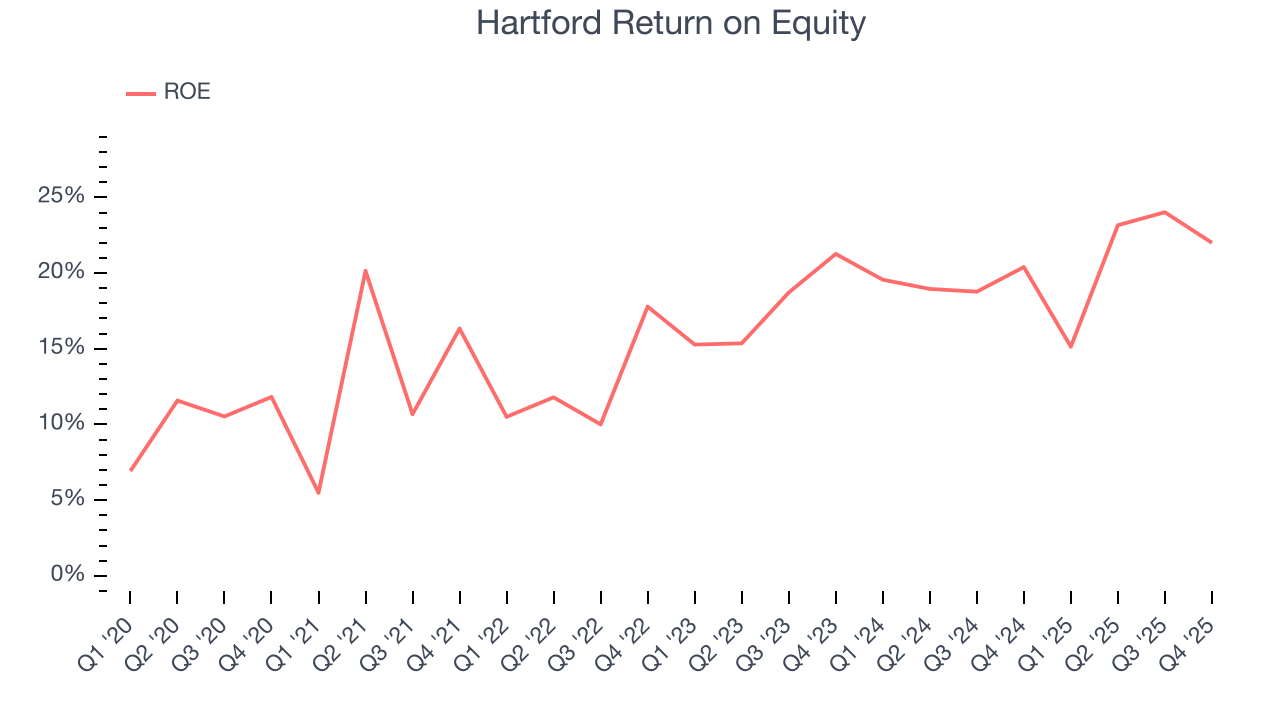
11. Return on Equity
Return on equity, or ROE, represents the ultimate measure of an insurer's effectiveness, quantifying how well it transforms shareholder investments into profits. Over the long term, insurance companies with robust ROE metrics typically deliver superior shareholder returns through a balanced approach to capital management.
Over the last five years, Hartford has averaged an ROE of 16.8%, impressive for a company operating in a sector where the average shakes out around 12.5% and those putting up 20%+ are greatly admired. This is a bright spot for Hartford.
12. Key Takeaways from Hartford’s Q4 Results
It was good to see Hartford beat analysts’ EPS expectations this quarter. We were also excited its net premiums earned outperformed Wall Street’s estimates by a wide margin. On the other hand, its book value per share missed. Overall, we think this was a decent quarter with some key metrics above expectations. Investors were likely hoping for more, and shares traded down 1.2% to $130.78 immediately following the results.
13. Is Now The Time To Buy Hartford?
Updated: January 29, 2026 at 11:47 PM EST
Before deciding whether to buy Hartford or pass, we urge investors to consider business quality, valuation, and the latest quarterly results.
When it comes to Hartford’s business quality, there are some positives, but it ultimately falls short. Although its revenue growth was mediocre over the last five years and analysts expect growth to slow over the next 12 months, its estimated BVPS growth for the next 12 months is great. Investors should tread carefully with this one, however, as Hartford’s projected EPS for the next year is lacking.
Hartford’s P/B ratio based on the next 12 months is 1.8x. This valuation multiple is fair, but we don’t have much faith in the company. We're pretty confident there are more exciting stocks to buy at the moment.
Wall Street analysts have a consensus one-year price target of $146.25 on the company (compared to the current share price of $131.98).