Hubbell (HUBB)
Hubbell is a compelling stock. It consistently invests in attractive growth opportunities, generating substantial cash flows and returns.― StockStory Analyst Team
1. News


2. Summary
Why We Like Hubbell
A respected player in the electrical segment, Hubbell (NYSE:HUBB) manufactures electronic products for the construction, industrial, utility, and telecommunications markets.
- Additional sales over the last five years increased its profitability as the 17.9% annual growth in its earnings per share outpaced its revenue
- ROIC punches in at 26.9%, illustrating management’s expertise in identifying profitable investments, and its rising returns show it’s making even more lucrative bets
- Disciplined cost controls and effective management have materialized in a strong operating margin, and it turbocharged its profits by achieving some fixed cost leverage


We have an affinity for Hubbell. The valuation seems fair relative to its quality, so this could be a prudent time to buy some shares.
Why Is Now The Time To Buy Hubbell?


At $486.95 per share, Hubbell trades at 24.8x forward P/E. This valuation is fair - even cheap depending on how much you like the story - for the quality you get.
Our work shows, time and again, that buying high-quality companies and holding them routinely leads to market outperformance. If you can get an attractive entry price, that’s icing on the cake.
3. Hubbell (HUBB) Research Report: Q3 CY2025 Update
Electrical and electronic products company Hubbell (NYSE:HUBB) fell short of the market’s revenue expectations in Q3 CY2025 as sales rose 4.1% year on year to $1.50 billion. Its non-GAAP profit of $5.17 per share was 3.9% above analysts’ consensus estimates.
Hubbell (HUBB) Q3 CY2025 Highlights:
- Revenue: $1.50 billion vs analyst estimates of $1.53 billion (4.1% year-on-year growth, 1.6% miss)
- Adjusted EPS: $5.17 vs analyst estimates of $4.98 (3.9% beat)
- Adjusted EBITDA: $380 million vs analyst estimates of $388.4 million (25.3% margin, 2.2% miss)
- Management raised its full-year Adjusted EPS guidance to $18.20 at the midpoint, a 1.7% increase
- Operating Margin: 22%, in line with the same quarter last year
- Free Cash Flow Margin: 16.9%, up from 13.1% in the same quarter last year
- Organic Revenue rose 3.2% year on year vs analyst estimates of 5.3% growth (213 basis point miss)
- Market Capitalization: $23.06 billion
Company Overview
A respected player in the electrical segment, Hubbell (NYSE:HUBB) manufactures electronic products for the construction, industrial, utility, and telecommunications markets.
In the construction industry, Hubbell provides wiring devices, lighting fixtures, and electrical components. It also sells a range of robust industrial electrical equipment like heavy-duty connectors, motor controls, and power systems designed to withstand harsh environments for the industrial industry.
The company also manufactures power distribution equipment like transformers and insulators, which are crucial for the generation and transmission of electricity, which are sold to companies in the utility and energy industries. Lastly, Hubell produces fiber optic connectors, enclosures, and structured cabling systems to telecommunications companies.
The bulk of Hubbell’s revenue comes from product sales to companies in their respective sectors, along with its associated maintenance and support services. The company also often engages in large contractual projects, especially with utility and construction companies, to help them with comprehensive start-to-finish solutions. It sells its products through a wide network of distributors, wholesalers, and retailers, as well as directly to large institutional customers.
4. Electrical Systems
Like many equipment and component manufacturers, electrical systems companies are buoyed by secular trends such as connectivity and industrial automation. More specific pockets of strong demand include Internet of Things (IoT) connectivity and the 5G telecom upgrade cycle, which can benefit companies whose cables and conduits fit those needs. But like the broader industrials sector, these companies are also at the whim of economic cycles. Interest rates, for example, can greatly impact projects that drive demand for these products.
Competitors of Hubbell include Eaton (NYSE:ETN), ABB (NYSE:ABB), and Schneider Electric (EPA:SU).
5. Revenue Growth
A company’s long-term performance is an indicator of its overall quality. Any business can experience short-term success, but top-performing ones enjoy sustained growth for years. Over the last five years, Hubbell grew its sales at a decent 8% compounded annual growth rate. Its growth was slightly above the average industrials company and shows its offerings resonate with customers.
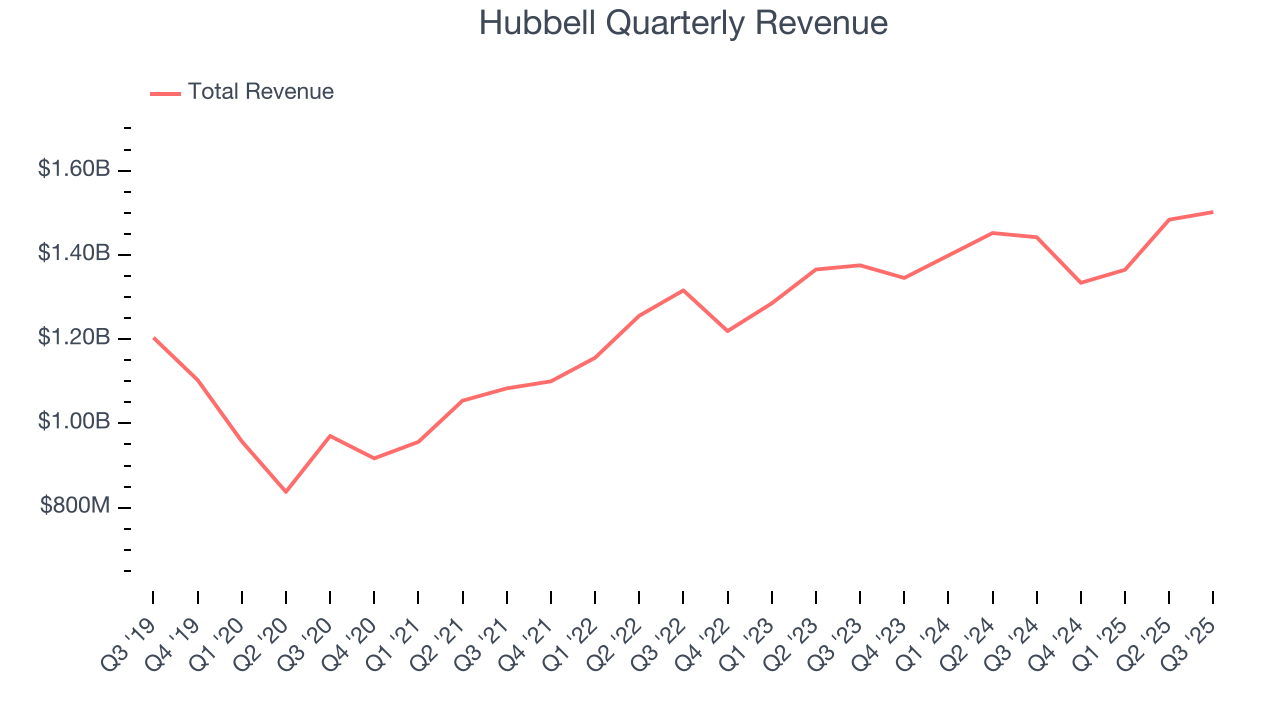
Long-term growth is the most important, but within industrials, a half-decade historical view may miss new industry trends or demand cycles. Hubbell’s recent performance shows its demand has slowed as its annualized revenue growth of 4.1% over the last two years was below its five-year trend. We also note many other Electrical Systems businesses have faced declining sales because of cyclical headwinds. While Hubbell grew slower than we’d like, it did do better than its peers. 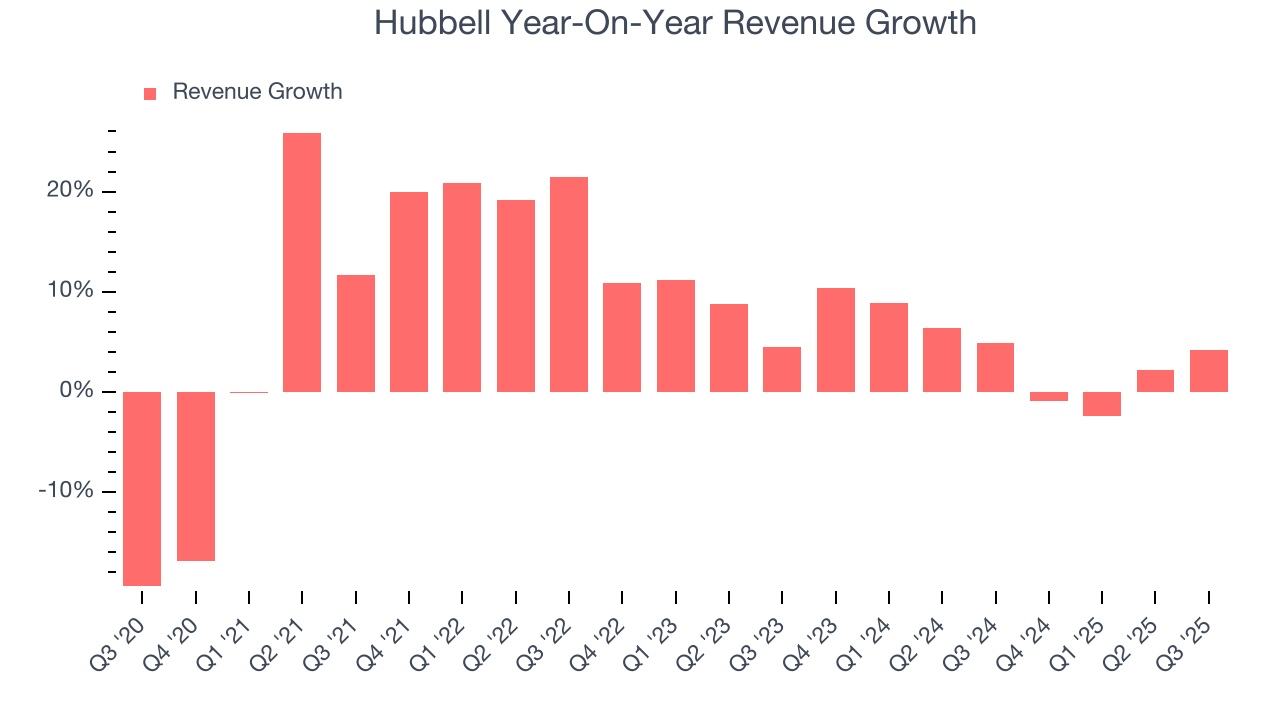
We can better understand the company’s sales dynamics by analyzing its organic revenue, which strips out one-time events like acquisitions and currency fluctuations that don’t accurately reflect its fundamentals. Over the last two years, Hubbell’s organic revenue averaged 1.6% year-on-year growth. Because this number is lower than its two-year revenue growth, we can see that some mixture of acquisitions and foreign exchange rates boosted its headline results. 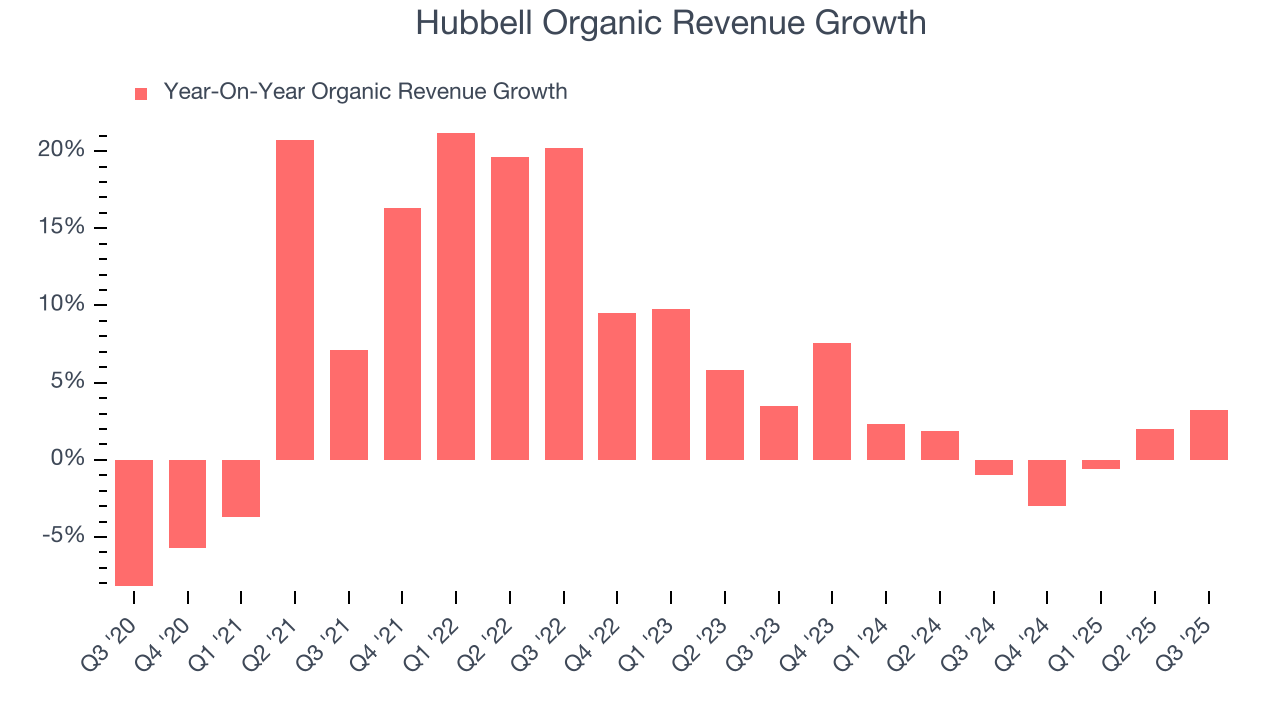
This quarter, Hubbell’s revenue grew by 4.1% year on year to $1.50 billion, falling short of Wall Street’s estimates.
Looking ahead, sell-side analysts expect revenue to grow 8.7% over the next 12 months, an improvement versus the last two years. This projection is above the sector average and implies its newer products and services will fuel better top-line performance.
6. Gross Margin & Pricing Power
Cost of sales for an industrials business is usually comprised of the direct labor, raw materials, and supplies needed to offer a product or service. These costs can be impacted by inflation and supply chain dynamics.
Hubbell’s unit economics are better than the typical industrials business, signaling its products are somewhat differentiated through quality or brand. As you can see below, it averaged a decent 32.4% gross margin over the last five years. That means for every $100 in revenue, roughly $32.45 was left to spend on selling, marketing, R&D, and general administrative overhead. 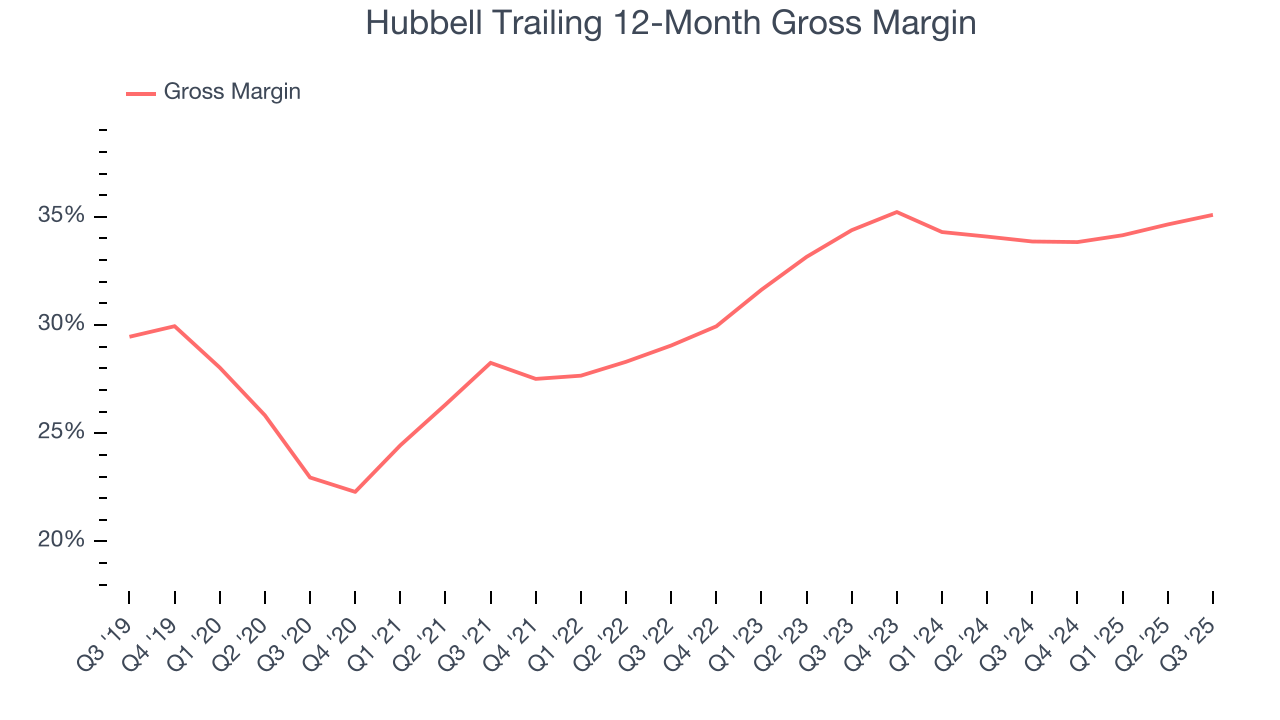
In Q3, Hubbell produced a 36.2% gross profit margin, marking a 1.7 percentage point increase from 34.5% in the same quarter last year. Hubbell’s full-year margin has also been trending up over the past 12 months, increasing by 1.2 percentage points. If this move continues, it could suggest better unit economics due to more leverage from its growing sales on the fixed portion of its cost of goods sold (such as manufacturing expenses).
7. Operating Margin
Operating margin is an important measure of profitability as it shows the portion of revenue left after accounting for all core expenses – everything from the cost of goods sold to advertising and wages. It’s also useful for comparing profitability across companies with different levels of debt and tax rates because it excludes interest and taxes.
Hubbell has been a well-oiled machine over the last five years. It demonstrated elite profitability for an industrials business, boasting an average operating margin of 17.3%.
Analyzing the trend in its profitability, Hubbell’s operating margin rose by 7.6 percentage points over the last five years, as its sales growth gave it immense operating leverage.
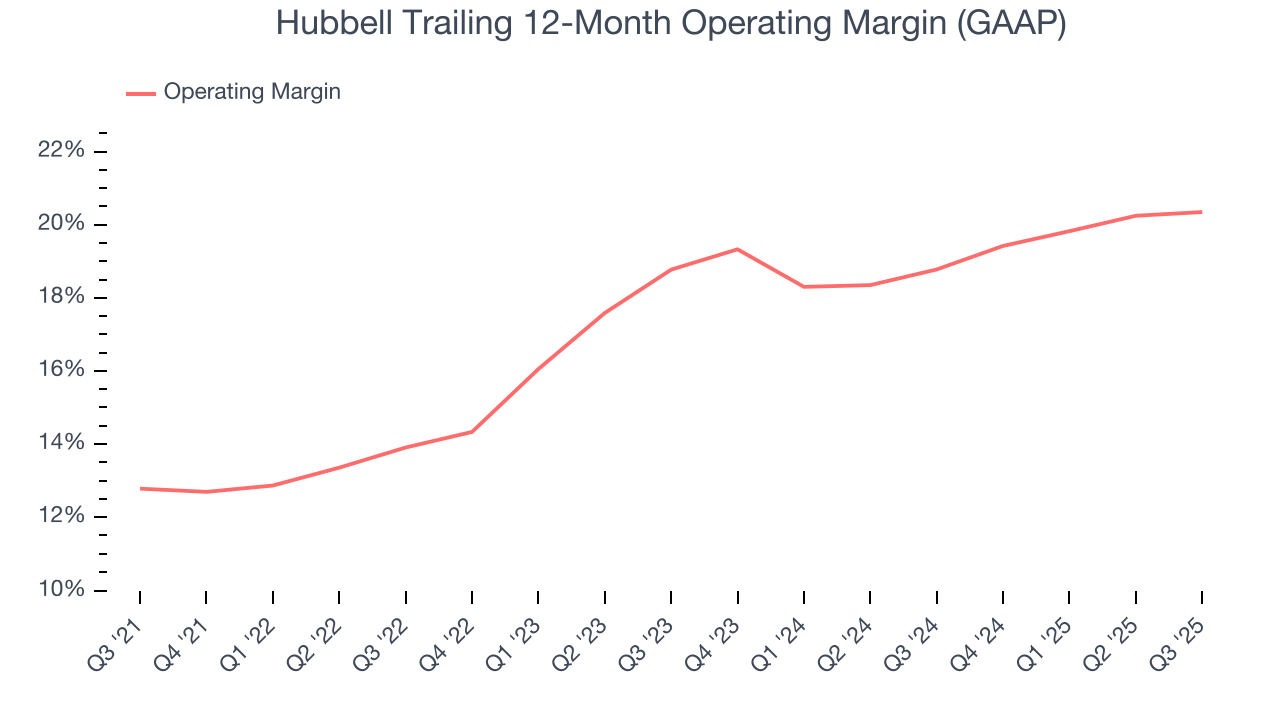
This quarter, Hubbell generated an operating margin profit margin of 22%, in line with the same quarter last year. This indicates the company’s cost structure has recently been stable.
8. Earnings Per Share
We track the long-term change in earnings per share (EPS) for the same reason as long-term revenue growth. Compared to revenue, however, EPS highlights whether a company’s growth is profitable.
Hubbell’s EPS grew at an astounding 18.1% compounded annual growth rate over the last five years, higher than its 8% annualized revenue growth. This tells us the company became more profitable on a per-share basis as it expanded.
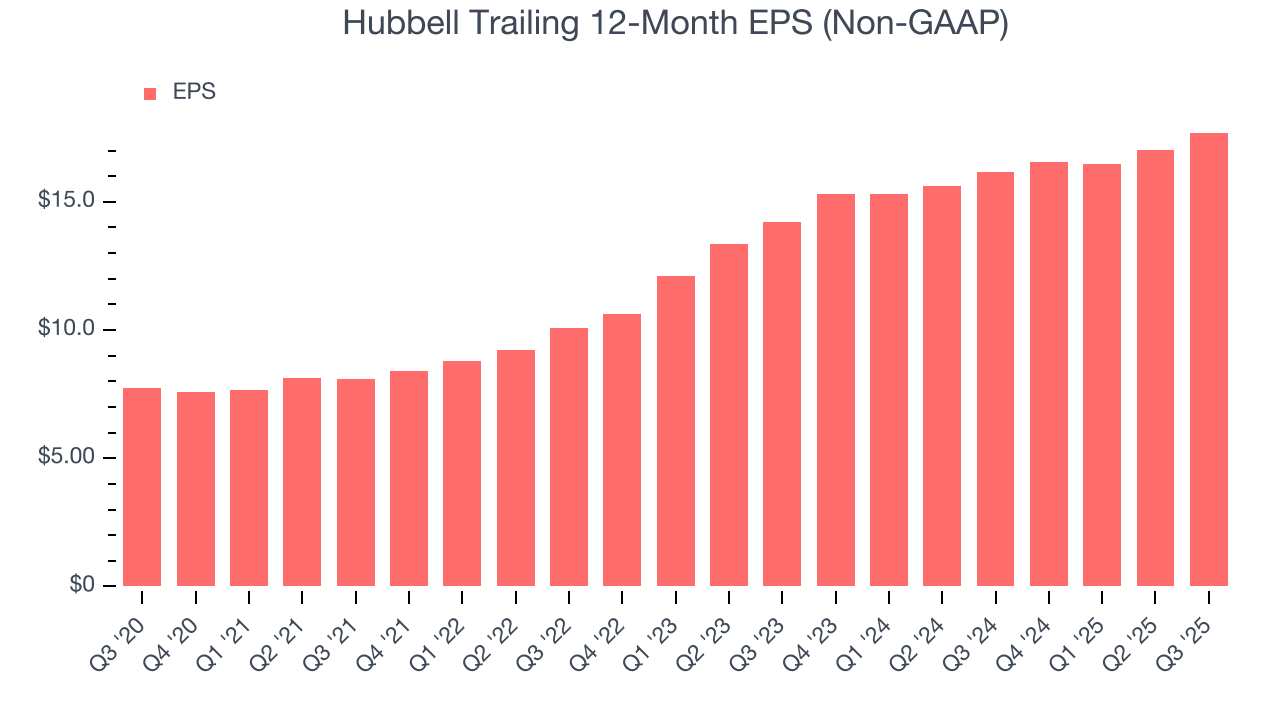
We can take a deeper look into Hubbell’s earnings to better understand the drivers of its performance. As we mentioned earlier, Hubbell’s operating margin was flat this quarter but expanded by 7.6 percentage points over the last five years. On top of that, its share count shrank by 2%. These are positive signs for shareholders because improving profitability and share buybacks turbocharge EPS growth relative to revenue growth. 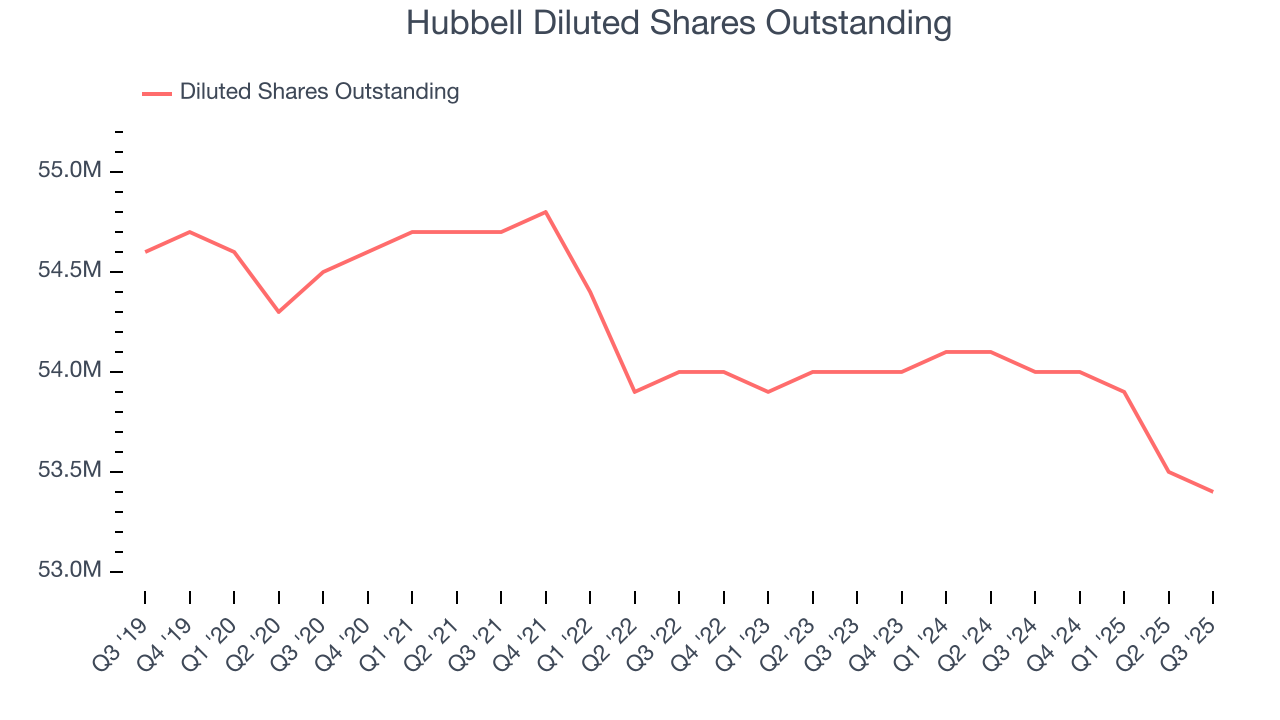
Like with revenue, we analyze EPS over a more recent period because it can provide insight into an emerging theme or development for the business.
For Hubbell, its two-year annual EPS growth of 11.5% was lower than its five-year trend. We still think its growth was good and hope it can accelerate in the future.
In Q3, Hubbell reported adjusted EPS of $5.17, up from $4.49 in the same quarter last year. This print beat analysts’ estimates by 3.9%. Over the next 12 months, Wall Street expects Hubbell’s full-year EPS of $17.70 to grow 9.2%.
9. Cash Is King
If you’ve followed StockStory for a while, you know we emphasize free cash flow. Why, you ask? We believe that in the end, cash is king, and you can’t use accounting profits to pay the bills.
Hubbell has shown robust cash profitability, enabling it to comfortably ride out cyclical downturns while investing in plenty of new offerings and returning capital to investors. The company’s free cash flow margin averaged 12.1% over the last five years, quite impressive for an industrials business.
Taking a step back, we can see that Hubbell’s margin expanded by 5.9 percentage points during that time. This is encouraging because it gives the company more optionality.
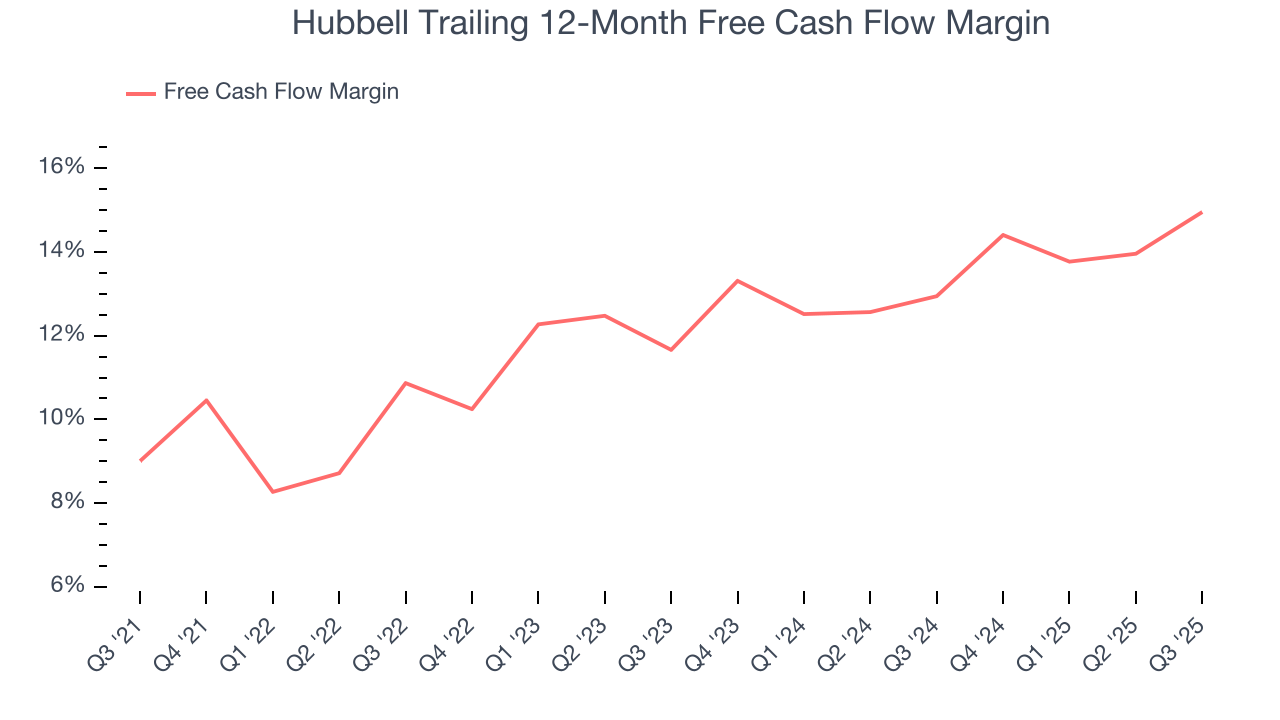
Hubbell’s free cash flow clocked in at $253.8 million in Q3, equivalent to a 16.9% margin. This result was good as its margin was 3.8 percentage points higher than in the same quarter last year, building on its favorable historical trend.
10. Return on Invested Capital (ROIC)
EPS and free cash flow tell us whether a company was profitable while growing its revenue. But was it capital-efficient? Enter ROIC, a metric showing how much operating profit a company generates relative to the money it has raised (debt and equity).
Hubbell’s five-year average ROIC was 26.3%, placing it among the best industrials companies. This illustrates its management team’s ability to invest in highly profitable ventures and produce tangible results for shareholders.
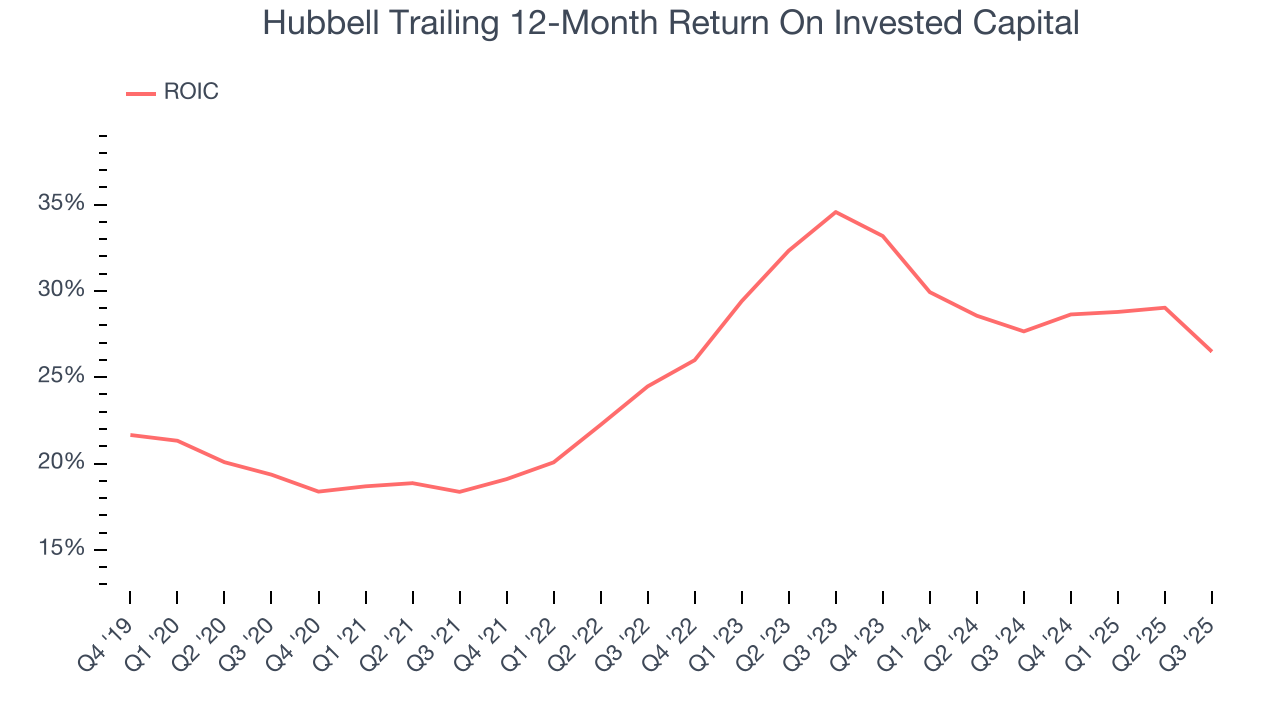
We like to invest in businesses with high returns, but the trend in a company’s ROIC is what often surprises the market and moves the stock price. Over the last few years, Hubbell’s ROIC has increased. This is a great sign when paired with its already strong returns. It could suggest its competitive advantage or profitable growth opportunities are expanding.
11. Balance Sheet Assessment
Hubbell reported $680.9 million of cash and $2.00 billion of debt on its balance sheet in the most recent quarter. As investors in high-quality companies, we primarily focus on two things: 1) that a company’s debt level isn’t too high and 2) that its interest payments are not excessively burdening the business.
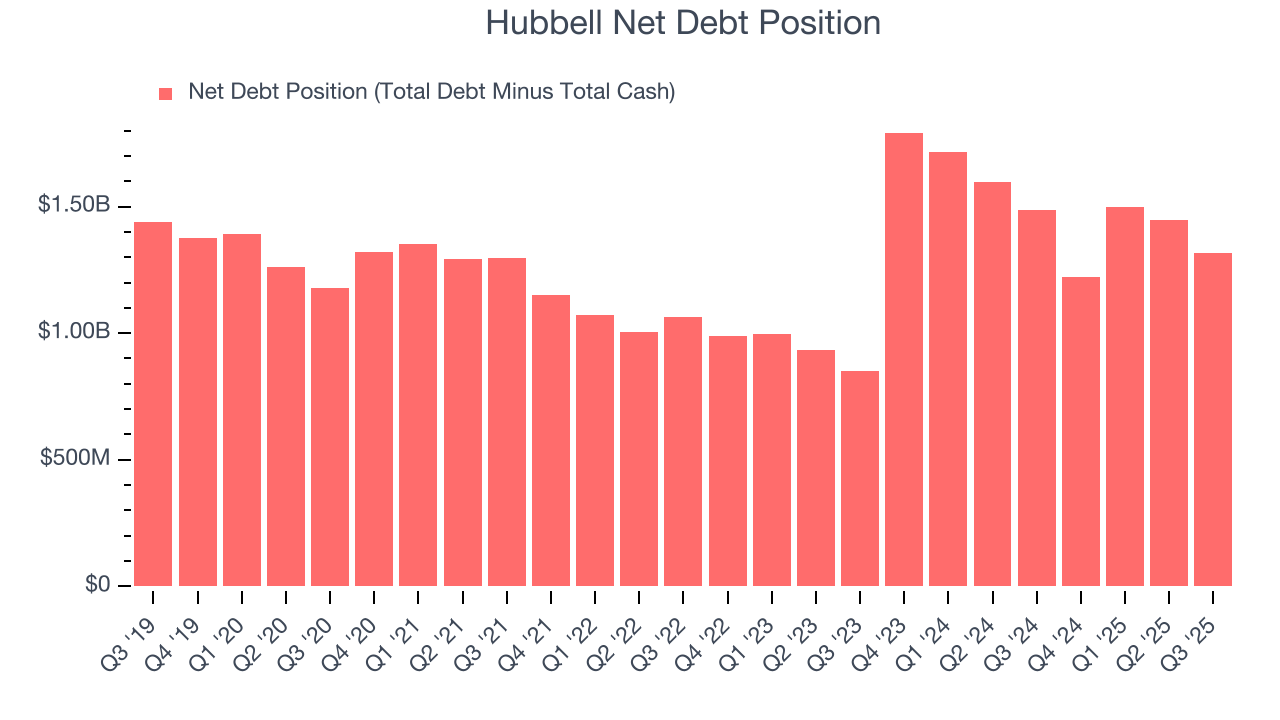
With $1.35 billion of EBITDA over the last 12 months, we view Hubbell’s 1.0× net-debt-to-EBITDA ratio as safe. We also see its $28.9 million of annual interest expenses as appropriate. The company’s profits give it plenty of breathing room, allowing it to continue investing in growth initiatives.
12. Key Takeaways from Hubbell’s Q3 Results
It was great to see Hubbell’s full-year EPS guidance top analysts’ expectations. We were also glad its EPS outperformed Wall Street’s estimates. On the other hand, its revenue missed and its organic revenue fell short of Wall Street’s estimates. Overall, this was a softer quarter. The stock traded down 1.6% to $427 immediately after reporting.
13. Is Now The Time To Buy Hubbell?
Updated: January 26, 2026 at 9:22 PM EST
Are you wondering whether to buy Hubbell or pass? We urge investors to not only consider the latest earnings results but also longer-term business quality and valuation as well.
Hubbell is a high-quality business worth owning. For starters, its revenue growth was decent over the last five years and is expected to accelerate over the next 12 months. And while its organic revenue growth has disappointed, its rising cash profitability gives it more optionality. On top of that, Hubbell’s expanding operating margin shows the business has become more efficient.
Hubbell’s P/E ratio based on the next 12 months is 24.8x. Analyzing the industrials landscape today, Hubbell’s positive attributes shine bright. We like the stock at this price.
Wall Street analysts have a consensus one-year price target of $502.23 on the company (compared to the current share price of $486.95), implying they see 3.1% upside in buying Hubbell in the short term.