
Installed Building Products (IBP)
Installed Building Products is interesting. Its strong sales growth and returns on capital show it’s capable of quick and profitable expansion.― StockStory Analyst Team
1. News


2. Summary
Why Installed Building Products Is Interesting
Founded in 1977, Installed Building Products (NYSE:IBP) is a company specializing in the installation of insulation, waterproofing, and other complementary building products for residential and commercial construction.
- ROIC punches in at 21.7%, illustrating management’s expertise in identifying profitable investments, and its rising returns show it’s making even more lucrative bets
- Incremental sales over the last five years have been highly profitable as its earnings per share increased by 21.4% annually, topping its revenue gains
- One pitfall is its estimated sales growth of 1.4% for the next 12 months implies demand will slow from its two-year trend


Installed Building Products shows some signs of a high-quality business. If you’ve been itching to buy the stock, the valuation seems fair.
Why Is Now The Time To Buy Installed Building Products?


Installed Building Products is trading at $284.27 per share, or 24x forward P/E. Compared to companies in the industrials space, we think this multiple is warranted for the revenue growth you get.
It could be a good time to invest if you see something the market doesn’t.
3. Installed Building Products (IBP) Research Report: Q4 CY2025 Update
Building products installation services company Installed Building Products (NYSE:IBP) reported revenue ahead of Wall Street’s expectations in Q4 CY2025, but sales were flat year on year at $747.5 million. Its non-GAAP profit of $3.24 per share was 18% above analysts’ consensus estimates.
Installed Building Products (IBP) Q4 CY2025 Highlights:
- Revenue: $747.5 million vs analyst estimates of $736.6 million (flat year on year, 1.5% beat)
- Adjusted EPS: $3.24 vs analyst estimates of $2.75 (18% beat)
- Adjusted EBITDA: $142.2 million vs analyst estimates of $126.1 million (19% margin, 12.7% beat)
- Operating Margin: 14.6%, up from 13.1% in the same quarter last year
- Free Cash Flow Margin: 6.6%, similar to the same quarter last year
- Market Capitalization: $8.11 billion
Company Overview
Founded in 1977, Installed Building Products (NYSE:IBP) is a company specializing in the installation of insulation, waterproofing, and other complementary building products for residential and commercial construction.
Installed Building Products, (IBP) is a leading installer and distributor of insulation and complementary building products for residential and commercial construction in the United States. Founded in 1977, IBP has grown to become one of the nation's largest insulation installers through organic growth and strategic acquisitions.
Operating through over 250 branch locations across the continental U.S., IBP's primary focus is insulation installation, but it has diversified into related products such as waterproofing, fire-stopping, garage doors, and rain gutters. This diversification strategy has reduced reliance on any single market segment and enhanced profitability.
IBP's operations are divided into Installation, Distribution, and Manufacturing segments. The Installation segment, generating the majority of revenue, provides service-based installation for various construction projects. The company's business model is differentiated by its streamlined value chain, purchasing directly from manufacturers and delivering to job sites for installation.
The company's growth strategy focuses on capitalizing on construction market trends, expanding market share, pursuing strategic acquisitions, and enhancing operational efficiency. IBP also prioritizes employee development and retention, offering competitive benefits and advancement opportunities.
IBP primarily generates revenue through project-based installation services using a cost-to-cost input method to recognize revenue over time as projects progress, rather than relying on long-term contracts or milestone payments. Their diverse customer base includes homebuilders, commercial construction firms, and individual homeowners. This model allows IBP to earn income as they complete various installation projects across different product offerings and customer segments.
4. Home Builders
Traditionally, homebuilders have built competitive advantages with economies of scale that lead to advantaged purchasing and brand recognition among consumers. Aesthetic trends have always been important in the space, but more recently, energy efficiency and conservation are driving innovation. However, these companies are still at the whim of the macro, specifically interest rates that heavily impact new and existing home sales. In fact, homebuilders are one of the most cyclical subsectors within industrials.
Competitors in the building and construction sector include KB Home (NYSE:KBH), Lennar (NYSE:LEN), and PulteGroup (NYSE:PHM).
5. Revenue Growth
A company’s long-term performance is an indicator of its overall quality. Any business can put up a good quarter or two, but the best consistently grow over the long haul. Thankfully, Installed Building Products’s 12.4% annualized revenue growth over the last five years was excellent. Its growth beat the average industrials company and shows its offerings resonate with customers, a helpful starting point for our analysis.
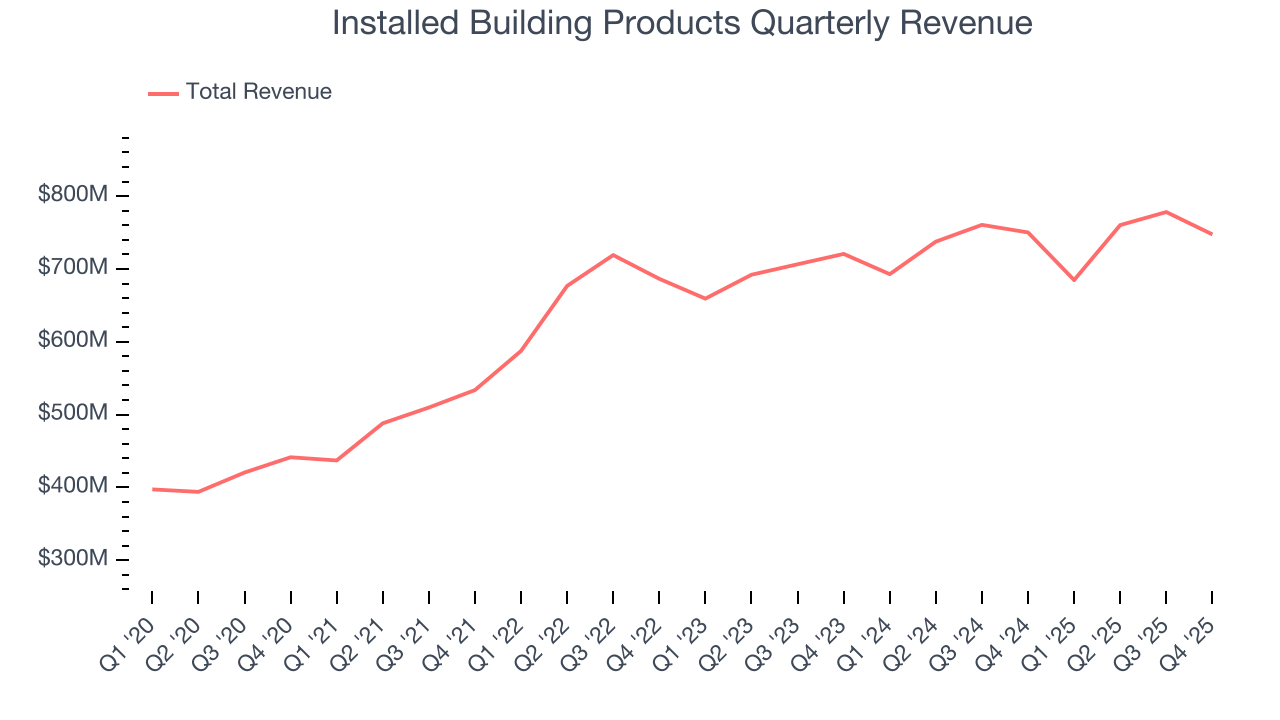
Long-term growth is the most important, but within industrials, a half-decade historical view may miss new industry trends or demand cycles. Installed Building Products’s recent performance shows its demand has slowed significantly as its annualized revenue growth of 3.4% over the last two years was well below its five-year trend. 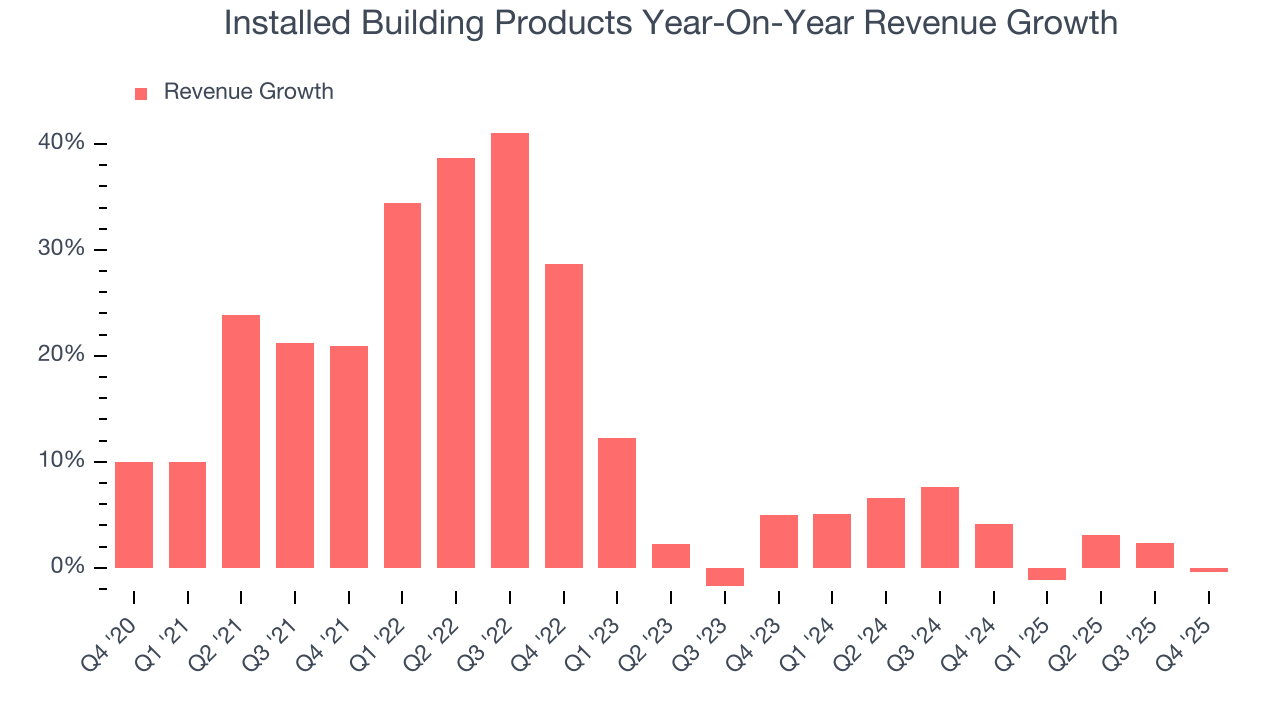
This quarter, Installed Building Products’s $747.5 million of revenue was flat year on year but beat Wall Street’s estimates by 1.5%.
Looking ahead, sell-side analysts expect revenue to remain flat over the next 12 months, a deceleration versus the last two years. This projection doesn't excite us and indicates its products and services will see some demand headwinds. At least the company is tracking well in other measures of financial health.
6. Gross Margin & Pricing Power
For industrials businesses, cost of sales is usually comprised of the direct labor, raw materials, and supplies needed to offer a product or service. These costs can be impacted by inflation and supply chain dynamics in the short term and a company’s purchasing power and scale over the long term.
Installed Building Products’s unit economics are better than the typical industrials business, signaling its products are somewhat differentiated through quality or brand.As you can see below, it averaged a decent 32.6% gross margin over the last five years. That means for every $100 in revenue, roughly $32.65 was left to spend on selling, marketing, R&D, and general administrative overhead. 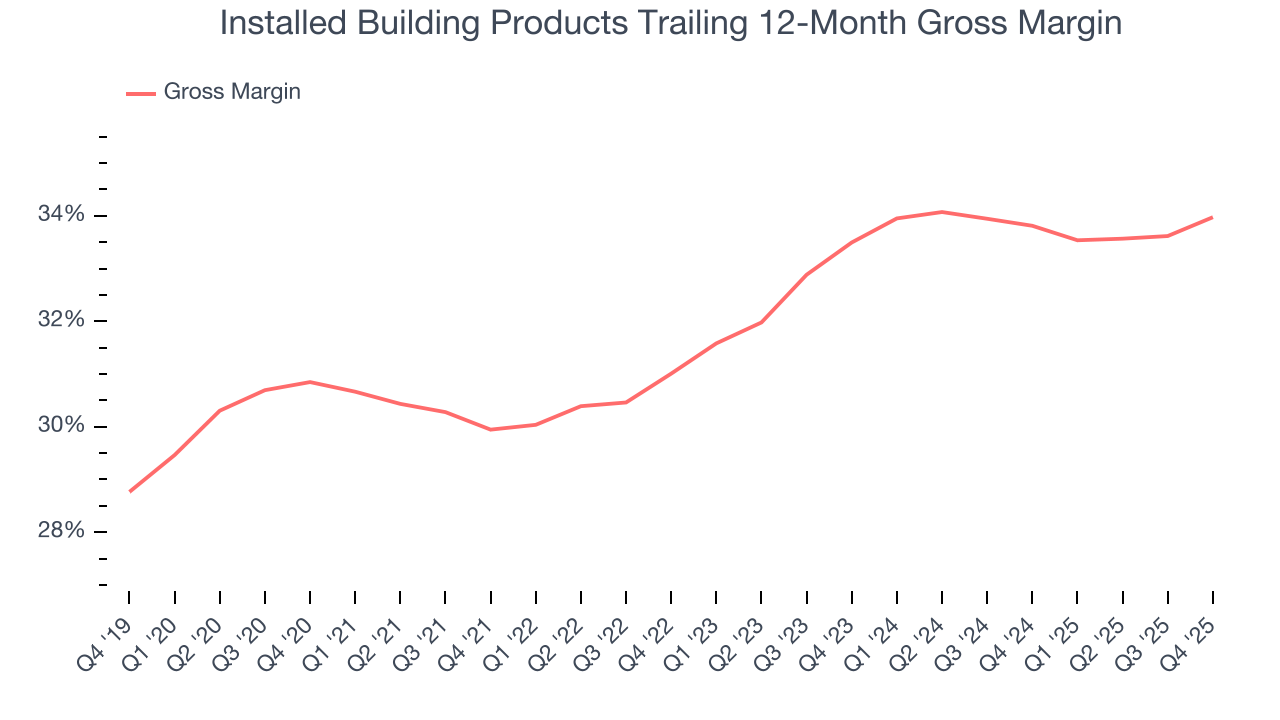
Installed Building Products’s gross profit margin came in at 35% this quarter , marking a 1.4 percentage point increase from 33.6% in the same quarter last year. Zooming out, the company’s full-year margin has remained steady over the past 12 months, suggesting its input costs (such as raw materials and manufacturing expenses) have been stable and it isn’t under pressure to lower prices.
7. Operating Margin
Installed Building Products has been an efficient company over the last five years. It was one of the more profitable businesses in the industrials sector, boasting an average operating margin of 12.5%.
Looking at the trend in its profitability, Installed Building Products’s operating margin rose by 3.5 percentage points over the last five years, as its sales growth gave it operating leverage. Its expansion shows it’s one of the better Home Builders companies as most peers saw their margins plummet.
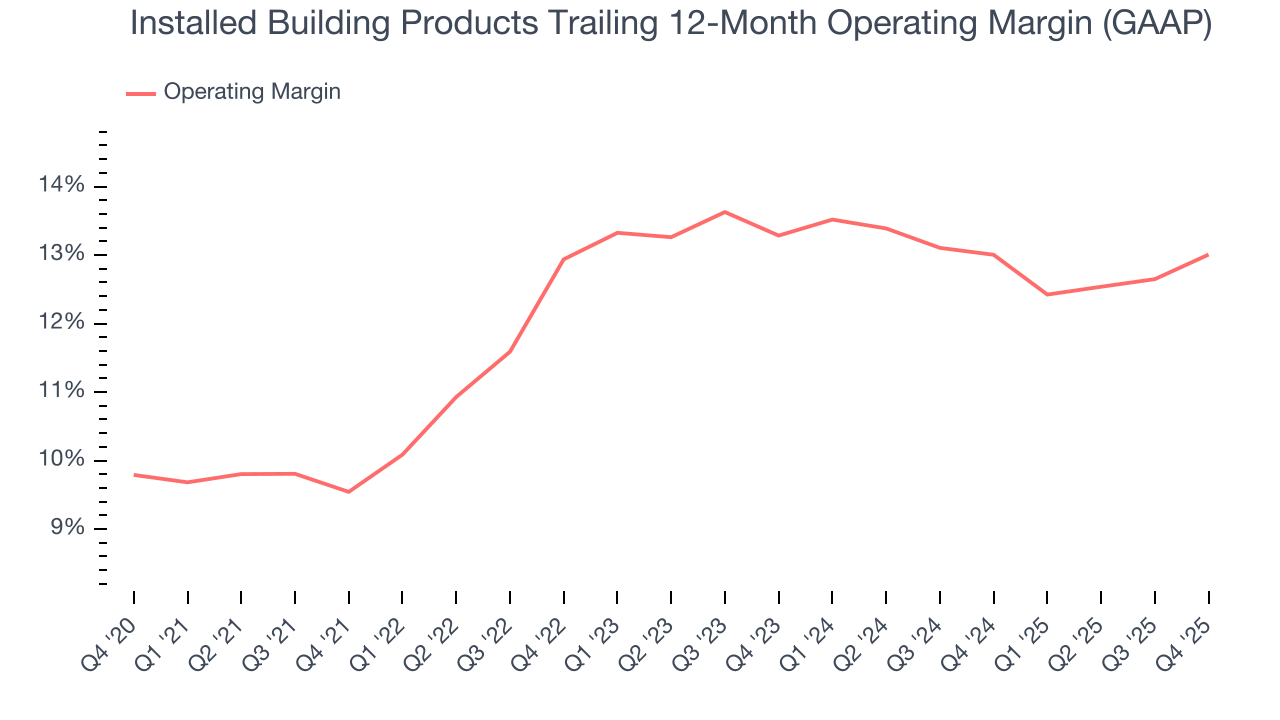
This quarter, Installed Building Products generated an operating margin profit margin of 14.6%, up 1.4 percentage points year on year. The increase was encouraging, and because its operating margin rose more than its gross margin, we can infer it was more efficient with expenses such as marketing, R&D, and administrative overhead.
8. Earnings Per Share
Revenue trends explain a company’s historical growth, but the long-term change in earnings per share (EPS) points to the profitability of that growth – for example, a company could inflate its sales through excessive spending on advertising and promotions.
Installed Building Products’s EPS grew at an astounding 21.4% compounded annual growth rate over the last five years, higher than its 12.4% annualized revenue growth. This tells us the company became more profitable on a per-share basis as it expanded.
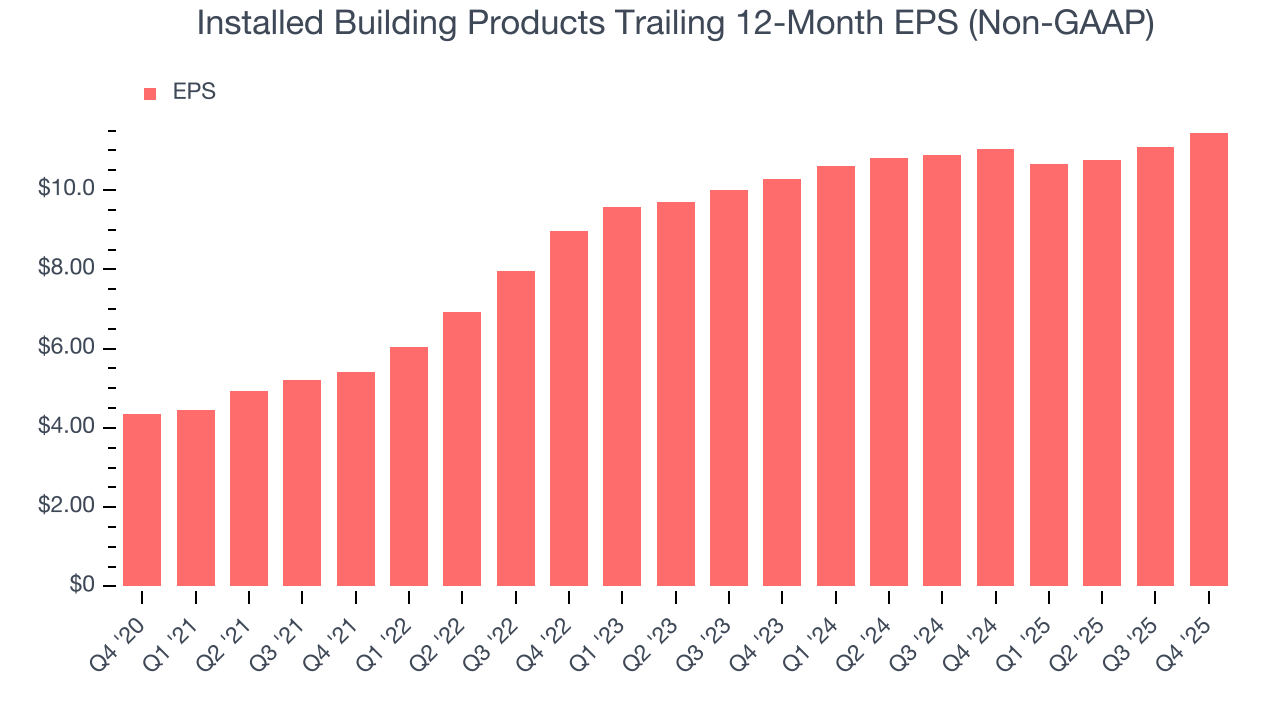
We can take a deeper look into Installed Building Products’s earnings quality to better understand the drivers of its performance. As we mentioned earlier, Installed Building Products’s operating margin expanded by 3.5 percentage points over the last five years. On top of that, its share count shrank by 8.8%. These are positive signs for shareholders because improving profitability and share buybacks turbocharge EPS growth relative to revenue growth. 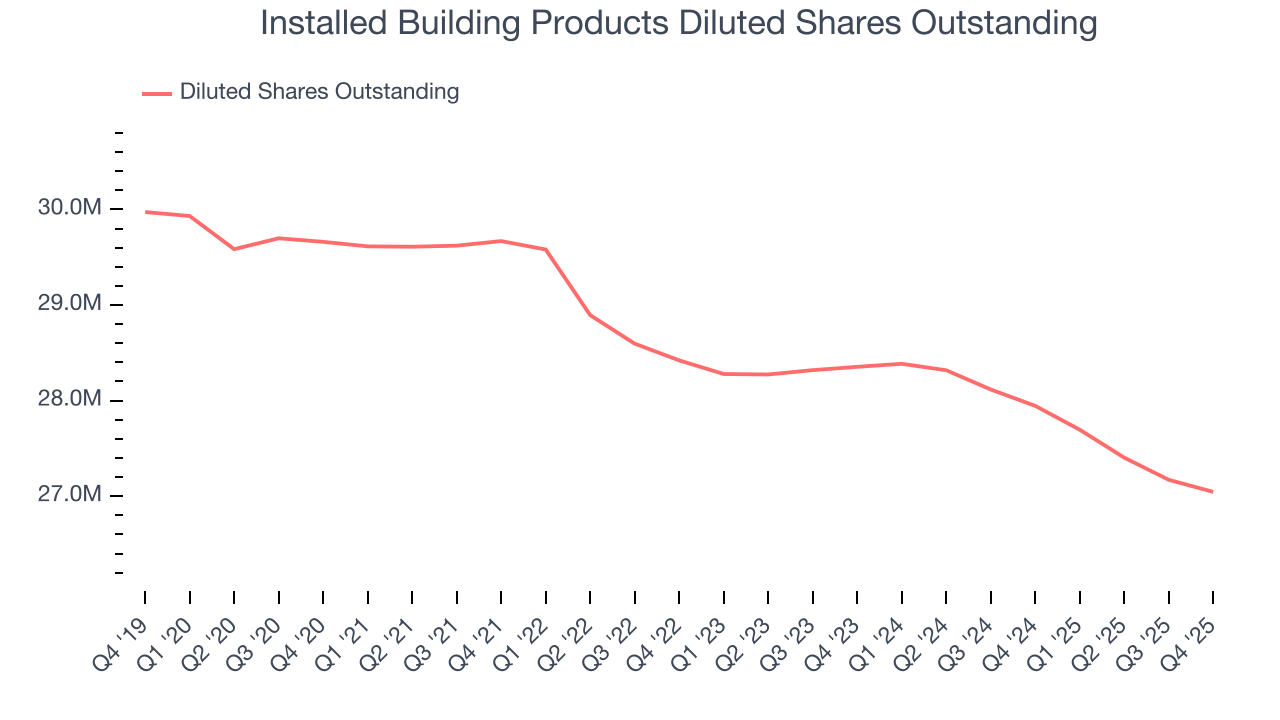
Like with revenue, we analyze EPS over a shorter period to see if we are missing a change in the business.
For Installed Building Products, its two-year annual EPS growth of 5.5% was lower than its five-year trend. This wasn’t great, but at least the company was successful in other measures of financial health.
In Q4, Installed Building Products reported adjusted EPS of $3.24, up from $2.88 in the same quarter last year. This print easily cleared analysts’ estimates, and shareholders should be content with the results. Over the next 12 months, Wall Street expects Installed Building Products’s full-year EPS of $11.45 to shrink by 5%.
9. Cash Is King
Free cash flow isn't a prominently featured metric in company financials and earnings releases, but we think it's telling because it accounts for all operating and capital expenses, making it tough to manipulate. Cash is king.
Installed Building Products has shown impressive cash profitability, enabling it to ride out cyclical downturns more easily while maintaining its investments in new and existing offerings. The company’s free cash flow margin averaged 8.7% over the last five years, better than the broader industrials sector.
Taking a step back, we can see that Installed Building Products’s margin expanded by 5 percentage points during that time. This shows the company is heading in the right direction, and we can see it became a less capital-intensive business because its free cash flow profitability rose more than its operating profitability.
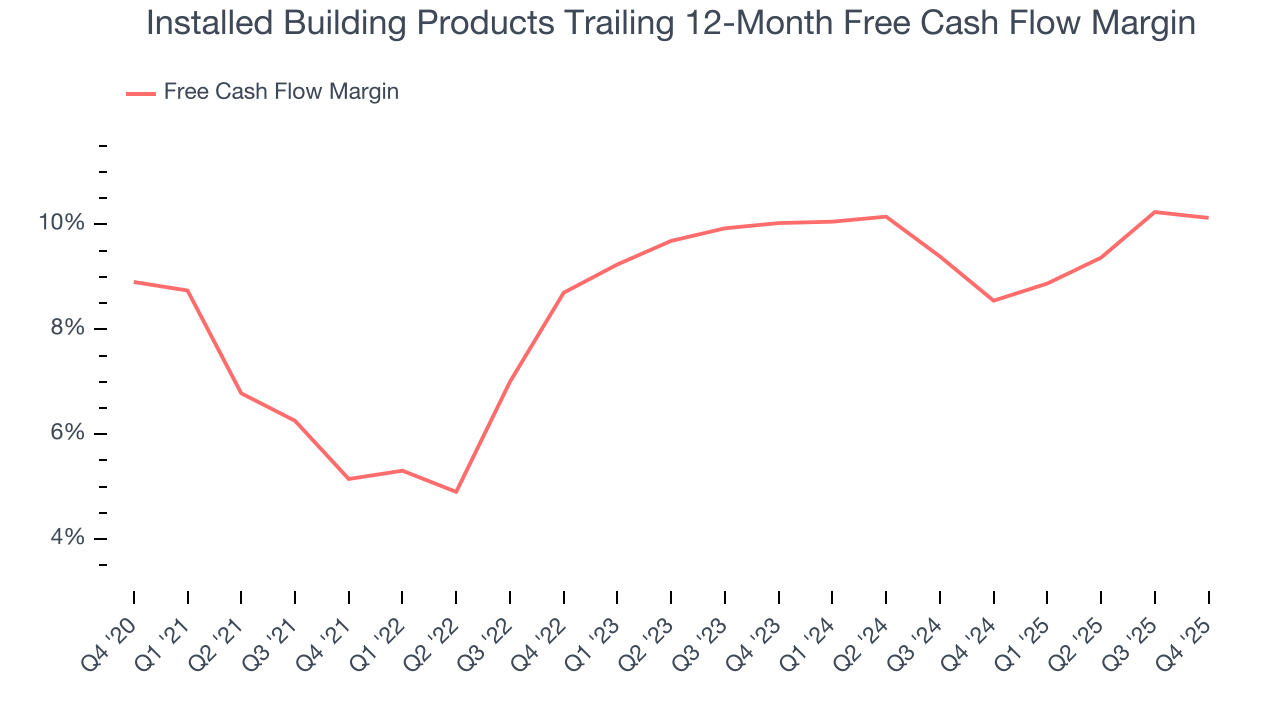
Installed Building Products’s free cash flow clocked in at $49.3 million in Q4, equivalent to a 6.6% margin. This cash profitability was in line with the comparable period last year but below its five-year average. We wouldn’t read too much into it because investment needs can be seasonal, causing short-term swings. Long-term trends carry greater meaning.
10. Return on Invested Capital (ROIC)
EPS and free cash flow tell us whether a company was profitable while growing its revenue. But was it capital-efficient? A company’s ROIC explains this by showing how much operating profit it makes compared to the money it has raised (debt and equity).
Installed Building Products’s five-year average ROIC was 21.8%, placing it among the best industrials companies. This illustrates its management team’s ability to invest in highly profitable ventures and produce tangible results for shareholders.
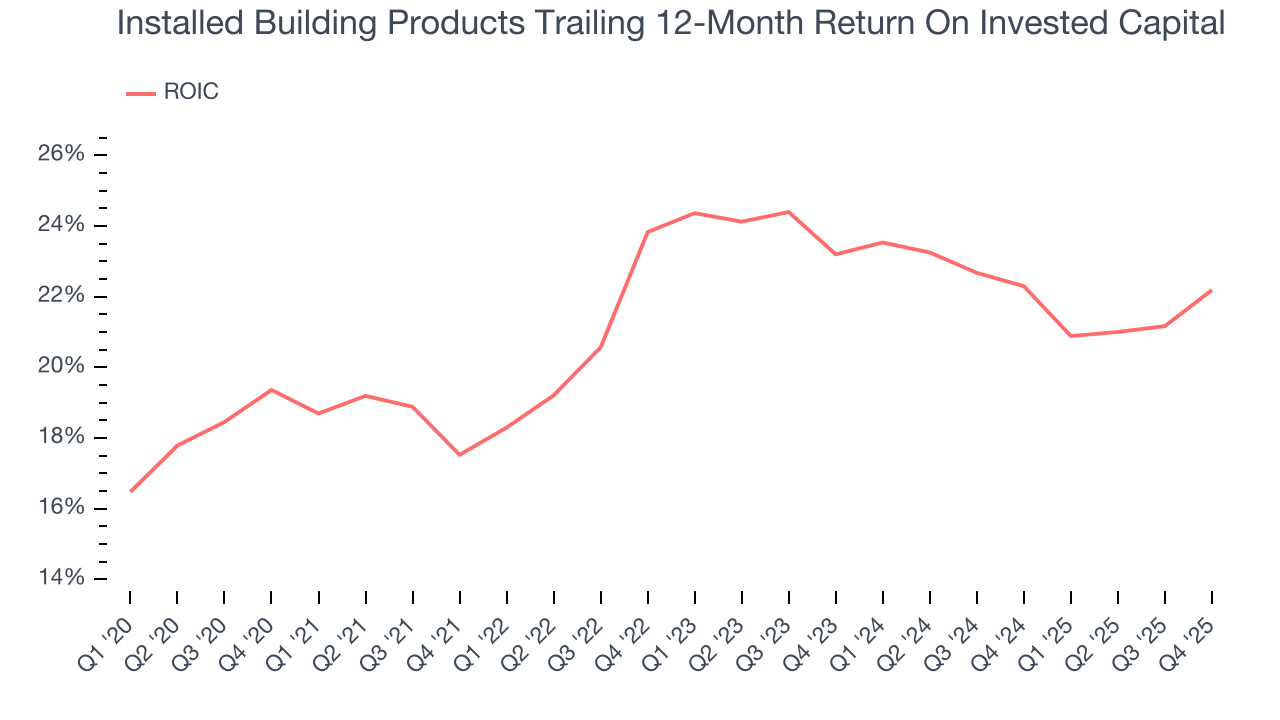
We like to invest in businesses with high returns, but the trend in a company’s ROIC is what often surprises the market and moves the stock price. Over the last few years, Installed Building Products’s ROIC averaged 1.6 percentage point increases each year. This is a great sign when paired with its already strong returns. It could suggest its competitive advantage or profitable growth opportunities are expanding.
11. Balance Sheet Assessment
Installed Building Products reported $321.9 million of cash and $991.7 million of debt on its balance sheet in the most recent quarter. As investors in high-quality companies, we primarily focus on two things: 1) that a company’s debt level isn’t too high and 2) that its interest payments are not excessively burdening the business.
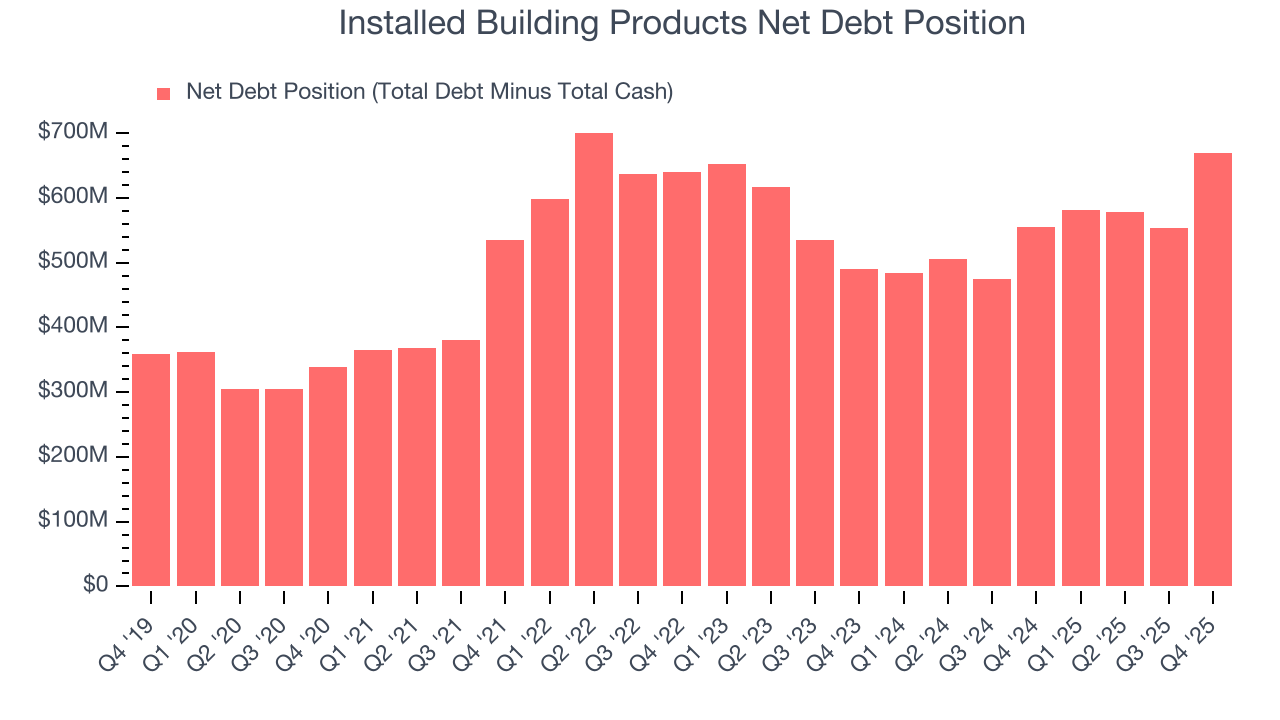
With $518.5 million of EBITDA over the last 12 months, we view Installed Building Products’s 1.3× net-debt-to-EBITDA ratio as safe. We also see its $15.2 million of annual interest expenses as appropriate. The company’s profits give it plenty of breathing room, allowing it to continue investing in growth initiatives.
12. Key Takeaways from Installed Building Products’s Q4 Results
We were impressed by how significantly Installed Building Products blew past analysts’ EBITDA expectations this quarter. We were also glad its EPS outperformed Wall Street’s estimates. Zooming out, we think this was a good print with some key areas of upside. The stock traded up 5.6% to $317.55 immediately following the results.
13. Is Now The Time To Buy Installed Building Products?
Updated: March 15, 2026 at 11:51 PM EDT
A common mistake we notice when investors are deciding whether to buy a stock or not is that they simply look at the latest earnings results. Business quality and valuation matter more, so we urge you to understand these dynamics as well.
Installed Building Products possesses a number of positive attributes. First off, its revenue growth was impressive over the last five years. And while its projected EPS for the next year is lacking, its astounding EPS growth over the last five years shows its profits are trickling down to shareholders. On top of that, its stellar ROIC suggests it has been a well-run company historically.
Installed Building Products’s P/E ratio based on the next 12 months is 24x. Looking at the industrials space right now, Installed Building Products trades at a compelling valuation. If you’re a fan of the business and management team, now is a good time to scoop up some shares.
Wall Street analysts have a consensus one-year price target of $302.33 on the company (compared to the current share price of $284.27), implying they see 6.4% upside in buying Installed Building Products in the short term.