
Janus (JBI)
We’re skeptical of Janus. Its weak sales growth and declining returns on capital show its demand and profits are shrinking.― StockStory Analyst Team
1. News


2. Summary
Why We Think Janus Will Underperform
Standing out with its digital keyless entry into self-storage room technology, Janus (NYSE:JBI) is a provider of easily accessible self-storage solutions.
- Earnings per share lagged its peers over the last four years as they only grew by 1.9% annually
- A positive is that its disciplined cost controls and effective management have materialized in a strong operating margin


Janus is in the doghouse. There are more rewarding stocks elsewhere.
Why There Are Better Opportunities Than Janus


Janus is trading at $5.37 per share, or 8.3x forward P/E. Janus’s valuation may seem like a great deal, but we think there are valid reasons why it’s so cheap.
Cheap stocks can look like a great deal at first glance, but they can be value traps. They often have less earnings power, meaning there is more reliance on a re-rating to generate good returns - an unlikely scenario for low-quality companies.
3. Janus (JBI) Research Report: Q4 CY2025 Update
Self-storage and building solutions company Janus (NYSE:JBI) reported Q4 CY2025 results beating Wall Street’s revenue expectations, but sales fell by 1.9% year on year to $226.3 million. The company’s full-year revenue guidance of $960 million at the midpoint came in 8% above analysts’ estimates. Its non-GAAP profit of $0.11 per share was 10.2% below analysts’ consensus estimates.
Janus (JBI) Q4 CY2025 Highlights:
- Revenue: $226.3 million vs analyst estimates of $216.3 million (1.9% year-on-year decline, 4.6% beat)
- Adjusted EPS: $0.11 vs analyst expectations of $0.12 (10.2% miss)
- Adjusted EBITDA: $37.2 million vs analyst estimates of $37.19 million (16.4% margin, in line)
- EBITDA guidance for the upcoming financial year 2026 is $175 million at the midpoint, above analyst estimates of $172.5 million
- Operating Margin: 9.2%, up from 5.5% in the same quarter last year
- Free Cash Flow Margin: 8.5%, down from 19.6% in the same quarter last year
- Market Capitalization: $920.4 million
Company Overview
Standing out with its digital keyless entry into self-storage room technology, Janus (NYSE:JBI) is a provider of easily accessible self-storage solutions.
The company creates easier ways for people to access and store their goods in self-storage solutions. Along with self-storage solutions, the company also manufactures roll-up doors and security systems that facilitate storage safety. Its products and services fulfill the growing need for trustworthy storage space in urban centers and suburbs.
The company’s product offerings include climate-controlled unit partitions, hallway systems, and the innovative Nokē® Smart Entry system, its standout digital keyless entry technology. Additionally, Janus has expanded its product lines with the acquisition of Building Components Group and DBCI, which make commercial and industrial doors.
The company’s revenue stream comes from the net sales of its two business segments: the commercial and industrial door segment, and its self-storage segment. Some of the company’s total sales come from its commercial and industrial door segments, while the majority of its revenue comes from its self-storage segment. A small amount of service revenue exists for the company during installation and pre-installation planning of its products.
4. Commercial Building Products
Commercial building products companies, which often serve more complicated projects, can supplement their core business with higher-margin installation and consulting services revenues. More recently, advances to address labor availability and job site productivity have spurred innovation. Additionally, companies in the space that can produce more energy-efficient materials have opportunities to take share. However, these companies are at the whim of commercial construction volumes, which tend to be cyclical and can be impacted heavily by economic factors such as interest rates. Additionally, the costs of raw materials can be driven by a myriad of worldwide factors and greatly influence the profitability of commercial building products companies.
Other companies operating in the self-storage and commercial industrial door industries include Public Storage (NYSE:PSA) and privately held companies Overhead Door and Steel Storage.
5. Revenue Growth
Examining a company’s long-term performance can provide clues about its quality. Any business can experience short-term success, but top-performing ones enjoy sustained growth for years. Luckily, Janus’s sales grew at a solid 10% compounded annual growth rate over the last five years. Its growth beat the average industrials company and shows its offerings resonate with customers.
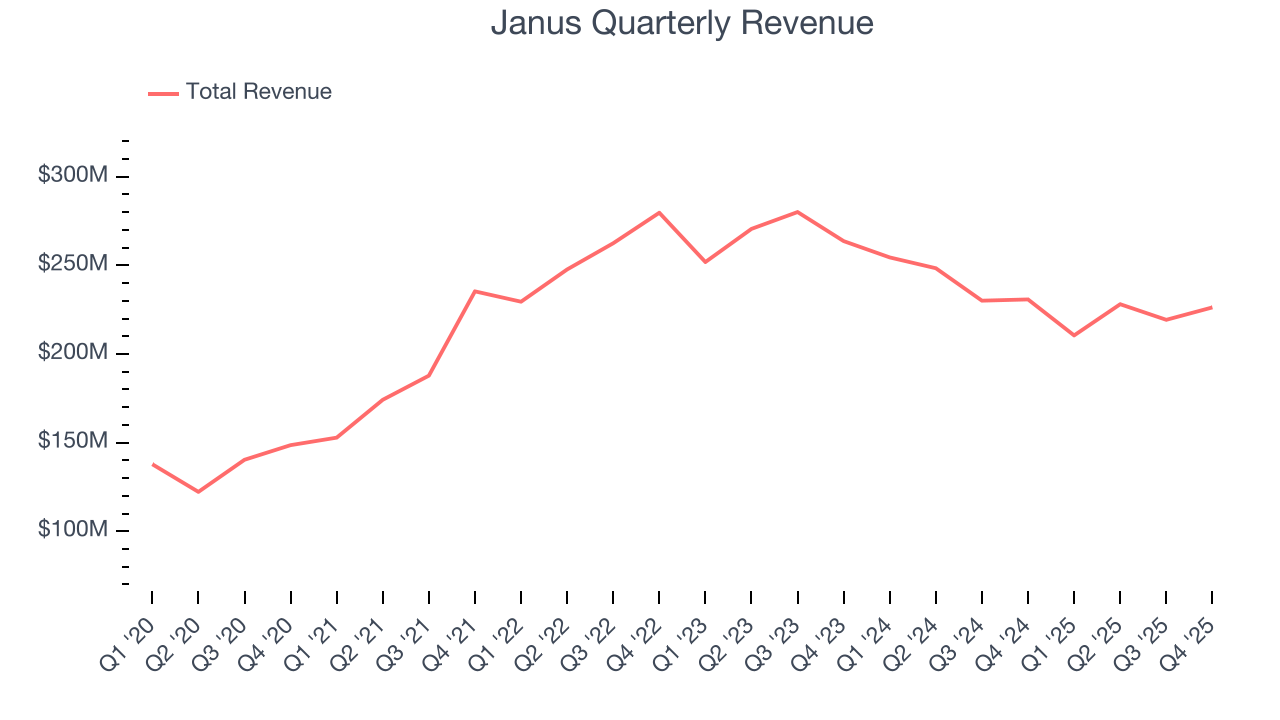
Long-term growth is the most important, but within industrials, a half-decade historical view may miss new industry trends or demand cycles. Janus’s recent performance marks a sharp pivot from its five-year trend as its revenue has shown annualized declines of 8.9% over the last two years. 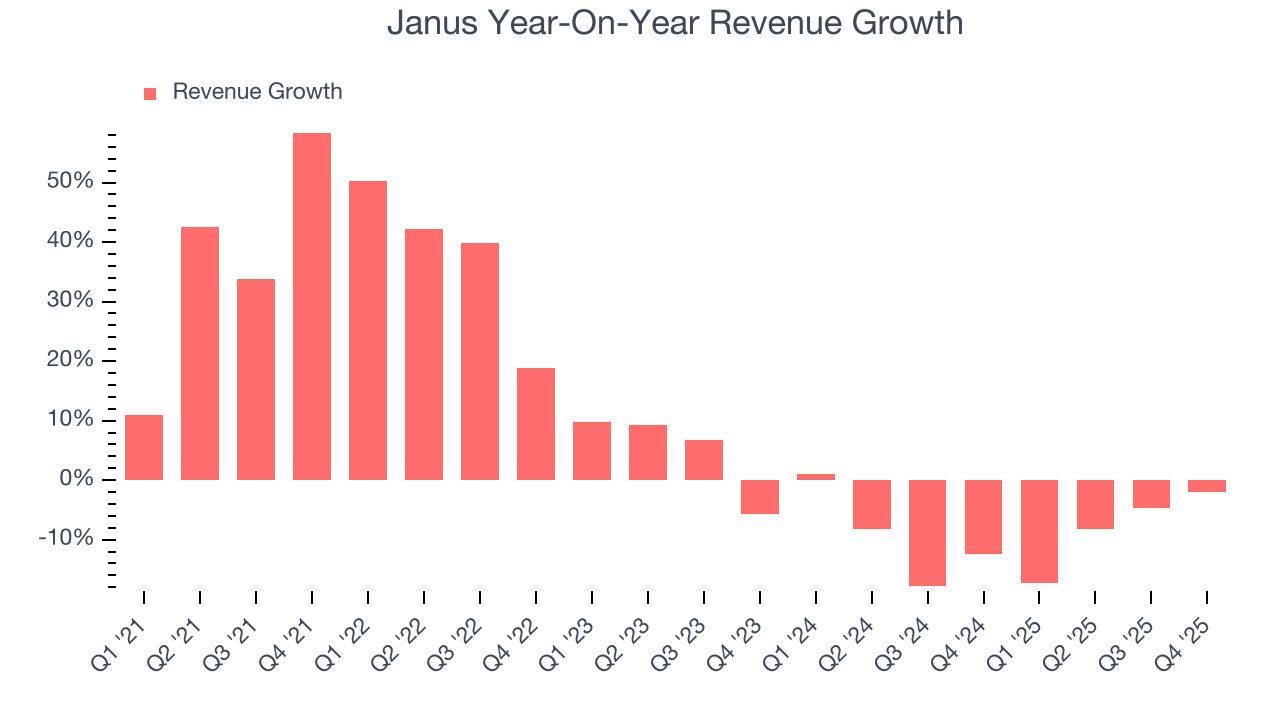
This quarter, Janus’s revenue fell by 1.9% year on year to $226.3 million but beat Wall Street’s estimates by 4.6%.
Looking ahead, sell-side analysts expect revenue to remain flat over the next 12 months. Although this projection suggests its newer products and services will fuel better top-line performance, it is still below the sector average.
6. Gross Margin & Pricing Power
All else equal, we prefer higher gross margins because they usually indicate that a company sells more differentiated products and commands stronger pricing power.
Janus’s unit economics are great compared to the broader industrials sector and signal that it enjoys product differentiation through quality or brand. As you can see below, it averaged an excellent 38.6% gross margin over the last five years. Said differently, roughly $38.57 was left to spend on selling, marketing, R&D, and general administrative overhead for every $100 in revenue. 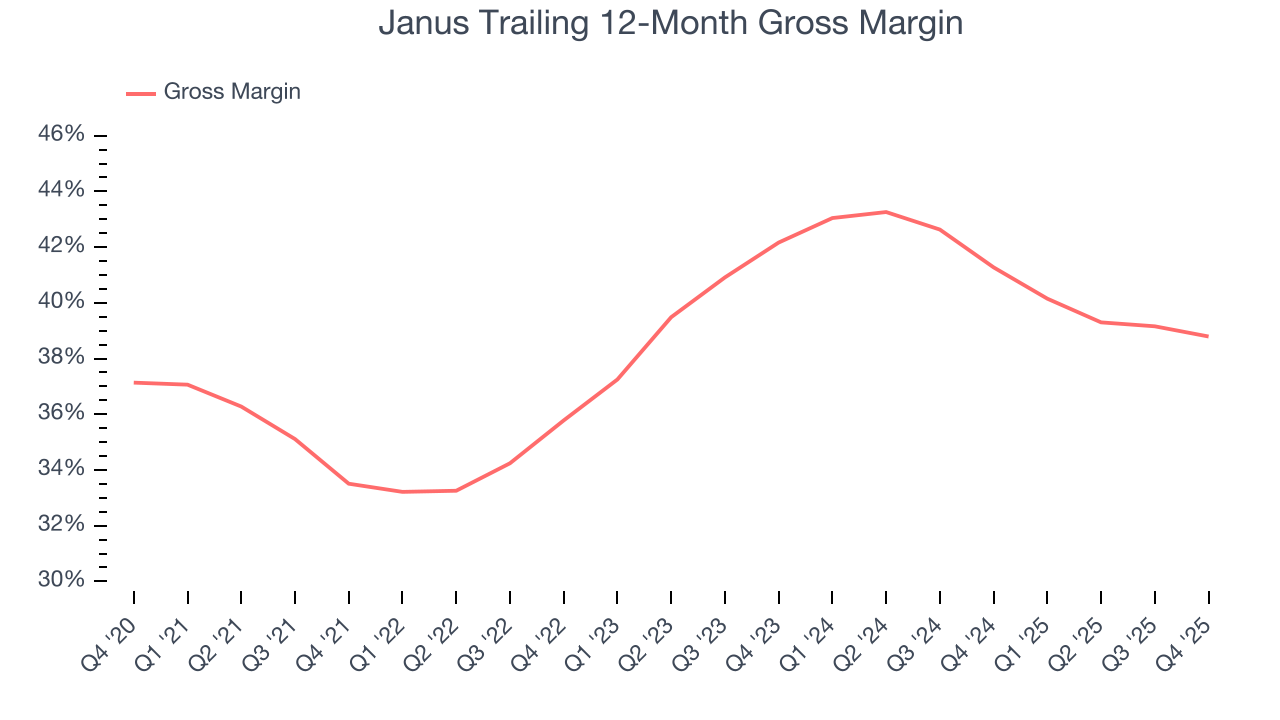
Janus’s gross profit margin came in at 36.3% this quarter , marking a 1.5 percentage point decrease from 37.8% in the same quarter last year. Janus’s full-year margin has also been trending down over the past 12 months, decreasing by 2.5 percentage points. If this move continues, it could suggest a more competitive environment with some pressure to lower prices and higher input costs (such as raw materials and manufacturing expenses).
7. Operating Margin
Operating margin is an important measure of profitability as it shows the portion of revenue left after accounting for all core expenses – everything from the cost of goods sold to advertising and wages. It’s also useful for comparing profitability across companies with different levels of debt and tax rates because it excludes interest and taxes.
Janus’s operating margin has more or less stayed the same over the last 12 months , averaging 16.7% over the last five years. This profitability was elite for an industrials business thanks to its efficient cost structure and economies of scale. This result isn’t surprising as its high gross margin gives it a favorable starting point.
Looking at the trend in its profitability, Janus’s operating margin might fluctuated slightly but has generally stayed the same over the last five years. This raises questions about the company’s expense base because its revenue growth should have given it leverage on its fixed costs, resulting in better economies of scale and profitability.
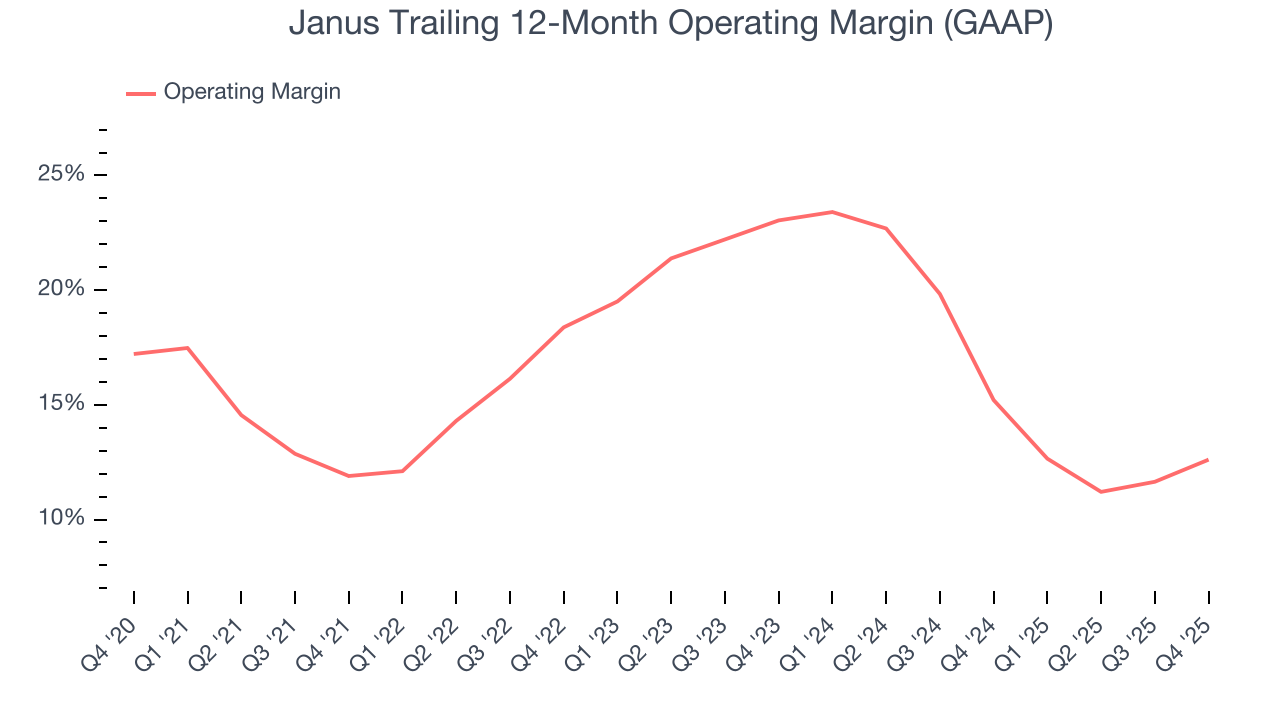
In Q4, Janus generated an operating margin profit margin of 9.2%, up 3.6 percentage points year on year. The increase was encouraging, and because its revenue and gross margin actually decreased, we can assume it was more efficient because it trimmed its operating expenses like marketing, R&D, and administrative overhead.
8. Earnings Per Share
We track the long-term change in earnings per share (EPS) for the same reason as long-term revenue growth. Compared to revenue, however, EPS highlights whether a company’s growth is profitable.
Janus’s full-year EPS grew at a weak 1.9% compounded annual growth rate over the last four years, worse than the broader industrials sector.
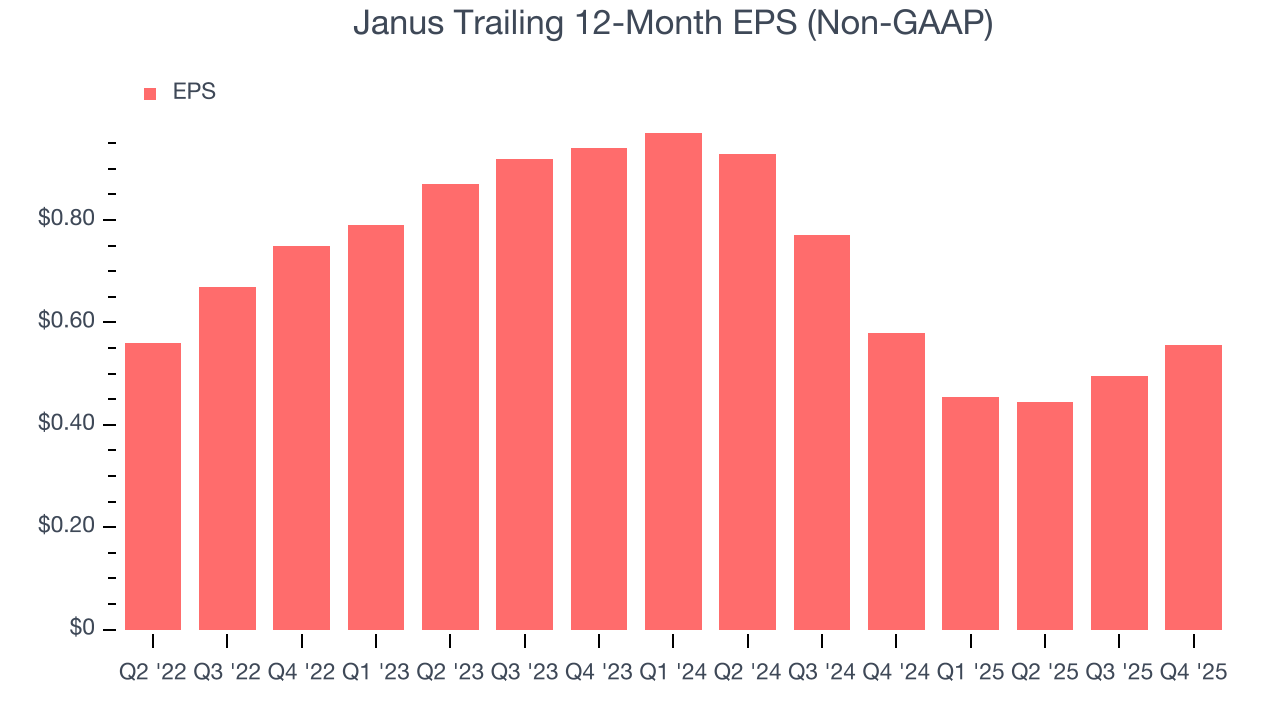
Like with revenue, we analyze EPS over a more recent period because it can provide insight into an emerging theme or development for the business.
Sadly for Janus, its EPS declined by more than its revenue over the last two years, dropping 23.2%. This tells us the company struggled to adjust to shrinking demand.
Diving into the nuances of Janus’s earnings can give us a better understanding of its performance. While we mentioned earlier that Janus’s operating margin expanded this quarter, a two-year view shows its margin has declined. This was the most relevant factor (aside from the revenue impact) behind its lower earnings; interest expenses and taxes can also affect EPS but don’t tell us as much about a company’s fundamentals.
In Q4, Janus reported adjusted EPS of $0.11, up from $0.05 in the same quarter last year. Despite growing year on year, this print missed analysts’ estimates. Over the next 12 months, Wall Street expects Janus’s full-year EPS of $0.56 to grow 18%.
9. Cash Is King
Free cash flow isn't a prominently featured metric in company financials and earnings releases, but we think it's telling because it accounts for all operating and capital expenses, making it tough to manipulate. Cash is king.
Janus has shown robust cash profitability, enabling it to comfortably ride out cyclical downturns while investing in plenty of new offerings and returning capital to investors. The company’s free cash flow margin averaged 12.6% over the last five years, quite impressive for an industrials business. Janus has shown robust cash profitability relative to peers over the last five years, giving the company fewer opportunities to return capital to shareholders.
Taking a step back, we can see that Janus’s margin expanded by 4.3 percentage points during that time. This shows the company is heading in the right direction, and we can see it became a less capital-intensive business because its free cash flow profitability rose while its operating profitability was flat.
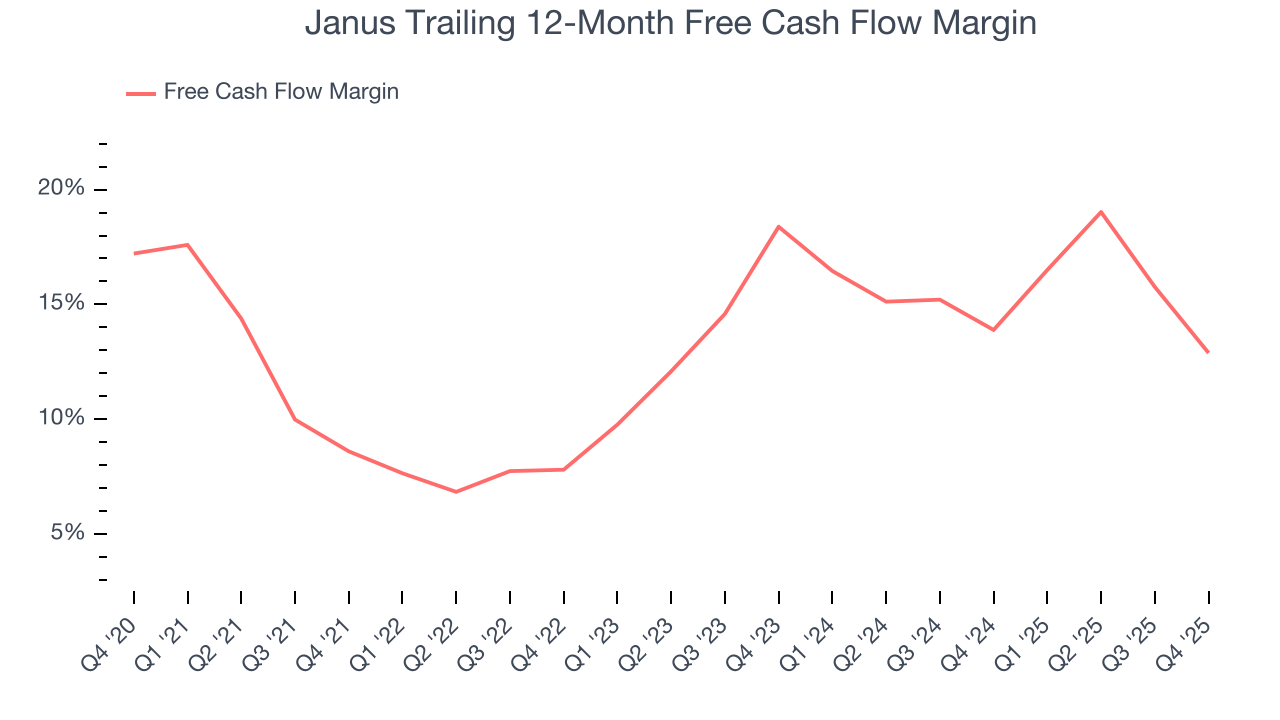
Janus’s free cash flow clocked in at $19.2 million in Q4, equivalent to a 8.5% margin. The company’s cash profitability regressed as it was 11.1 percentage points lower than in the same quarter last year, prompting us to pay closer attention. Short-term fluctuations typically aren’t a big deal because investment needs can be seasonal, but we’ll be watching to see if the trend extrapolates into future quarters.
10. Return on Invested Capital (ROIC)
EPS and free cash flow tell us whether a company was profitable while growing its revenue. But was it capital-efficient? Enter ROIC, a metric showing how much operating profit a company generates relative to the money it has raised (debt and equity).
Although Janus hasn’t been the highest-quality company lately because of its poor bottom-line (EPS) performance, it historically found a few growth initiatives that worked. Its five-year average ROIC was 13.1%, higher than most industrials businesses.
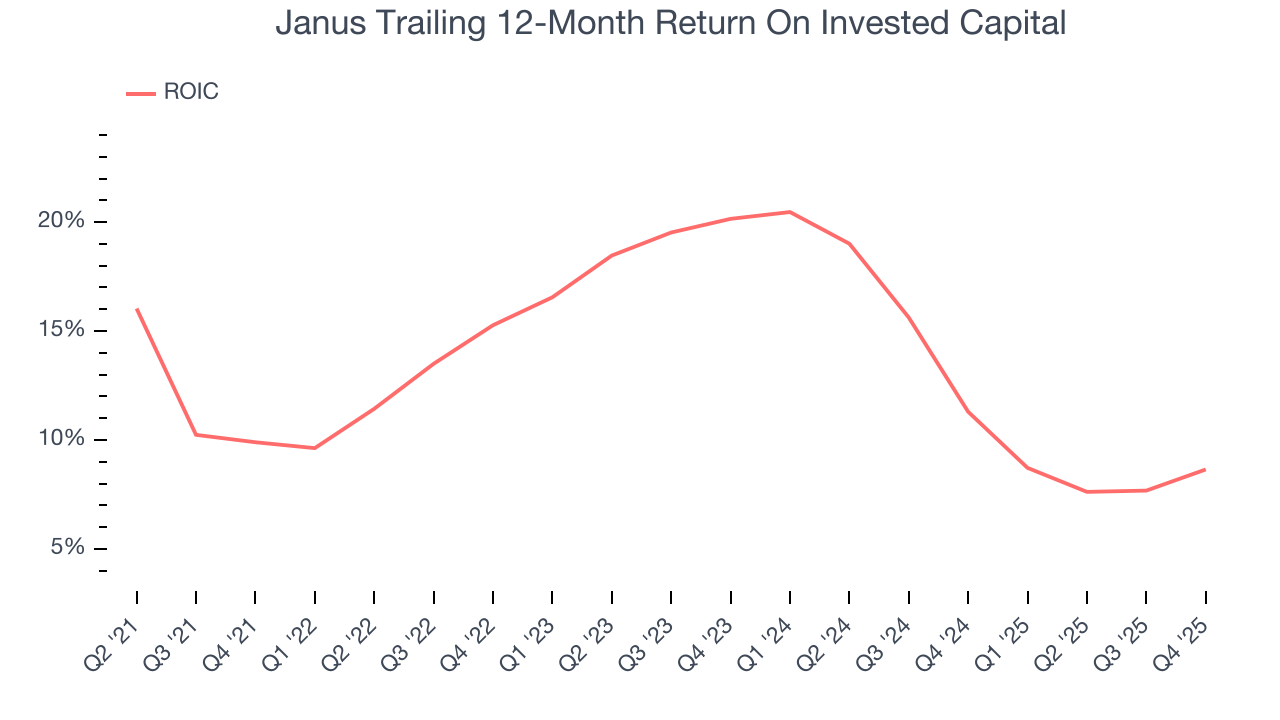
We like to invest in businesses with high returns, but the trend in a company’s ROIC is what often surprises the market and moves the stock price. On average, Janus’s ROIC decreased by 2.6 percentage points annually each year over the last few years. We like what management has done in the past, but its declining returns are perhaps a symptom of fewer profitable growth opportunities.
11. Balance Sheet Assessment
Janus reported $194.4 million of cash and $545.7 million of debt on its balance sheet in the most recent quarter. As investors in high-quality companies, we primarily focus on two things: 1) that a company’s debt level isn’t too high and 2) that its interest payments are not excessively burdening the business.
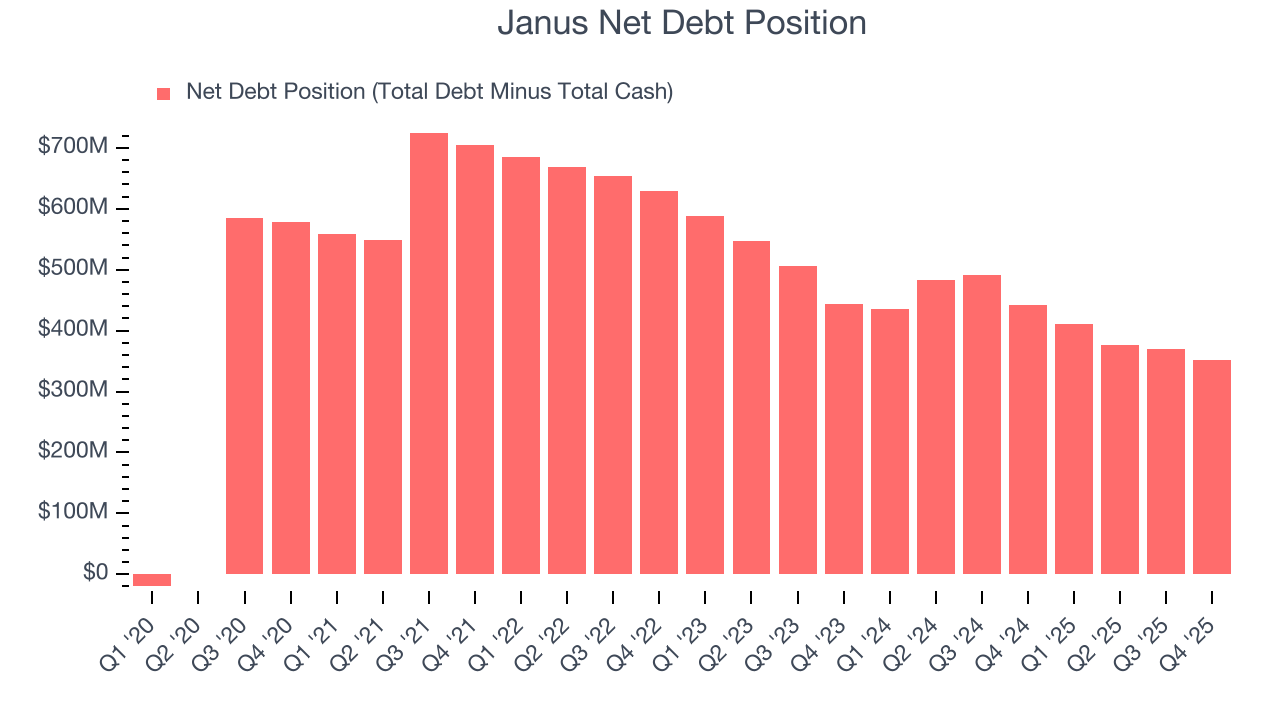
With $168.2 million of EBITDA over the last 12 months, we view Janus’s 2.1× net-debt-to-EBITDA ratio as safe. We also see its $19.2 million of annual interest expenses as appropriate. The company’s profits give it plenty of breathing room, allowing it to continue investing in growth initiatives.
12. Key Takeaways from Janus’s Q4 Results
We were impressed by how significantly Janus blew past analysts’ revenue expectations this quarter. We were also glad its full-year revenue guidance trumped Wall Street’s estimates. On the other hand, its EPS missed. Overall, we think this was still a solid quarter with some key areas of upside. Investors were likely hoping for more, and shares traded down 2.6% to $6.65 immediately after reporting.
13. Is Now The Time To Buy Janus?
Updated: March 26, 2026 at 10:57 PM EDT
Are you wondering whether to buy Janus or pass? We urge investors to not only consider the latest earnings results but also longer-term business quality and valuation as well.
Janus’s business quality ultimately falls short of our standards. Although its revenue growth was solid over the last five years, it’s expected to deteriorate over the next 12 months and its weak EPS growth over the last four years shows it’s failed to produce meaningful profits for shareholders. And while the company’s impressive operating margins show it has a highly efficient business model, the downside is its diminishing returns show management's prior bets haven't worked out.
Janus’s P/E ratio based on the next 12 months is 8.3x. While this valuation is optically cheap, the potential downside is big given its shaky fundamentals. We're fairly confident there are better stocks to buy right now.
Wall Street analysts have a consensus one-year price target of $8.15 on the company (compared to the current share price of $5.37).
Although the price target is bullish, readers should exercise caution because analysts tend to be overly optimistic. The firms they work for, often big banks, have relationships with companies that extend into fundraising, M&A advisory, and other rewarding business lines. As a result, they typically hesitate to say bad things for fear they will lose out. We at StockStory do not suffer from such conflicts of interest, so we’ll always tell it like it is.