
John Bean (JBTM)
John Bean piques our interest. Its revenue and EPS are projected to skyrocket next year, an optimistic sign for its share price.― StockStory Analyst Team
1. News


2. Summary
Why John Bean Is Interesting
Tracing back to its invention of the mechanical milk bottle filler in 1884, John Bean (NYSE:JBT) designs, manufactures, and sells equipment used for food processing and aviation.
- Market share will likely rise over the next 12 months as its expected revenue growth of 21.3% is robust
- Annual revenue growth of 12.2% over the last five years was superb and indicates its market share increased during this cycle
- One pitfall is its organic sales performance over the past two years indicates the company may need to make strategic adjustments or rely on M&A to catalyze faster growth


John Bean has the potential to be a high-quality business. If you’re a believer, the price looks reasonable.
Why Is Now The Time To Buy John Bean?


John Bean is trading at $154.24 per share, or 20.8x forward P/E. This multiple is lower than the broader industrials space, and we think it’s fair given the revenue growth.
This could be a good time to invest if you think there are underappreciated aspects of the business.
3. John Bean (JBTM) Research Report: Q3 CY2025 Update
Food processing and aviation equipment manufacturer John Bean (NYSE:JBT) announced better-than-expected revenue in Q3 CY2025, with sales up 121% year on year to $1.00 billion. The company’s full-year revenue guidance of $3.78 billion at the midpoint came in 1.9% above analysts’ estimates. Its non-GAAP profit of $1.94 per share was 28.9% above analysts’ consensus estimates.
John Bean (JBTM) Q3 CY2025 Highlights:
- Revenue: $1.00 billion vs analyst estimates of $934 million (121% year-on-year growth due to Marel acquisition, 7.2% beat)
- Adjusted EPS: $1.94 vs analyst estimates of $1.51 (28.9% beat)
- Adjusted EBITDA: $170.9 million vs analyst estimates of $146.3 million (17.1% margin, 16.8% beat)
- The company lifted its revenue guidance for the full year to $3.78 billion at the midpoint from $3.7 billion, a 2% increase
- Management raised its full-year Adjusted EPS guidance to $6.25 at the midpoint, a 7.8% increase
- EBITDA guidance for the full year is $597.5 million at the midpoint, above analyst estimates of $588 million
- Operating Margin: 10.2%, in line with the same quarter last year
- Free Cash Flow Margin: 5.6%, down from 14.5% in the same quarter last year
- Market Capitalization: $6.55 billion
Company Overview
Tracing back to its invention of the mechanical milk bottle filler in 1884, John Bean (NYSE:JBT) designs, manufactures, and sells equipment used for food processing and aviation.
John Bean Technologies (JBT) originated from the Bean Spray Pump Company, founded in 1884. Initially producing piston pumps for orchard insecticide applications, the company evolved significantly over the decades. In 1928, it was renamed Food Machinery Corporation (FMC) after acquiring Anderson-Barngrover and Sprague-Sells. FMC expanded into various industries, including aerospace, where it developed technologies for airport ground support. However, in 2023, JBT decided to sell its AeroTech segment as part of its strategic shift to focus entirely on becoming a pure-play provider of food and beverage solutions.
The company provides integrated solutions for the food industry, offering equipment for every stage of the food processing cycle. From primary processing, such as poultry overhead and conveyance systems, to further processing technologies like high-capacity industrial cookers and freezers, JBT supports the production of a variety of food products.
The company’s equipment portfolio extends to automated systems, including robotic automated guided vehicle systems used in various industries for material movement, enhancing operational efficiency and productivity. JBT's automated systems are utilized in industries such as automotive and food and beverage, where precision and reliability are critical. These systems are designed to optimize material handling, reduce labor costs, and improve workplace safety, making them essential in modern manufacturing and warehousing operations.
JBT also generates significant recurring revenue through aftermarket services, which include parts supply, maintenance, and rebuild services for customer-owned equipment. An example of its aftermarket offerings is the OmniBlu™ digital solution, a subscription service that combines service, parts availability, and machine optimization, powered by AI and machine learning. This focus on providing continuous and proactive service strengthens JBT's revenue streams, providing steady income and improved customer retention.
4. General Industrial Machinery
Automation that increases efficiency and connected equipment that collects analyzable data have been trending, creating new demand for general industrial machinery companies. Those who innovate and create digitized solutions can spur sales and speed up replacement cycles, but all general industrial machinery companies are still at the whim of economic cycles. Consumer spending and interest rates, for example, can greatly impact the industrial production that drives demand for these companies’ offerings.
Competitors offering similar products include Middleby (NASDAQ:MIDD), Illinois Tool Works (NYSE:ITW), and Colfax (NYSE:CFX).
5. Revenue Growth
A company’s long-term sales performance is one signal of its overall quality. Any business can have short-term success, but a top-tier one grows for years. Thankfully, John Bean’s 12.2% annualized revenue growth over the last five years was excellent. Its growth beat the average industrials company and shows its offerings resonate with customers.
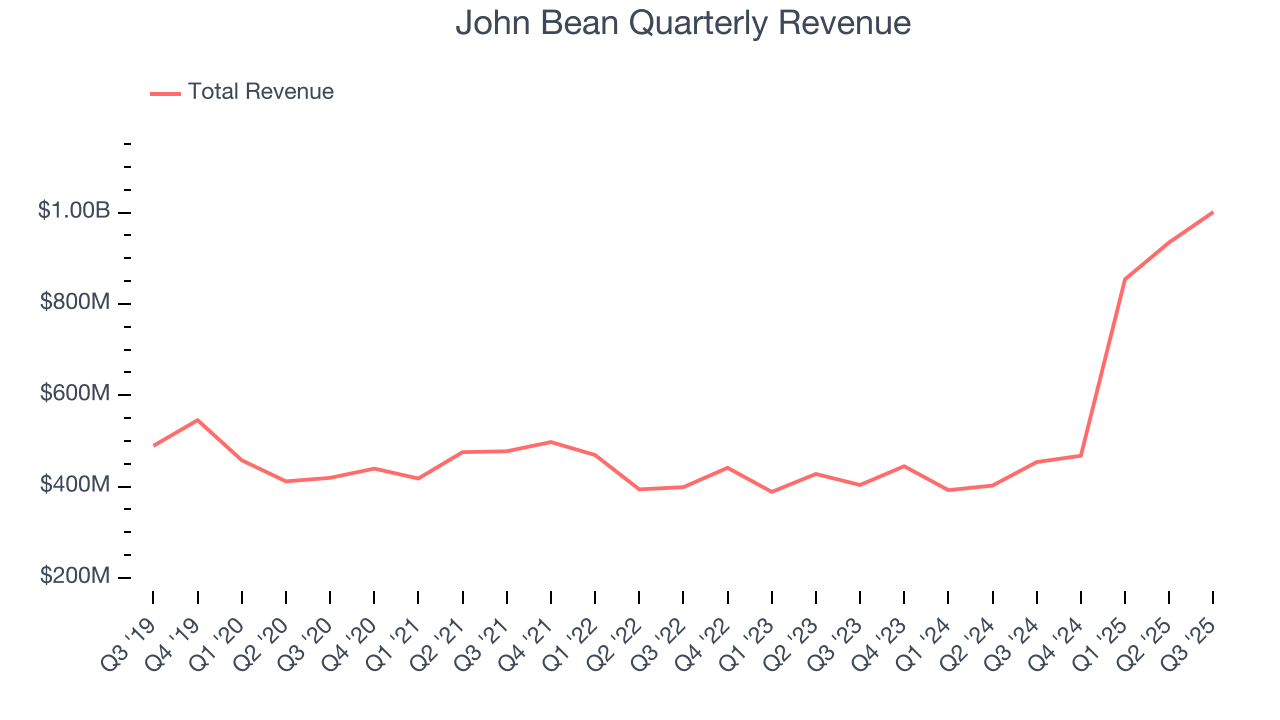
Long-term growth is the most important, but within industrials, a half-decade historical view may miss new industry trends or demand cycles. John Bean’s annualized revenue growth of 40% over the last two years is above its five-year trend, suggesting its demand was strong and recently accelerated.
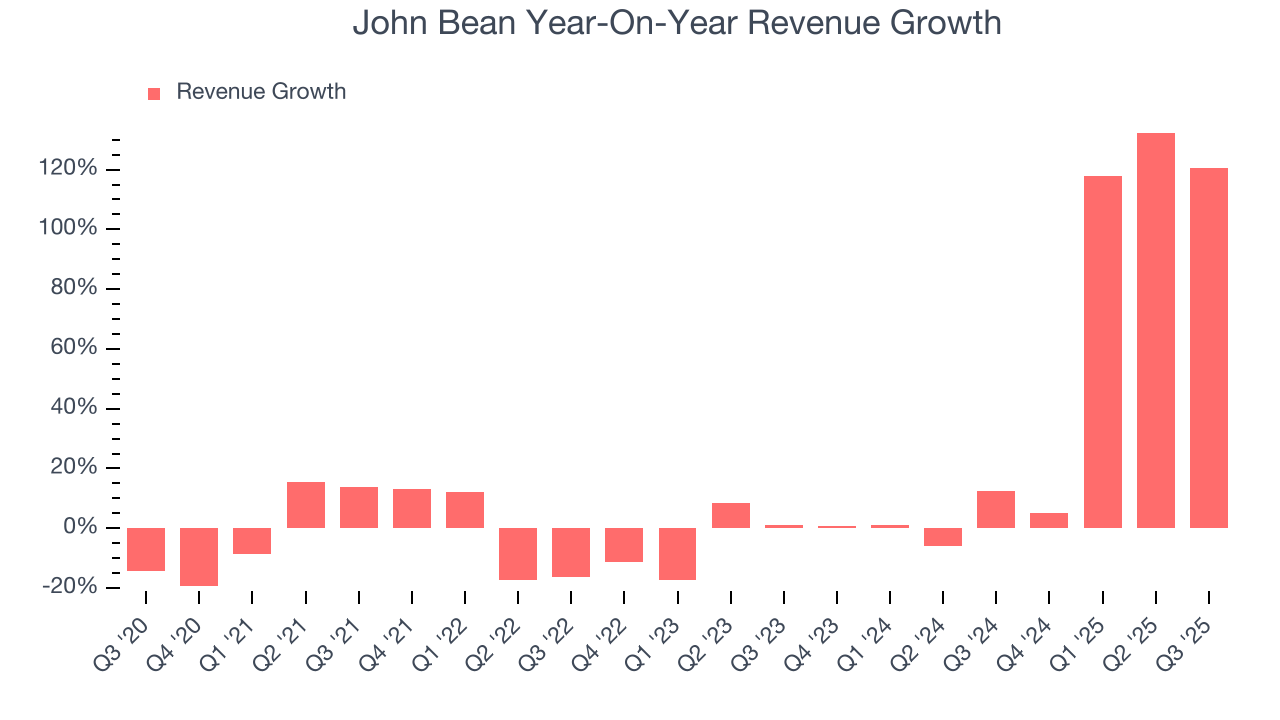
This quarter, John Bean reported magnificent year-on-year revenue growth of 121% due to the Marel acquisition that closed earlier this year, and its $1.00 billion of revenue beat Wall Street’s estimates by 7.2%.
Looking ahead, sell-side analysts expect revenue to grow 17.9% over the next 12 months, a deceleration versus the last two years. Still, this projection is admirable and suggests the market sees success for its products and services.
6. Gross Margin & Pricing Power
John Bean’s gross margin is good compared to other industrials businesses and signals it sells differentiated products, not commodities. As you can see below, it averaged an impressive 34.8% gross margin over the last five years. That means for every $100 in revenue, roughly $34.79 was left to spend on selling, marketing, R&D, and general administrative overhead. 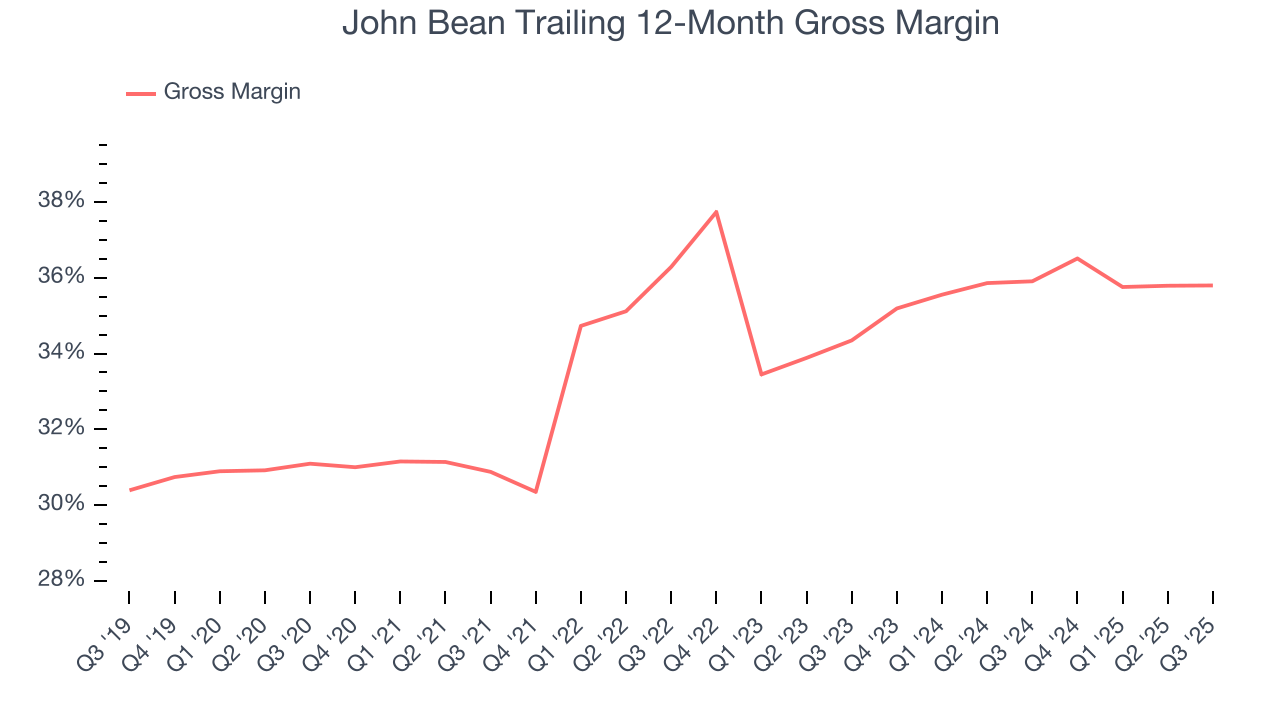
In Q3, John Bean produced a 35.9% gross profit margin, in line with the same quarter last year. On a wider time horizon, the company’s full-year margin has remained steady over the past four quarters, suggesting its input costs (such as raw materials and manufacturing expenses) have been stable and it isn’t under pressure to lower prices.
7. Operating Margin
Operating margin is one of the best measures of profitability because it tells us how much money a company takes home after procuring and manufacturing its products, marketing and selling those products, and most importantly, keeping them relevant through research and development.
John Bean was profitable over the last five years but held back by its large cost base. Its average operating margin of 7.3% was weak for an industrials business. This result is surprising given its high gross margin as a starting point.
Looking at the trend in its profitability, John Bean’s operating margin decreased by 5.3 percentage points over the last five years. This raises questions about the company’s expense base because its revenue growth should have given it leverage on its fixed costs, resulting in better economies of scale and profitability. John Bean’s performance was poor no matter how you look at it - it shows that costs were rising and it couldn’t pass them onto its customers.
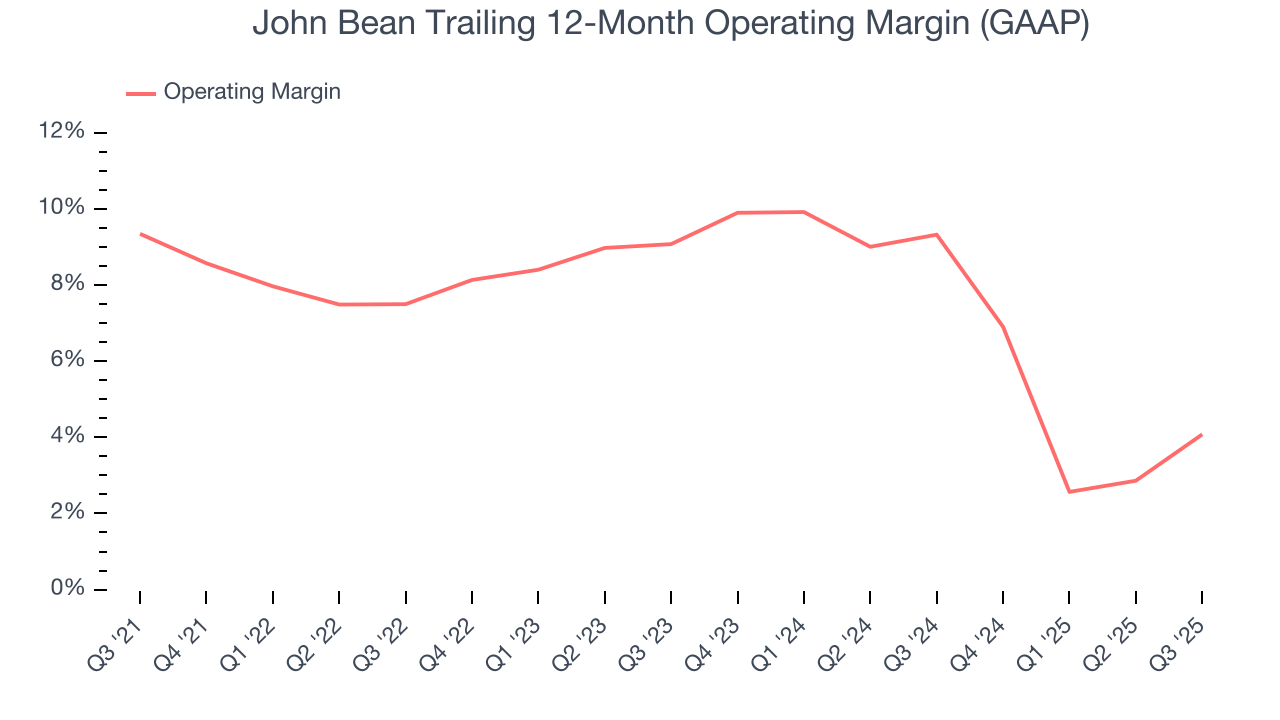
In Q3, John Bean generated an operating margin profit margin of 10.2%, in line with the same quarter last year. This indicates the company’s cost structure has recently been stable.
8. Earnings Per Share
We track the long-term change in earnings per share (EPS) for the same reason as long-term revenue growth. Compared to revenue, however, EPS highlights whether a company’s growth is profitable.
John Bean’s EPS grew at an unimpressive 6.6% compounded annual growth rate over the last five years, lower than its 12.2% annualized revenue growth. However, its operating margin actually improved during this time, telling us that non-fundamental factors such as interest expenses and taxes affected its ultimate earnings.
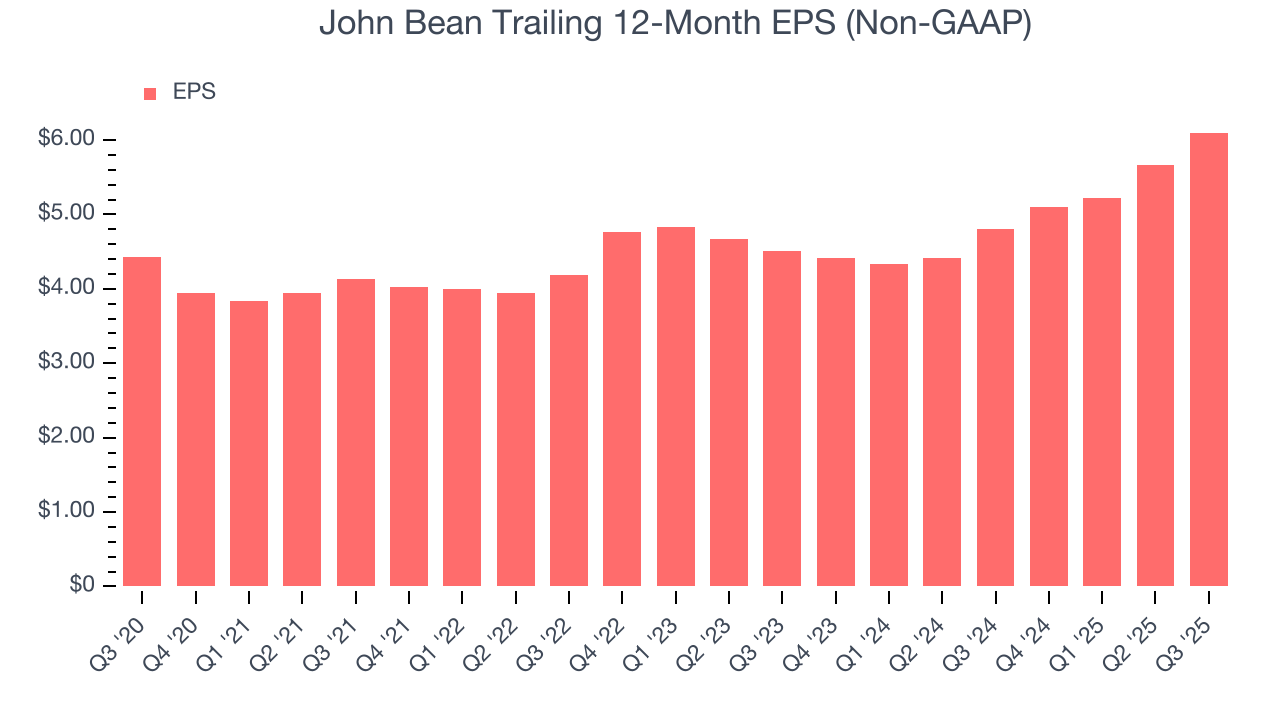
We can take a deeper look into John Bean’s earnings to better understand the drivers of its performance. As we mentioned earlier, John Bean’s operating margin was flat this quarter but declined by 5.3 percentage points over the last five years. Its share count also grew by 62.9%, meaning the company not only became less efficient with its operating expenses but also diluted its shareholders. 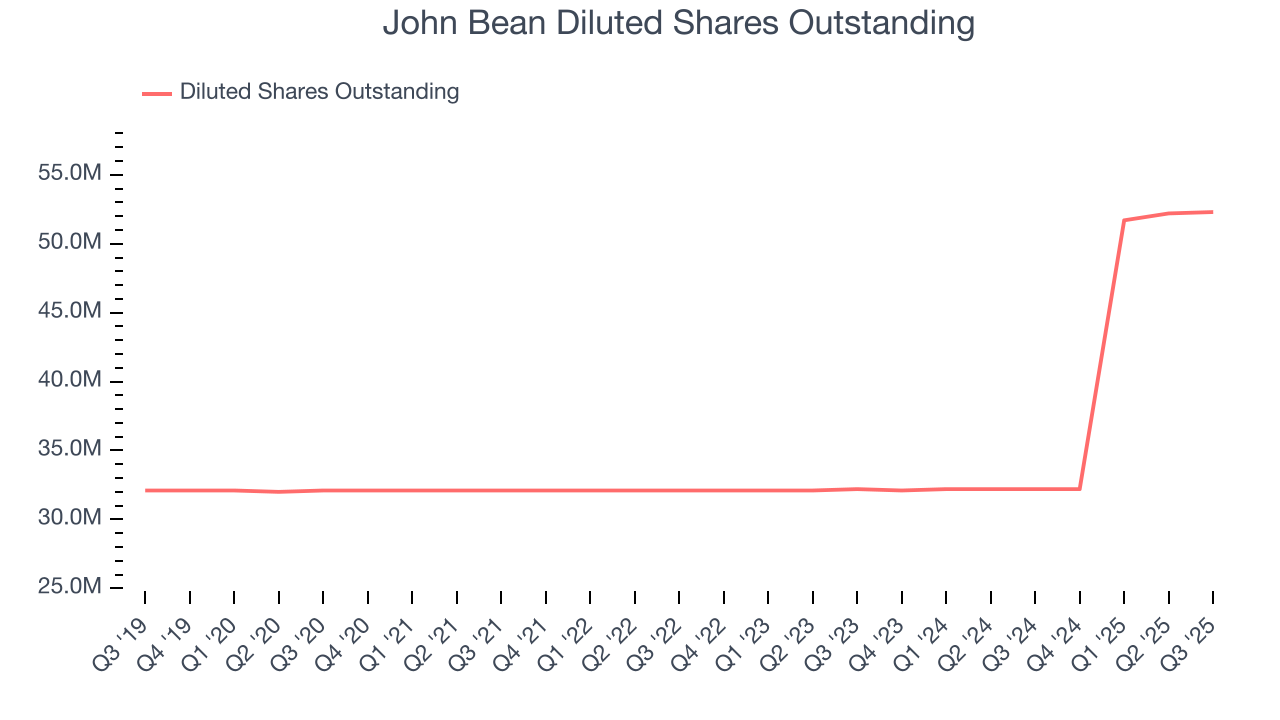
Like with revenue, we analyze EPS over a more recent period because it can provide insight into an emerging theme or development for the business.
For John Bean, its two-year annual EPS growth of 16.3% was higher than its five-year trend. This acceleration made it one of the faster-growing industrials companies in recent history.
In Q3, John Bean reported adjusted EPS of $1.94, up from $1.50 in the same quarter last year. This print easily cleared analysts’ estimates, and shareholders should be content with the results. Over the next 12 months, Wall Street expects John Bean’s full-year EPS of $6.10 to grow 17.2%.
9. Cash Is King
Free cash flow isn't a prominently featured metric in company financials and earnings releases, but we think it's telling because it accounts for all operating and capital expenses, making it tough to manipulate. Cash is king.
John Bean has shown impressive cash profitability, enabling it to ride out cyclical downturns more easily while maintaining its investments in new and existing offerings. The company’s free cash flow margin averaged 8.4% over the last five years, better than the broader industrials sector. The divergence from its underwhelming operating margin stems from the add-back of non-cash charges like depreciation and stock-based compensation. GAAP operating profit expenses these line items, but free cash flow does not.
Taking a step back, we can see that John Bean’s margin dropped by 3.5 percentage points during that time. Continued declines could signal it is in the middle of an investment cycle.
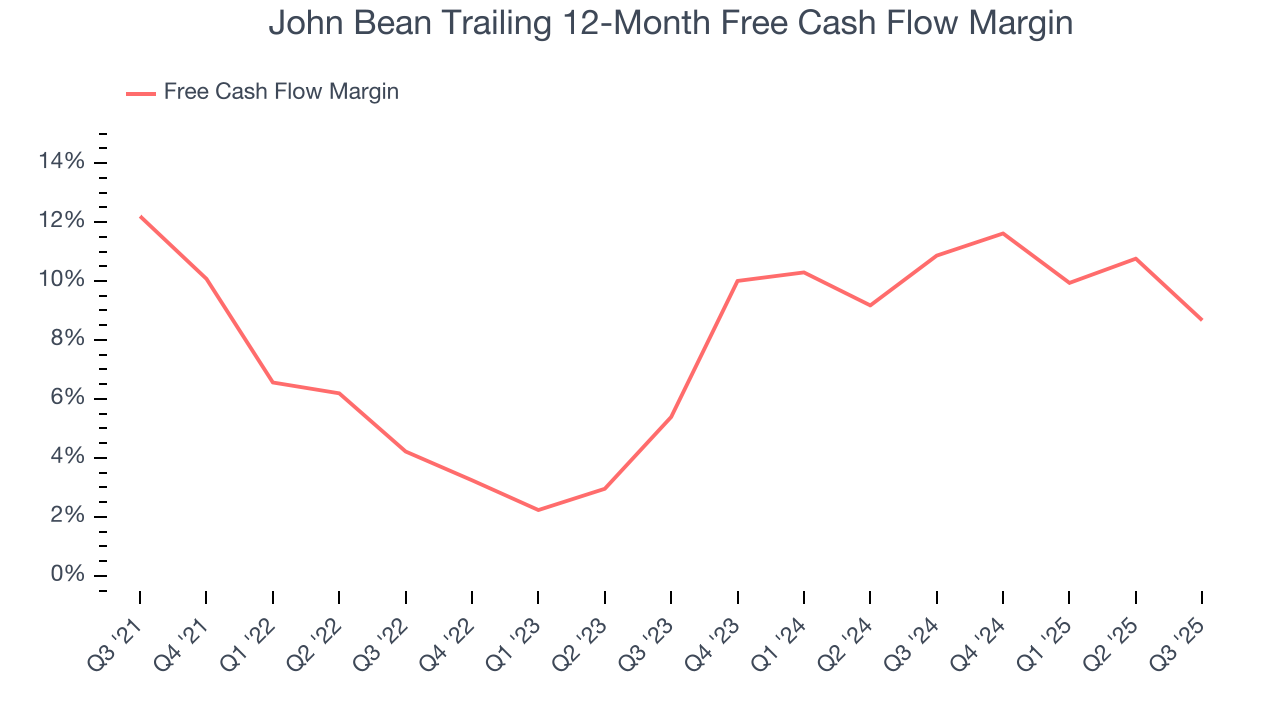
John Bean’s free cash flow clocked in at $56.5 million in Q3, equivalent to a 5.6% margin. The company’s cash profitability regressed as it was 8.8 percentage points lower than in the same quarter last year, which isn’t ideal considering its longer-term trend.
10. Return on Invested Capital (ROIC)
EPS and free cash flow tell us whether a company was profitable while growing its revenue. But was it capital-efficient? A company’s ROIC explains this by showing how much operating profit it makes compared to the money it has raised (debt and equity).
John Bean historically did a mediocre job investing in profitable growth initiatives. Its five-year average ROIC was 7.1%, somewhat low compared to the best industrials companies that consistently pump out 20%+.
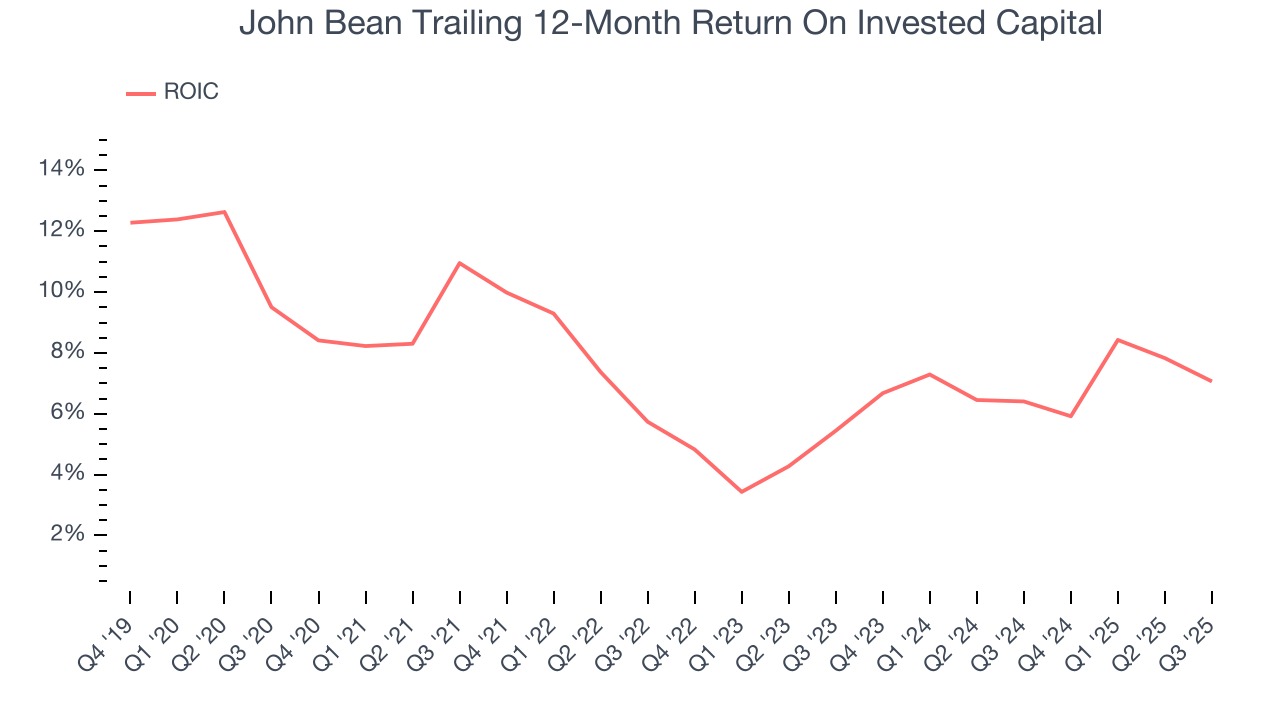
We like to invest in businesses with high returns, but the trend in a company’s ROIC is what often surprises the market and moves the stock price. Unfortunately, John Bean’s ROIC averaged 1.6 percentage point decreases over the last few years. Paired with its already low returns, these declines suggest its profitable growth opportunities are few and far between.
11. Balance Sheet Assessment
John Bean reported $133.3 million of cash and $1.91 billion of debt on its balance sheet in the most recent quarter. As investors in high-quality companies, we primarily focus on two things: 1) that a company’s debt level isn’t too high and 2) that its interest payments are not excessively burdening the business.
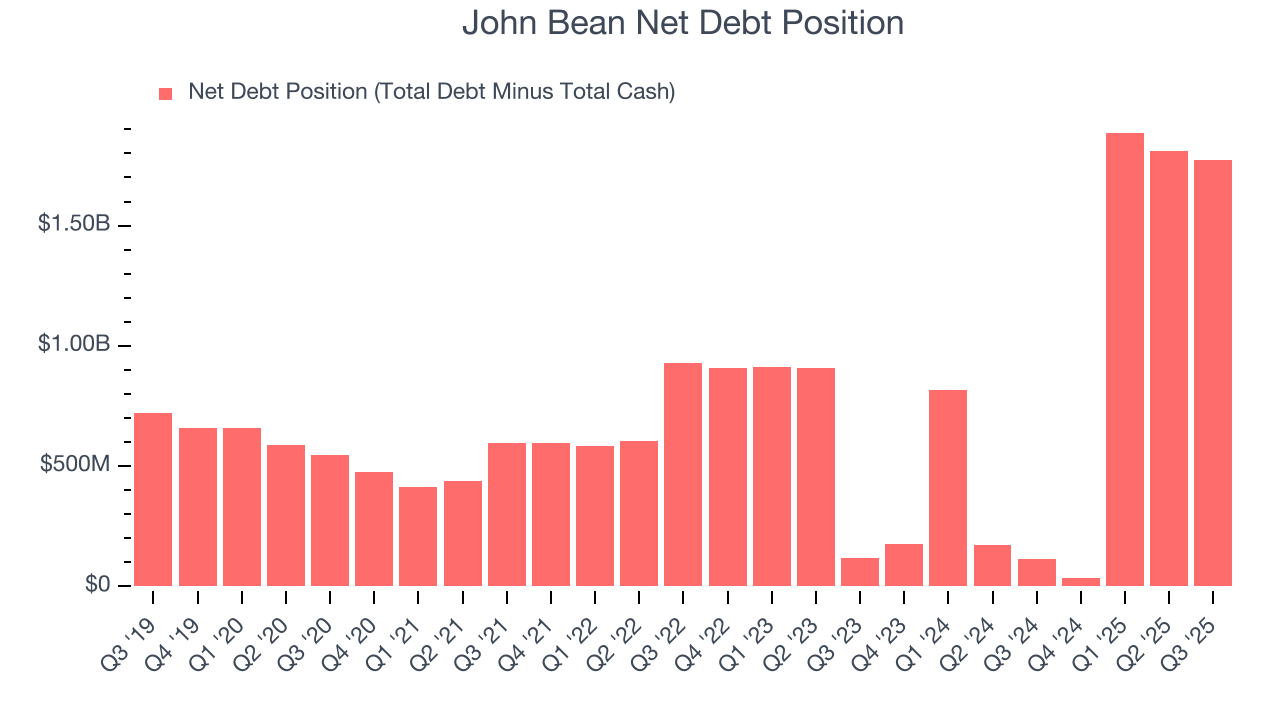
With $531.4 million of EBITDA over the last 12 months, we view John Bean’s 3.3× net-debt-to-EBITDA ratio as safe. We also see its $50.6 million of annual interest expenses as appropriate. The company’s profits give it plenty of breathing room, allowing it to continue investing in growth initiatives.
12. Key Takeaways from John Bean’s Q3 Results
It was good to see John Bean beat analysts’ EPS expectations this quarter. We were also excited its EBITDA outperformed Wall Street’s estimates by a wide margin. Zooming out, we think this was a solid print. The stock remained flat at $124.62 immediately after reporting.
13. Is Now The Time To Buy John Bean?
Updated: January 24, 2026 at 10:56 PM EST
The latest quarterly earnings matters, sure, but we actually think longer-term fundamentals and valuation matter more. Investors should consider all these pieces before deciding whether or not to invest in John Bean.
There are some positives when it comes to John Bean’s fundamentals. First off, its revenue growth was impressive over the last five years and is expected to accelerate over the next 12 months. And while its declining operating margin shows the business has become less efficient, its projected EPS for the next year implies the company’s fundamentals will improve. On top of that, its gross margins indicate healthy unit economics.
John Bean’s P/E ratio based on the next 12 months is 20.8x. Looking at the industrials landscape right now, John Bean trades at a pretty interesting price. If you believe in the company and its growth potential, now is an opportune time to buy shares.
Wall Street analysts have a consensus one-year price target of $160.25 on the company (compared to the current share price of $154.24), implying they see 3.9% upside in buying John Bean in the short term.