Kadant (KAI)
We’re cautious of Kadant. Its weak sales growth and declining returns on capital show its demand and profits are shrinking.― StockStory Analyst Team
1. News


2. Summary
Why Kadant Is Not Exciting
Headquartered in Massachusetts, Kadant (NYSE:KAI) is a global supplier of high-value, critical components and engineered systems used in process industries worldwide.
- A consolation is that its offerings are difficult to replicate at scale and lead to a top-tier gross margin of 44.1%


Kadant doesn’t meet our quality standards. We’re hunting for superior stocks elsewhere.
Why There Are Better Opportunities Than Kadant


At $294.31 per share, Kadant trades at 26.1x forward P/E. This multiple is higher than that of industrials peers; it’s also rich for the business quality. Not a great combination.
There are stocks out there featuring similar valuation multiples with better fundamentals. We prefer to invest in those.
3. Kadant (KAI) Research Report: Q4 CY2025 Update
Industrial equipment manufacturer Kadant (NYSE:KAI) reported revenue ahead of Wall Street’s expectations in Q4 CY2025, with sales up 10.9% year on year to $286.2 million. Guidance for next quarter’s revenue was better than expected at $275 million at the midpoint, 1% above analysts’ estimates. Its non-GAAP profit of $2.27 per share was 3.5% above analysts’ consensus estimates.
Kadant (KAI) Q4 CY2025 Highlights:
- Revenue: $286.2 million vs analyst estimates of $274.4 million (10.9% year-on-year growth, 4.3% beat)
- Adjusted EPS: $2.27 vs analyst estimates of $2.19 (3.5% beat)
- Adjusted EBITDA: $57.99 million vs analyst estimates of $51.78 million (20.3% margin, 12% beat)
- Revenue Guidance for Q1 CY2026 is $275 million at the midpoint, above analyst estimates of $272.2 million
- Adjusted EPS guidance for the upcoming financial year 2026 is $10.58 at the midpoint, beating analyst estimates by 3.2%
- Operating Margin: 13.9%, in line with the same quarter last year
- Free Cash Flow Margin: 19.1%, up from 17.9% in the same quarter last year
- Market Capitalization: $3.93 billion
Company Overview
Headquartered in Massachusetts, Kadant (NYSE:KAI) is a global supplier of high-value, critical components and engineered systems used in process industries worldwide.
The company was founded as Thermo Fibrotek in 1991 as a subsidiary of Thermo Electron, aimed at focusing on the development of technologies for the pulp and paper industry. In 2001, Thermo Electron spun out Thermo Fibrotek and the company changed its name to Kadant.
Initially concentrating on papermaking equipment, Kadant has grown significantly through strategic acquisitions to broaden its product offerings and capabilities. Over the years, the company expanded into industries such as recycling, resource management, and fluid handling. For instance, in 1997 the company completed an acquisition of Black Clawson, a company specializing in stock preparation and chemical pulping.
Today Kadant offers engineered products and systems designed to improve efficiency in process industries. Its product lines include fluid-handling systems crucial for industrial operations, advanced filtration technologies, and process equipment essential for paper, food, and recycling sectors. Additionally, Kadant provides solutions like rotary joints, siphons, and doctoring systems that enhance production in sectors such as papermaking and packaging.
Kadant's products are distributed globally through a mix of direct sales and a network of independent agents and distributors for a broad market reach. Revenue at Kadant is generated primarily through the sale of equipment and systems, supplemented by aftermarket services such as parts supply and maintenance, which provide recurring income.
Kadant's acquisition strategy is a key component of its growth model, focusing on integrating businesses and technologies that complement or extend its current product offerings or that enable entry into new process industries. This approach involves targeted acquisitions that are strategically aligned with its core operations, as seen with the recent acquisitions of Key Knife and KWS Manufacturing Company, which expanded Kadant's product line in the industrial processing and material handling segments. Central to Kadant's acquisition philosophy is a decentralized operating model which empowers acquired companies to remain agile and responsive, benefiting from the broader company’s resources, while maintaining operational independence.
4. General Industrial Machinery
Automation that increases efficiency and connected equipment that collects analyzable data have been trending, creating new demand for general industrial machinery companies. Those who innovate and create digitized solutions can spur sales and speed up replacement cycles, but all general industrial machinery companies are still at the whim of economic cycles. Consumer spending and interest rates, for example, can greatly impact the industrial production that drives demand for these companies’ offerings.
Competitors offering similar products include Albany (NYSE:AIN), RBC Bearings (NYSE:RBC), and Valmet (HEL:VALMT)
5. Revenue Growth
A company’s long-term performance is an indicator of its overall quality. Any business can put up a good quarter or two, but many enduring ones grow for years. Thankfully, Kadant’s 10.6% annualized revenue growth over the last five years was impressive. Its growth beat the average industrials company and shows its offerings resonate with customers.
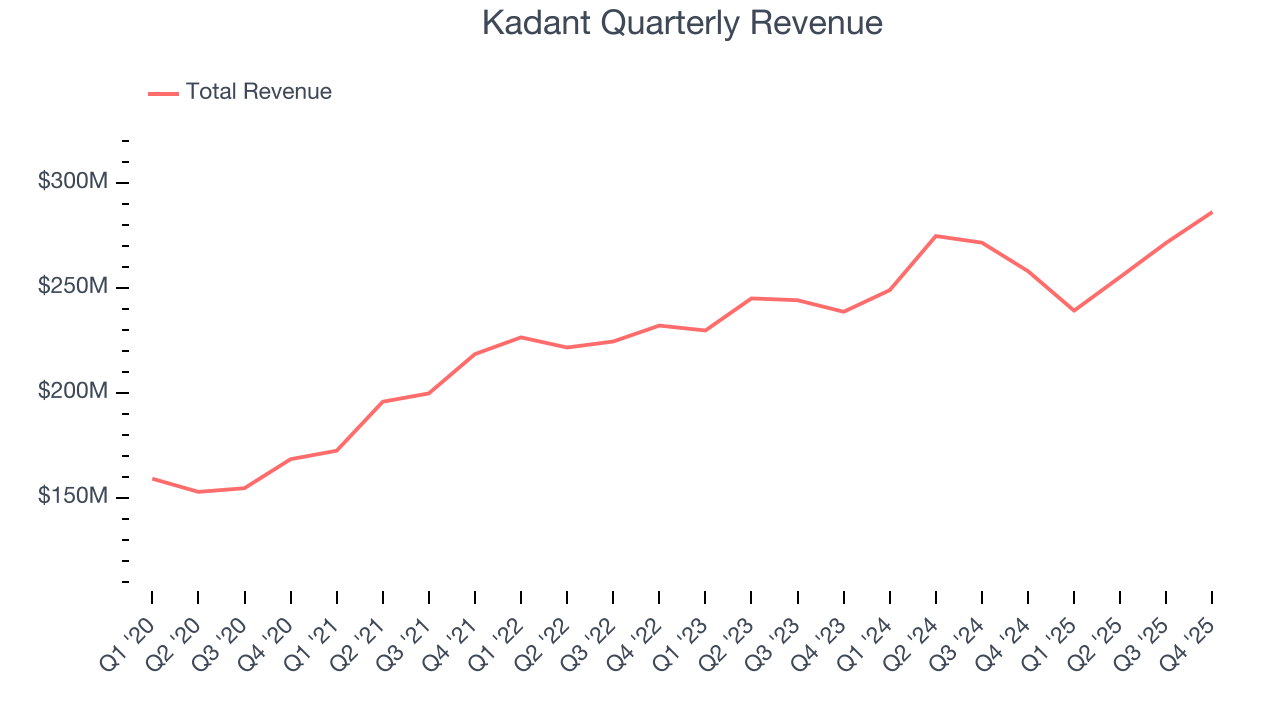
Long-term growth is the most important, but within industrials, a half-decade historical view may miss new industry trends or demand cycles. Kadant’s recent performance shows its demand has slowed significantly as its annualized revenue growth of 4.8% over the last two years was well below its five-year trend. 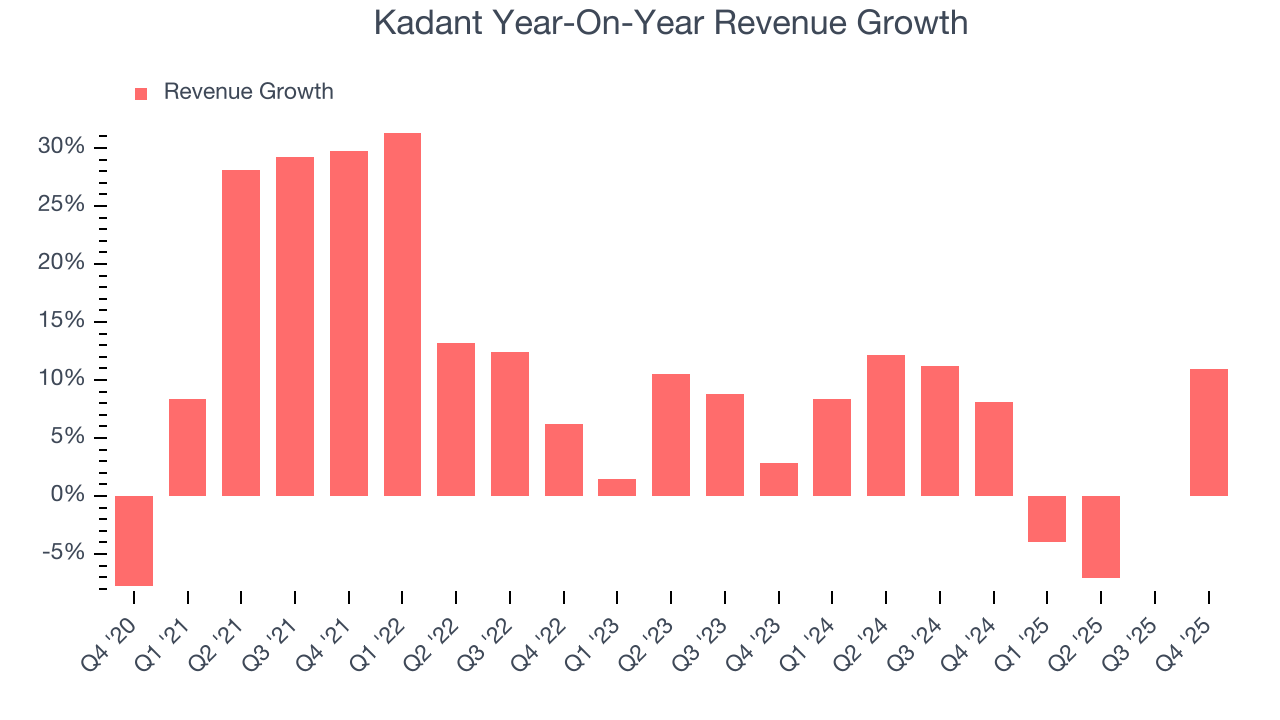
Kadant also breaks out the revenue for its three most important segments: Fluid Handling, Industrial Processing, and Material Handling, which are 34.8%, 41.1%, and 24.1% of revenue. Over the last two years, Kadant’s Fluid Handling (piping, cleaning, and filtration) and Material Handling (wood production equipment) revenues averaged 4.3% and 11.1% year-on-year growth while its Industrial Processing revenue (paper and timber processing equipment) was flat. 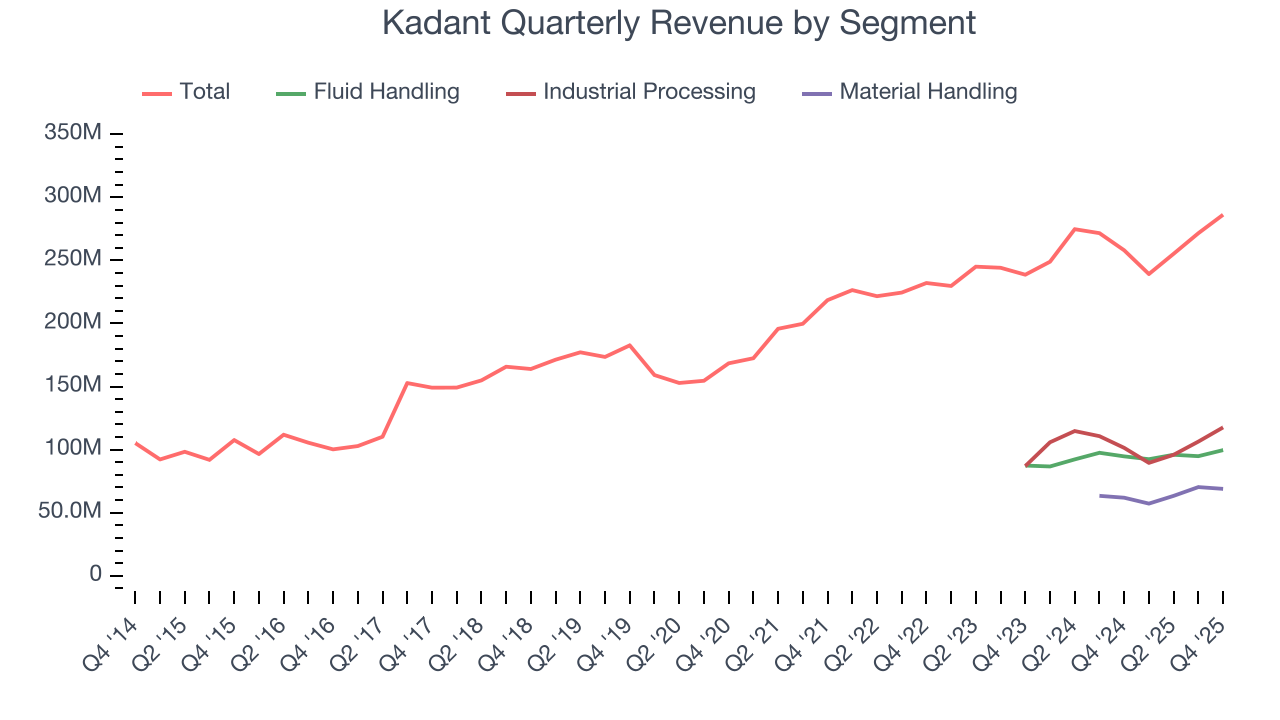
This quarter, Kadant reported year-on-year revenue growth of 10.9%, and its $286.2 million of revenue exceeded Wall Street’s estimates by 4.3%. Company management is currently guiding for a 15% year-on-year increase in sales next quarter.
Looking further ahead, sell-side analysts expect revenue to grow 10.2% over the next 12 months, an improvement versus the last two years. This projection is noteworthy and indicates its newer products and services will fuel better top-line performance.
6. Gross Margin & Pricing Power
All else equal, we prefer higher gross margins because they make it easier to generate more operating profits and indicate that a company commands pricing power by offering more differentiated products.
Kadant has best-in-class unit economics for an industrials company, enabling it to invest in areas such as research and development. Its margin also signals it sells differentiated products, not commodities. As you can see below, it averaged an elite 44.1% gross margin over the last five years. Said differently, roughly $44.06 was left to spend on selling, marketing, R&D, and general administrative overhead for every $100 in revenue. 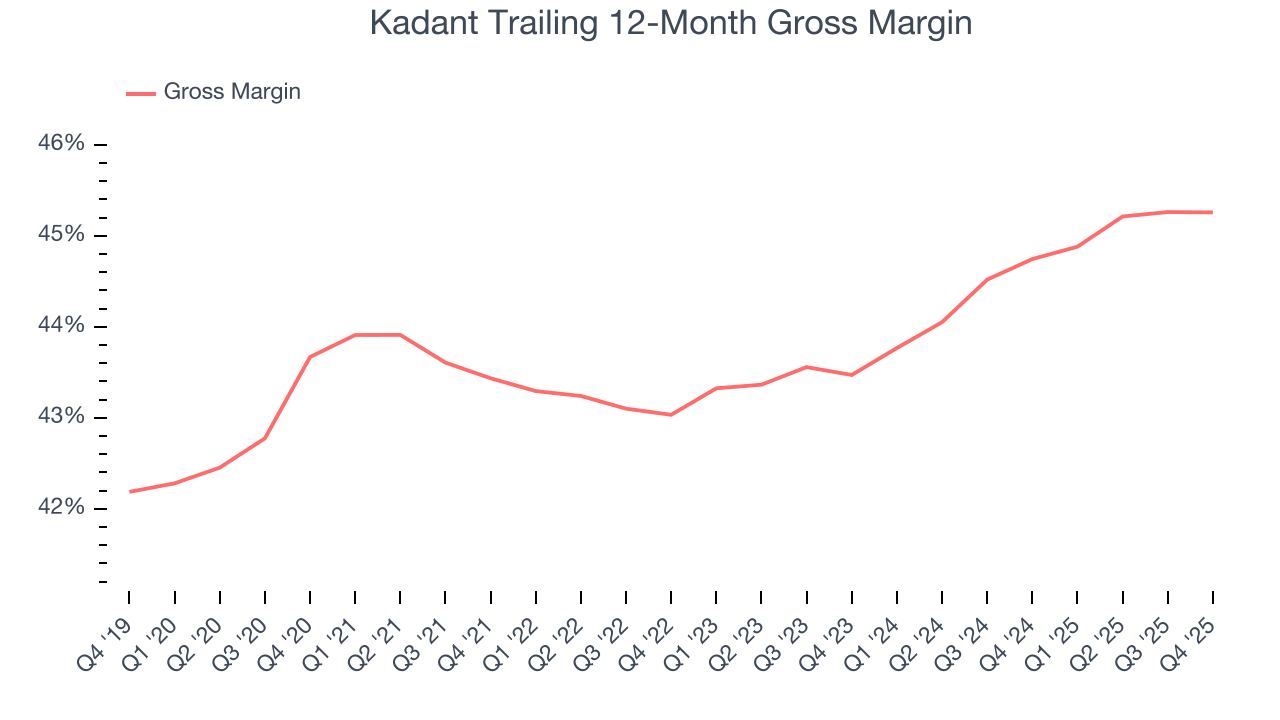
Kadant’s gross profit margin came in at 43.9% this quarter, in line with the same quarter last year. Zooming out, the company’s full-year margin has remained steady over the past 12 months, suggesting its input costs (such as raw materials and manufacturing expenses) have been stable and it isn’t under pressure to lower prices.
7. Operating Margin
Operating margin is an important measure of profitability as it shows the portion of revenue left after accounting for all core expenses – everything from the cost of goods sold to advertising and wages. It’s also useful for comparing profitability across companies with different levels of debt and tax rates because it excludes interest and taxes.
Kadant’s operating margin might fluctuated slightly over the last 12 months but has remained more or less the same, averaging 16.5% over the last five years. This profitability was elite for an industrials business thanks to its efficient cost structure and economies of scale. This result isn’t surprising as its high gross margin gives it a favorable starting point.
Looking at the trend in its profitability, Kadant’s operating margin might fluctuated slightly but has generally stayed the same over the last five years. This raises questions about the company’s expense base because its revenue growth should have given it leverage on its fixed costs, resulting in better economies of scale and profitability.
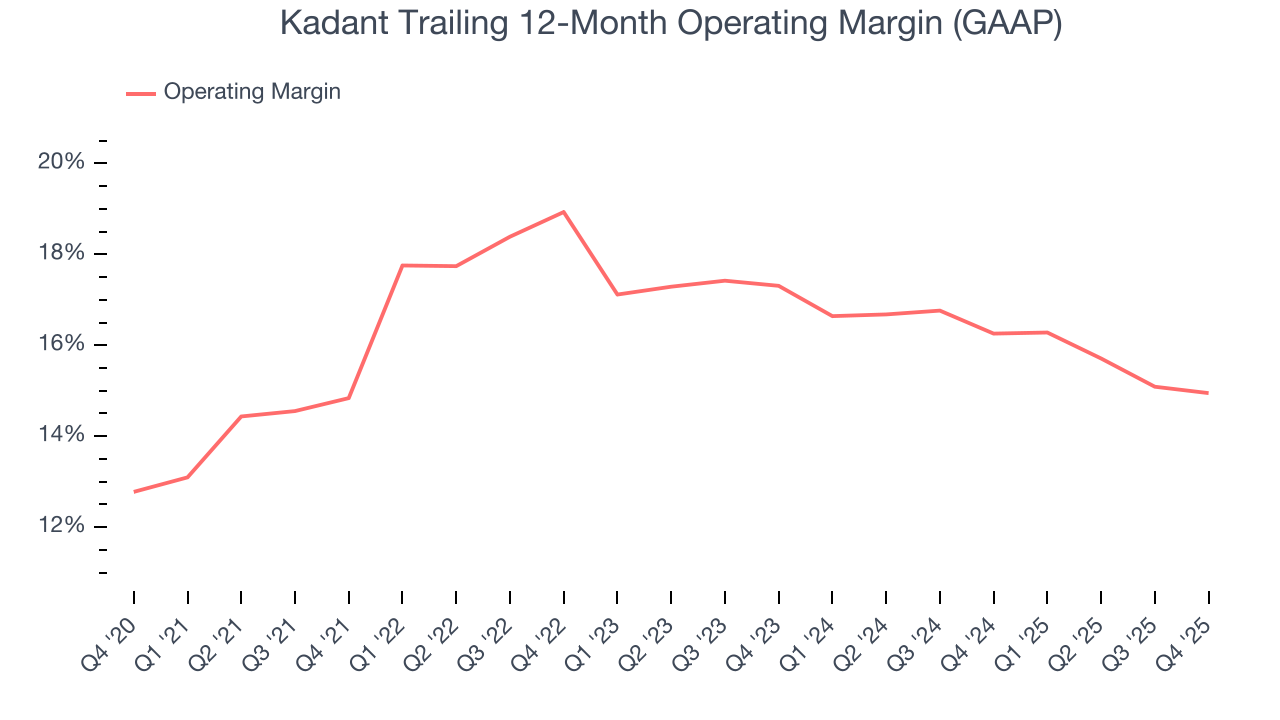
This quarter, Kadant generated an operating margin profit margin of 13.9%, in line with the same quarter last year. This indicates the company’s cost structure has recently been stable.
8. Earnings Per Share
Revenue trends explain a company’s historical growth, but the long-term change in earnings per share (EPS) points to the profitability of that growth – for example, a company could inflate its sales through excessive spending on advertising and promotions.
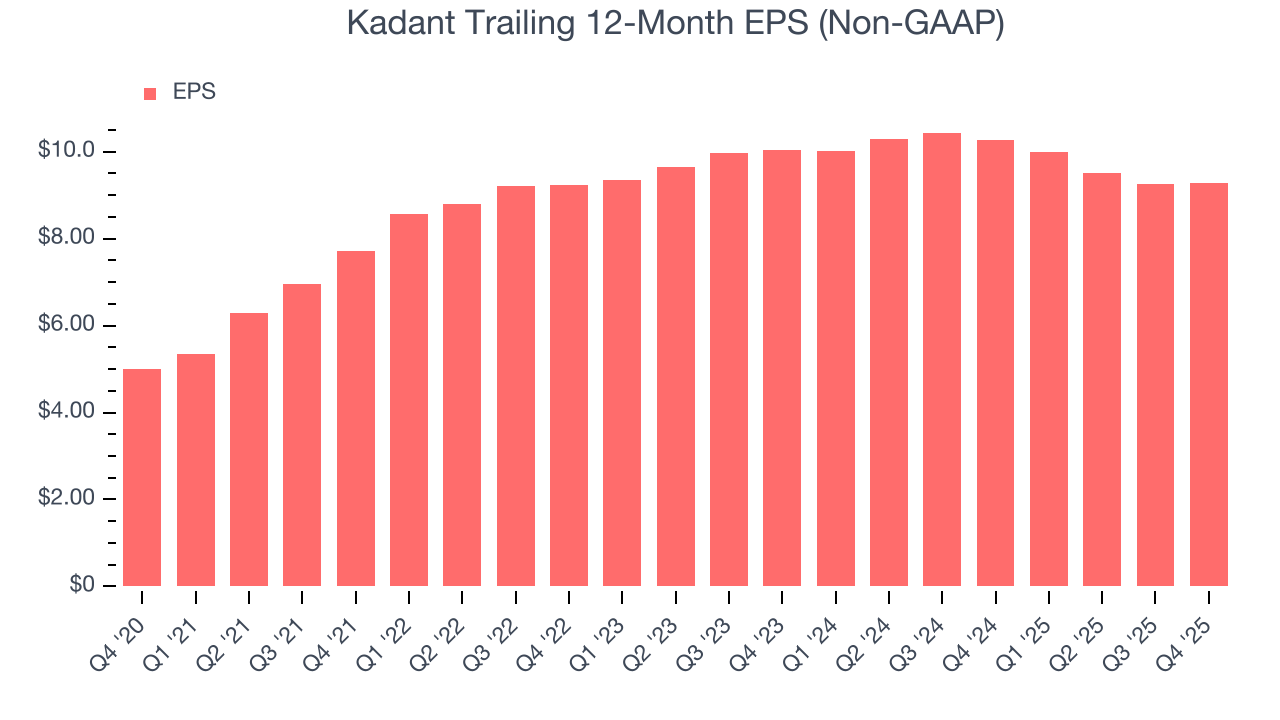
Kadant’s EPS grew at a remarkable 13.1% compounded annual growth rate over the last five years, higher than its 10.6% annualized revenue growth. However, we take this with a grain of salt because its operating margin didn’t improve and it didn’t repurchase its shares, meaning the delta came from reduced interest expenses or taxes.
Like with revenue, we analyze EPS over a shorter period to see if we are missing a change in the business.
Kadant’s two-year annual EPS declines of 3.9% were bad and lower than its 4.8% two-year revenue growth.
We can take a deeper look into Kadant’s earnings to better understand the drivers of its performance. While we mentioned earlier that Kadant’s operating margin was flat this quarter, a two-year view shows its margin has declined. This was the most relevant factor (aside from the revenue impact) behind its lower earnings; interest expenses and taxes can also affect EPS but don’t tell us as much about a company’s fundamentals.
In Q4, Kadant reported adjusted EPS of $2.27, up from $2.25 in the same quarter last year. This print beat analysts’ estimates by 3.5%. Over the next 12 months, Wall Street expects Kadant’s full-year EPS of $9.27 to grow 10%.
9. Cash Is King
If you’ve followed StockStory for a while, you know we emphasize free cash flow. Why, you ask? We believe that in the end, cash is king, and you can’t use accounting profits to pay the bills.
Kadant has shown terrific cash profitability, putting it in an advantageous position to invest in new products, return capital to investors, and consolidate the market during industry downturns. The company’s free cash flow margin was among the best in the industrials sector, averaging 13.6% over the last five years.
Taking a step back, we can see that Kadant’s margin dropped by 4.4 percentage points during that time. If its declines continue, it could signal increasing investment needs and capital intensity.
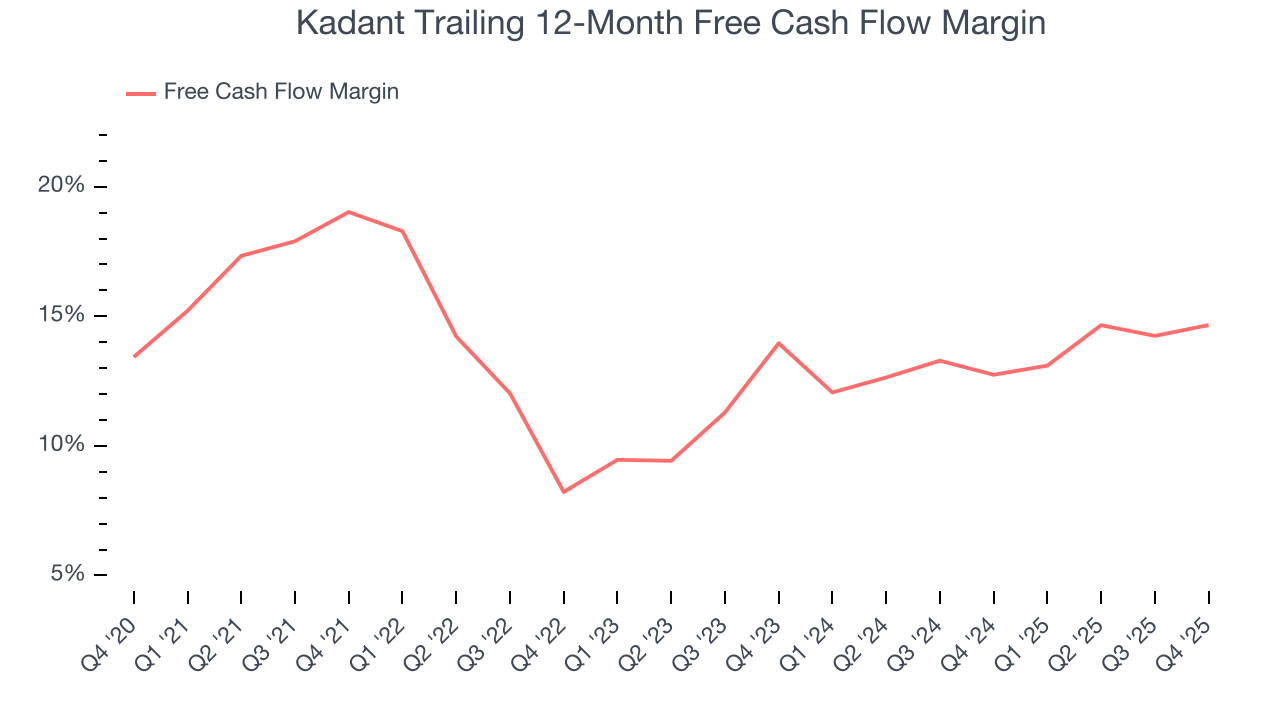
Kadant’s free cash flow clocked in at $54.71 million in Q4, equivalent to a 19.1% margin. This result was good as its margin was 1.2 percentage points higher than in the same quarter last year, but we wouldn’t put too much weight on the short term because investment needs can be seasonal, causing temporary swings. Long-term trends carry greater meaning.
10. Return on Invested Capital (ROIC)
EPS and free cash flow tell us whether a company was profitable while growing its revenue. But was it capital-efficient? Enter ROIC, a metric showing how much operating profit a company generates relative to the money it has raised (debt and equity).
Although Kadant hasn’t been the highest-quality company lately, it historically found a few growth initiatives that worked. Its five-year average ROIC was 13.2%, higher than most industrials businesses.
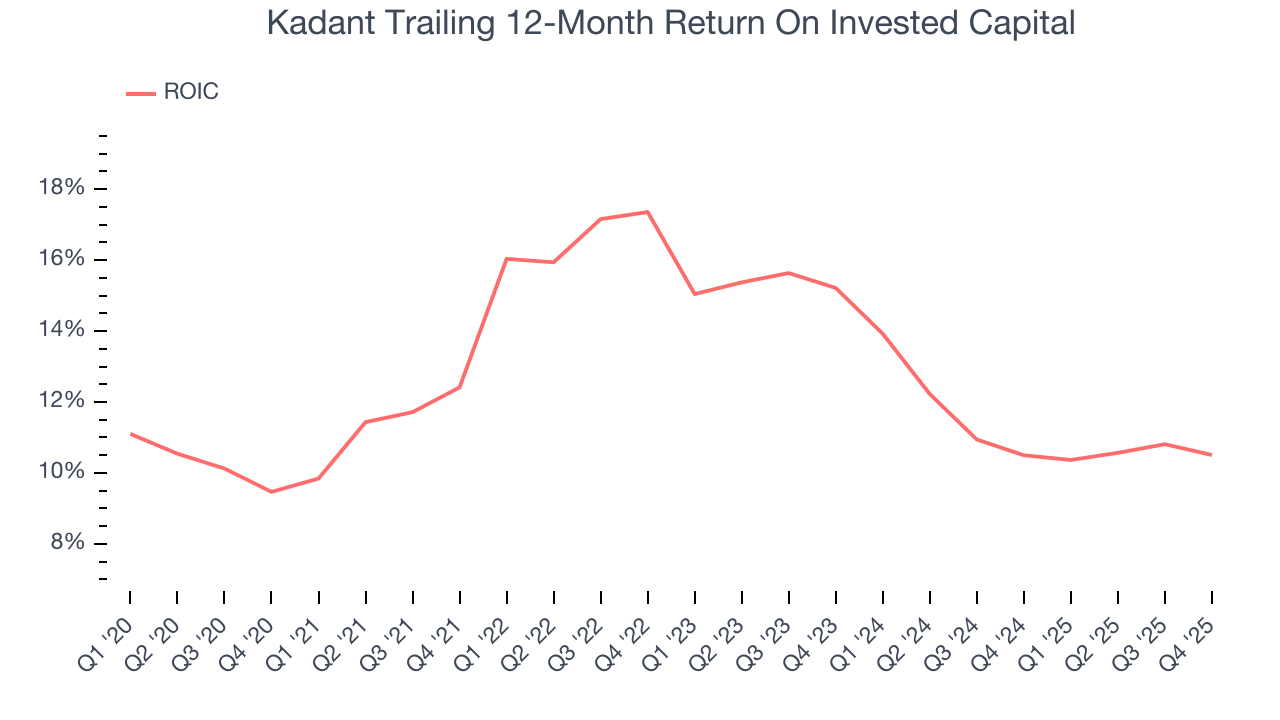
We like to invest in businesses with high returns, but the trend in a company’s ROIC is what often surprises the market and moves the stock price. On average, Kadant’s ROIC decreased by 4.4 percentage points annually each year over the last few years. We like what management has done in the past, but its declining returns are perhaps a symptom of fewer profitable growth opportunities.
11. Balance Sheet Assessment
Kadant reported $122.7 million of cash and $374.5 million of debt on its balance sheet in the most recent quarter. As investors in high-quality companies, we primarily focus on two things: 1) that a company’s debt level isn’t too high and 2) that its interest payments are not excessively burdening the business.
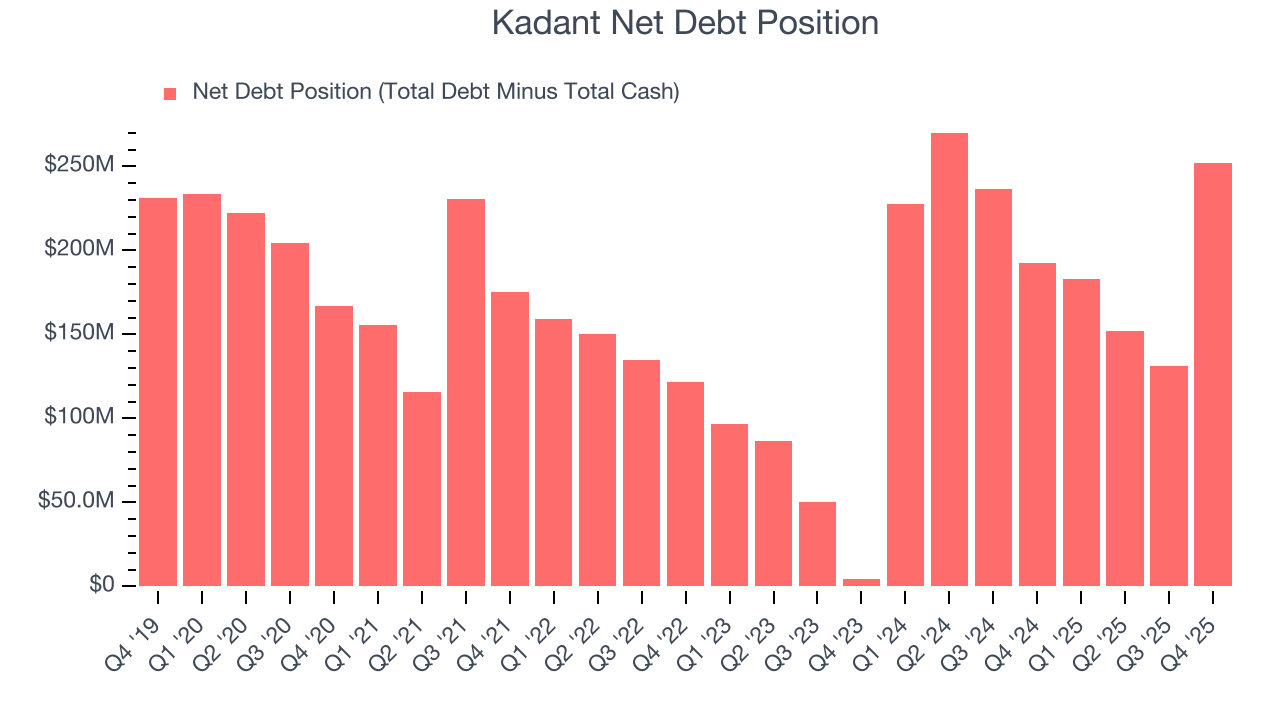
With $216.3 million of EBITDA over the last 12 months, we view Kadant’s 1.2× net-debt-to-EBITDA ratio as safe. We also see its $4.20 million of annual interest expenses as appropriate. The company’s profits give it plenty of breathing room, allowing it to continue investing in growth initiatives.
12. Key Takeaways from Kadant’s Q4 Results
We were impressed by how significantly Kadant blew past analysts’ EBITDA expectations this quarter. We were also excited its revenue outperformed Wall Street’s estimates by a wide margin. On the other hand, its EPS guidance for next quarter missed. Zooming out, we think this was a good print with some key areas of upside. The stock remained flat at $320.03 immediately after reporting.
13. Is Now The Time To Buy Kadant?
Updated: March 18, 2026 at 11:16 PM EDT
We think that the latest earnings result is only one piece of the bigger puzzle. If you’re deciding whether to own Kadant, you should also grasp the company’s longer-term business quality and valuation.
Kadant isn’t a terrible business, but it doesn’t pass our bar. Although its revenue growth was impressive over the last five years and is expected to accelerate over the next 12 months, its diminishing returns show management's prior bets haven't worked out. And while the company’s projected EPS for the next year implies the company’s fundamentals will improve, the downside is its cash profitability fell over the last five years.
Kadant’s P/E ratio based on the next 12 months is 26.1x. Investors with a higher risk tolerance might like the company, but we don’t really see a big opportunity at the moment. We're pretty confident there are more exciting stocks to buy at the moment.
Wall Street analysts have a consensus one-year price target of $341 on the company (compared to the current share price of $294.31).
Although the price target is bullish, readers should exercise caution because analysts tend to be overly optimistic. The firms they work for, often big banks, have relationships with companies that extend into fundraising, M&A advisory, and other rewarding business lines. As a result, they typically hesitate to say bad things for fear they will lose out. We at StockStory do not suffer from such conflicts of interest, so we’ll always tell it like it is.