
Kemper (KMPR)
We wouldn’t buy Kemper. Not only did its demand evaporate but also its negative returns on capital show it destroyed shareholder value.― StockStory Analyst Team
1. News


2. Summary
Why We Think Kemper Will Underperform
Originally known as Unitrin until rebranding in 2011, Kemper (NYSE:KMPR) is an insurance holding company that provides automobile, homeowners, life, and other insurance products to individuals and businesses across the United States.
- Annual sales declines of 1.3% for the past five years show its products and services struggled to connect with the market during this cycle
- Earnings per share decreased by more than its revenue over the last five years, showing each sale was less profitable
- Net premiums earned contracted by 1.2% annually over the last five years, showing unfavorable market dynamics this cycle


Kemper’s quality is inadequate. There are more promising alternatives.
Why There Are Better Opportunities Than Kemper


Kemper’s stock price of $29.89 implies a valuation ratio of 0.6x forward P/B. Kemper’s valuation may seem like a bargain, but we think there are valid reasons why it’s so cheap.
It’s better to pay up for high-quality businesses with higher long-term earnings potential rather than to buy lower-quality stocks because they appear cheap. These challenged businesses often don’t re-rate, a phenomenon known as a “value trap”.
3. Kemper (KMPR) Research Report: Q4 CY2025 Update
Insurance holding company Kemper (NYSE:KMPR) fell short of the market’s revenue expectations in Q4 CY2025, with sales falling 4.8% year on year to $1.13 billion. Its non-GAAP profit of $0.25 per share was 70.8% below analysts’ consensus estimates.
Kemper (KMPR) Q4 CY2025 Highlights:
- Net Premiums Earned: $1.04 billion vs analyst estimates of $1.11 billion (3.5% year-on-year decline, 6.1% miss)
- Revenue: $1.13 billion vs analyst estimates of $1.20 billion (4.8% year-on-year decline, 6.1% miss)
- Combined Ratio: 106% vs analyst estimates of 99.9% (610 basis point miss)
- Adjusted EPS: $0.25 vs analyst expectations of $0.86 (70.8% miss)
- Book Value per Share: $45.71 vs analyst estimates of $49.43 (4.7% year-on-year growth, 7.5% miss)
- Market Capitalization: $2.23 billion
Company Overview
Originally known as Unitrin until rebranding in 2011, Kemper (NYSE:KMPR) is an insurance holding company that provides automobile, homeowners, life, and other insurance products to individuals and businesses across the United States.
Kemper operates through two main business segments: Specialty Property & Casualty Insurance and Life Insurance. The Specialty Property & Casualty segment, marketed under the Kemper Auto brand, specializes in providing personal automobile insurance to consumers who may have difficulty obtaining standard coverage due to their driving records or claims history. This segment also offers commercial automobile coverage targeting specific markets like contractors and short-haul delivery services. Operating in 16 states, these products reach customers through a network of independent agents and brokers.
The Life Insurance segment distributes individual life and supplemental accident and health insurance products through approximately 2,200 career agents who work as full-time employees. These agents visit customers in their homes to sell policies, provide service, and collect premiums. The segment's primary offerings include permanent life insurance, term insurance, and guaranteed issue policies, generally provided on a non-participating, guaranteed-cost basis.
In 2023, Kemper established the Kemper Reciprocal Exchange, which primarily writes specialty automobile policies. To manage risk exposure, particularly from catastrophic events, the company employs geographical diversification strategies and maintains comprehensive reinsurance programs across both segments.
A typical Kemper customer might be a driver with a less-than-perfect record who has been denied coverage by standard insurers but still needs reliable auto protection, or a family seeking affordable life insurance with straightforward terms and personal service. The company generates revenue through premium payments from policyholders, with pricing structured to balance risk coverage with profitability.
4. Multi-Line Insurance
Multi-line insurance companies operate a diversified business model, offering a broad suite of products that span both Property & Casualty (P&C) and Life & Health (L&H) insurance. This diversification allows them to generate revenue from multiple, often uncorrelated, underwriting pools while also earning investment income on their combined float. Interest rates matter for the sector (and make it cyclical), with higher rates allowing insurers to reinvest their fixed-income portfolios at more attractive yields and vice versa. The market environment also matters for P&C operations specifically, with a 'hard market' characterized by pricing increases that outstrip claim costs, resulting in higher profits while a 'soft market' is the opposite. On the other hand, a key headwind is increasing volatility and severity of catastrophe losses, driven by climate change, which poses a significant threat to P&C underwriting results.
Kemper's competitors in the property and casualty insurance space include Progressive (NYSE:PGR), Allstate (NYSE:ALL), and State Farm, while its life insurance business competes with companies like MetLife (NYSE:MET), Prudential Financial (NYSE:PRU), and Globe Life (NYSE:GL).
5. Revenue Growth
Big picture, insurers generate revenue from three key sources. The first is the core business of underwriting policies. The second source is income from investing the “float” (premiums collected upfront not yet paid out as claims) in assets such as fixed-income assets and equities. The third is fees from various sources such as policy administration, annuities, or other value-added services. Kemper struggled to consistently generate demand over the last five years as its revenue dropped at a 1.3% annual rate. This wasn’t a great result and is a sign of poor business quality.
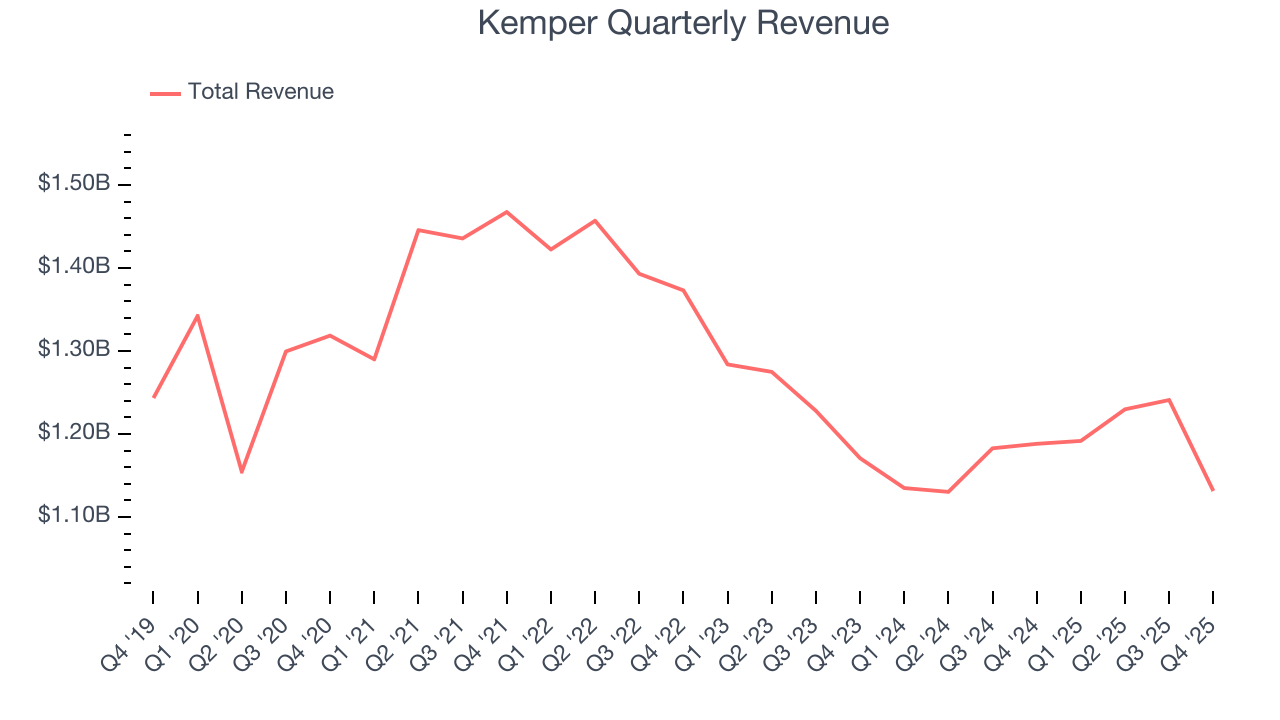
Long-term growth is the most important, but within financials, a half-decade historical view may miss recent interest rate changes and market returns. Kemper’s annualized revenue declines of 1.7% over the last two years align with its five-year trend, suggesting its demand has consistently shrunk. 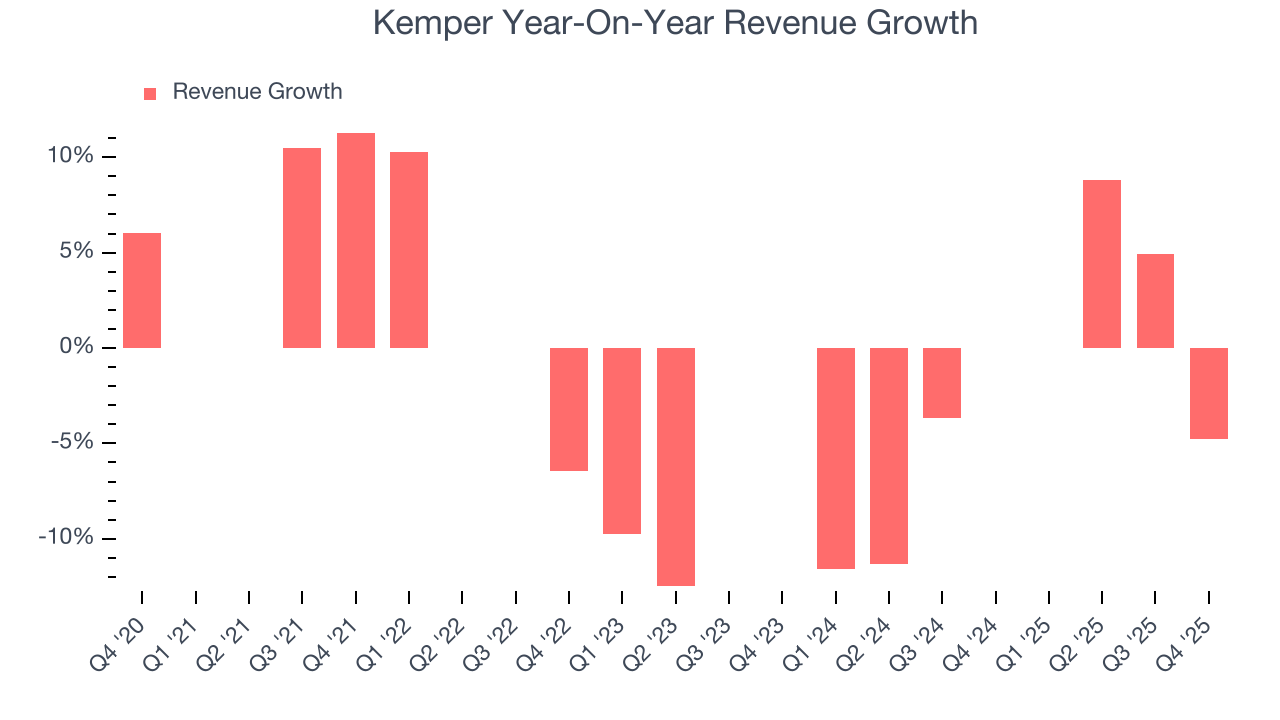 Note: Quarters not shown were determined to be outliers, impacted by outsized investment gains/losses that are not indicative of the recurring fundamentals of the business.
This quarter, Kemper missed Wall Street’s estimates and reported a rather uninspiring 4.8% year-on-year revenue decline, generating $1.13 billion of revenue.
Net premiums earned made up 92% of the company’s total revenue during the last five years, meaning Kemper lives and dies by its underwriting activities because non-insurance operations barely move the needle.
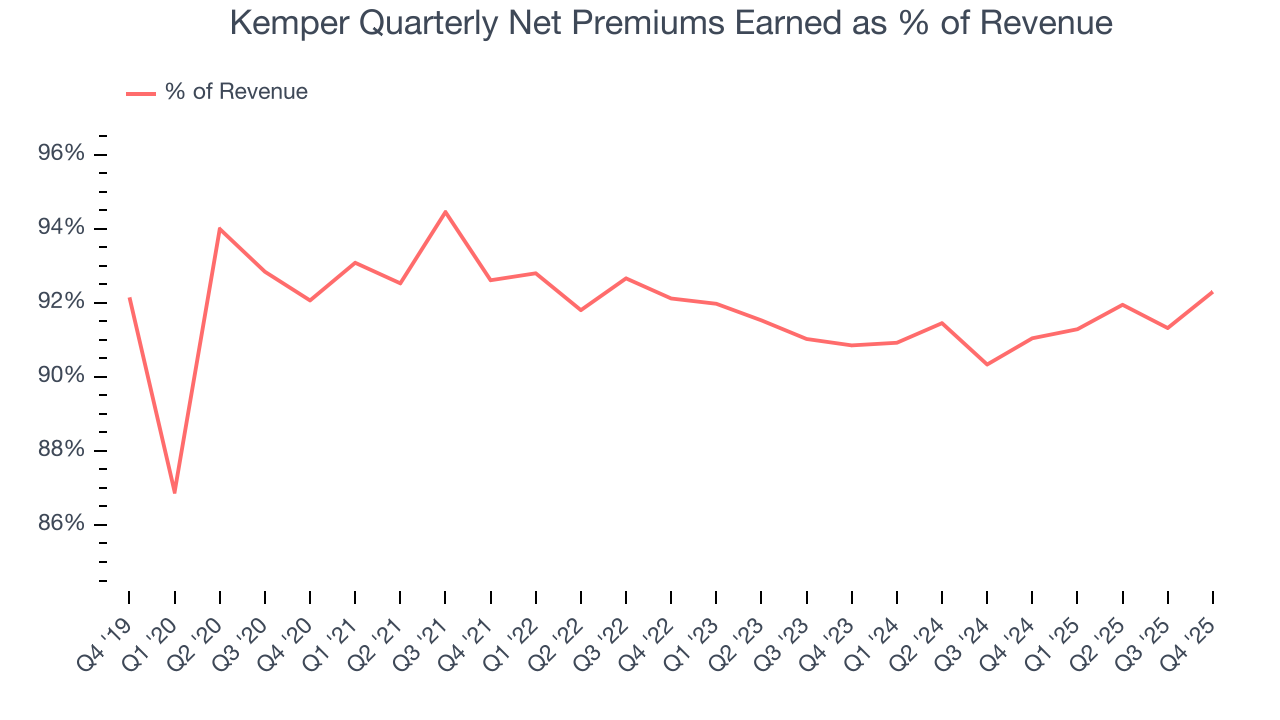
While insurers generate revenue from multiple sources, investors view net premiums earned as the cornerstone - its direct link to core operations stands in sharp contrast to the unpredictability of investment returns and fees.
6. Net Premiums Earned
When insurers sell policies, they protect themselves from extremely large losses or an outsized accumulation of losses with reinsurance (insurance for insurance companies). Net premiums earned are therefore net of what’s ceded to reinsurers as a risk mitigation and transfer strategy.
Kemper’s net premiums earned has declined by 1.2% annually over the last five years, much worse than the broader insurance industry and in line with its total revenue.
When analyzing Kemper’s net premiums earned over the last two years, we can paint a similar picture as income dropped by 1.5% annually. This performance was similar to its total revenue.
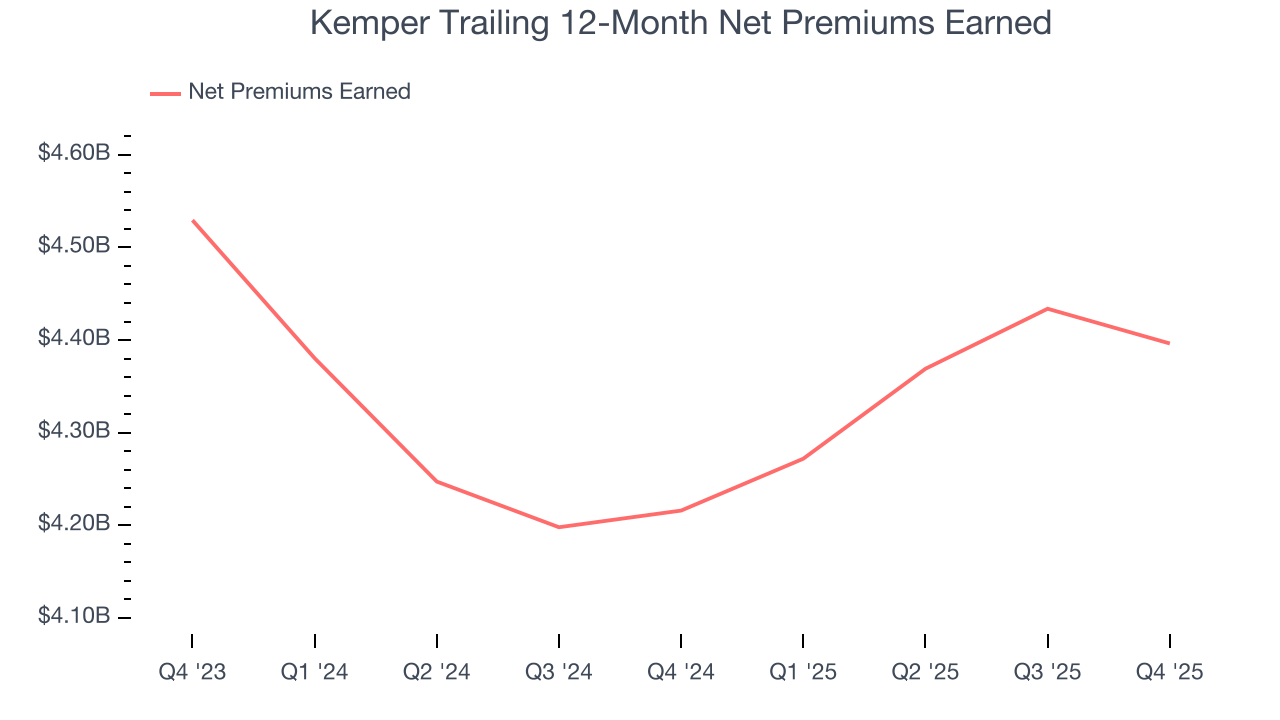
This quarter, Kemper’s net premiums earned was $1.04 billion, down 3.5% year on year and short of Wall Street Consensus estimates.
7. Combined Ratio
Revenue growth is one major determinant of business quality, and the efficiency of operations is another. For insurance companies, we look at the combined ratio rather than the operating expenses and margins that define sectors such as consumer, tech, and industrials.
Combined ratio sums operating costs (salaries, commissions, overhead) with what is paid out in claims (losses) and divides this by net premiums earned. Combined ratios under 100% means profits while ones over 100% mean losses on its core operations of selling insurance policies.
Given the calculation, a lower expense ratio is better. Over the last two years, Kemper’s combined ratio has swelled by 7 percentage points, going from 107% to 99.7%. Said differently, the company’s expenses have grown at a slower rate than revenue, which typically signals prudent management.
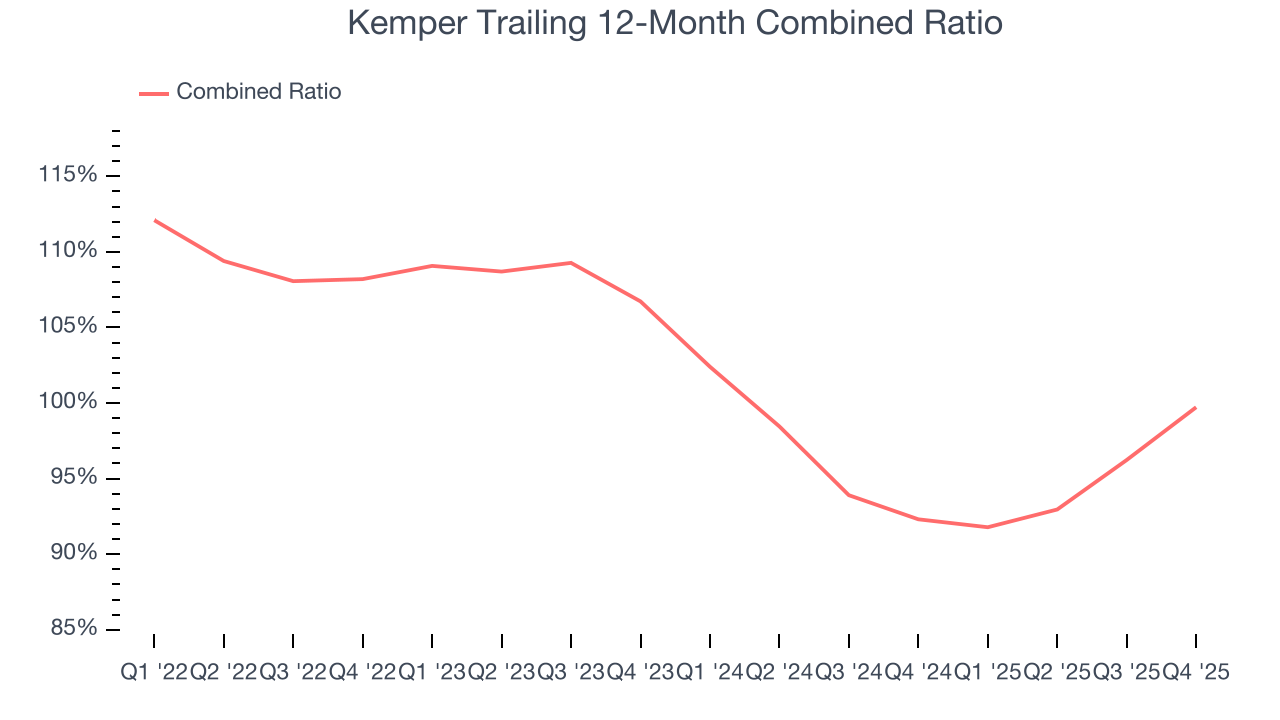
Kemper’s combined ratio came in at 106% this quarter, falling short of analysts’ expectations by 610 basis points (100 basis points = 1 percentage point). This result was 14 percentage points worse than the same quarter last year.
8. Earnings Per Share
Revenue trends explain a company’s historical growth, but the long-term change in earnings per share (EPS) points to the profitability of that growth – for example, a company could inflate its sales through excessive spending on advertising and promotions.
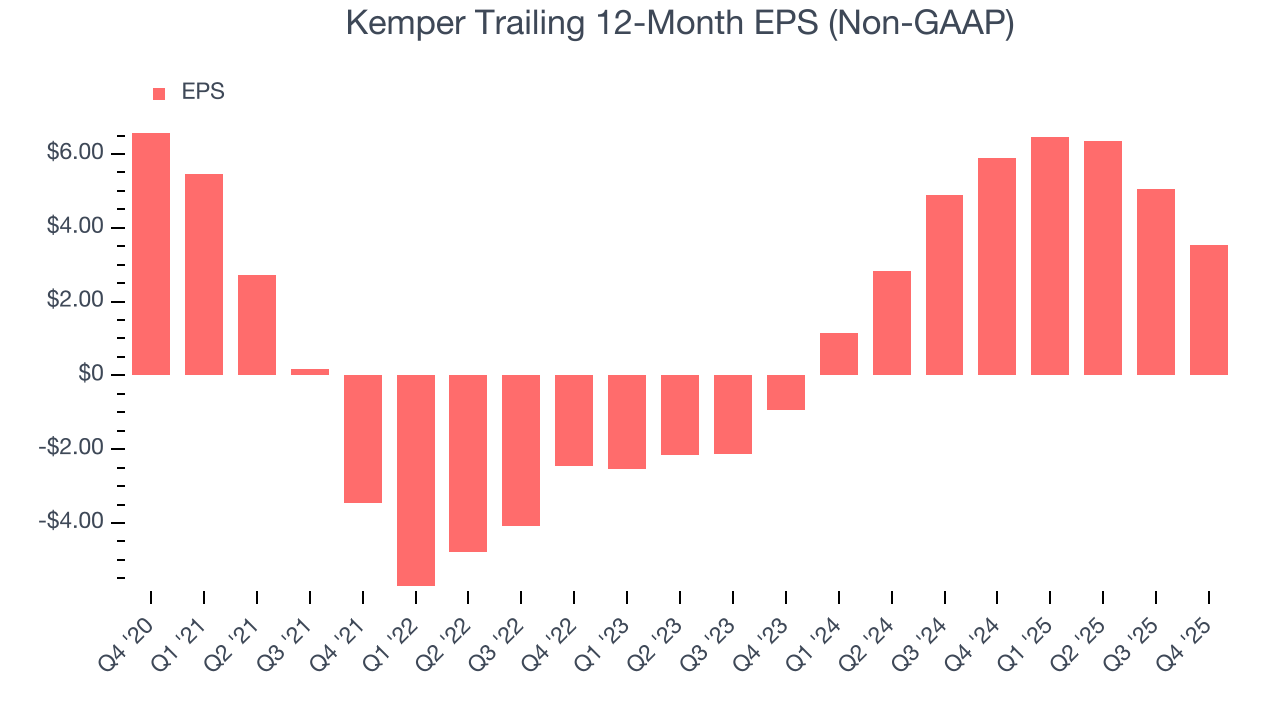
Sadly for Kemper, its EPS declined by 11.7% annually over the last five years, more than its revenue. This tells us the company struggled because its fixed cost base made it difficult to adjust to shrinking demand.
Like with revenue, we analyze EPS over a shorter period to see if we are missing a change in the business.
For Kemper, its two-year annual EPS growth of 140% was higher than its five-year trend. This acceleration made it one of the faster-growing insurance companies in recent history.
In Q4, Kemper reported adjusted EPS of $0.25, down from $1.78 in the same quarter last year. This print missed analysts’ estimates. Over the next 12 months, Wall Street expects Kemper’s full-year EPS of $3.53 to grow 34.9%.
9. Book Value Per Share (BVPS)
Insurance companies are balance sheet businesses, collecting premiums upfront and paying out claims over time. The float – premiums collected but not yet paid out – are invested, creating an asset base supported by a liability structure. Book value captures this dynamic by measuring:
- Assets (investment portfolio, cash, reinsurance recoverables) - liabilities (claim reserves, debt, future policy benefits)
BVPS is essentially the residual value for shareholders.
We therefore consider BVPS very important to track for insurers and a metric that sheds light on business quality. While other (and more commonly known) per-share metrics like EPS can sometimes be lumpy due to reserve releases or one-time items and can be managed or skewed while still following accounting rules, BVPS reflects long-term capital growth and is harder to manipulate.
Kemper’s BVPS declined at a 8.1% annual clip over the last five years. However, BVPS growth has accelerated recently, growing by 8.2% annually over the last two years from $39.08 to $45.71 per share.
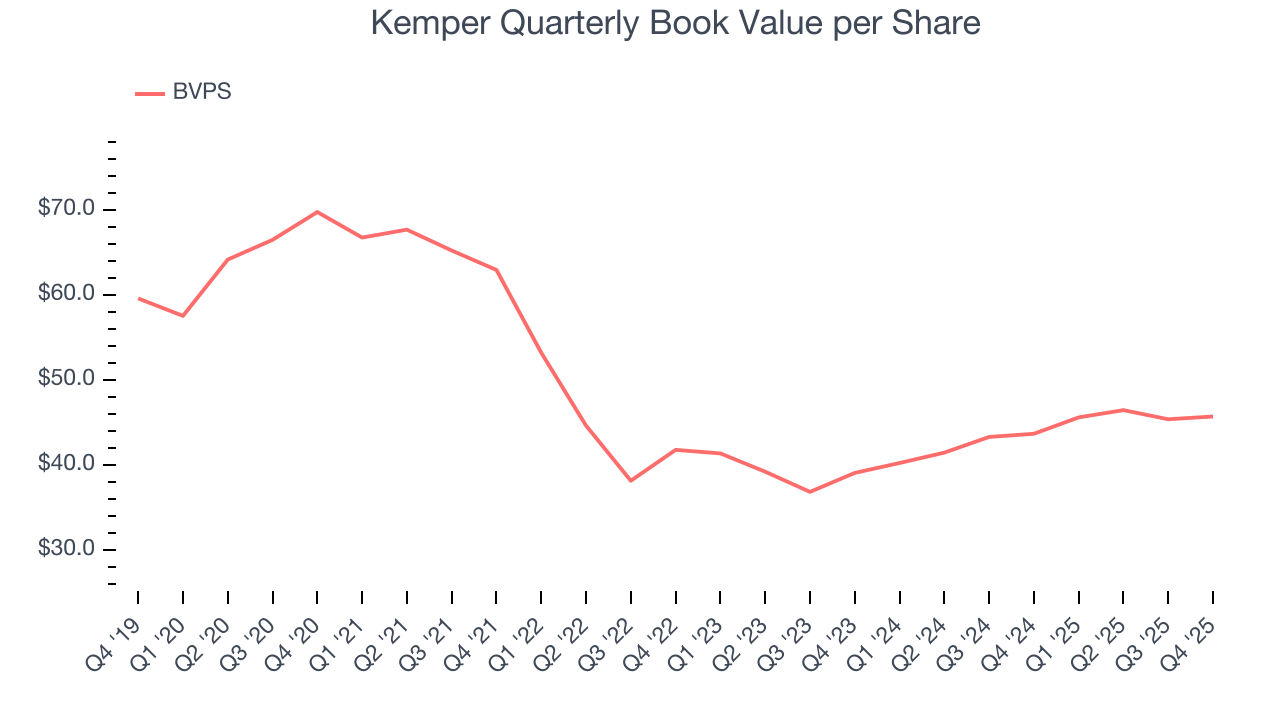
Over the next 12 months, Consensus estimates call for Kemper’s BVPS to grow by 15.7% to $49.43, top-notch growth rate.
10. Balance Sheet Assessment
The debt-to-equity ratio is a widely used measure to assess a company's balance sheet health. A higher ratio means that a business aggressively financed its growth with debt. This can result in higher earnings (if the borrowed funds are invested profitably) but also increases risk.
If debt levels are too high, there could be difficulties in meeting obligations, especially during economic downturns or periods of rising interest rates if the debt has variable-rate payments.
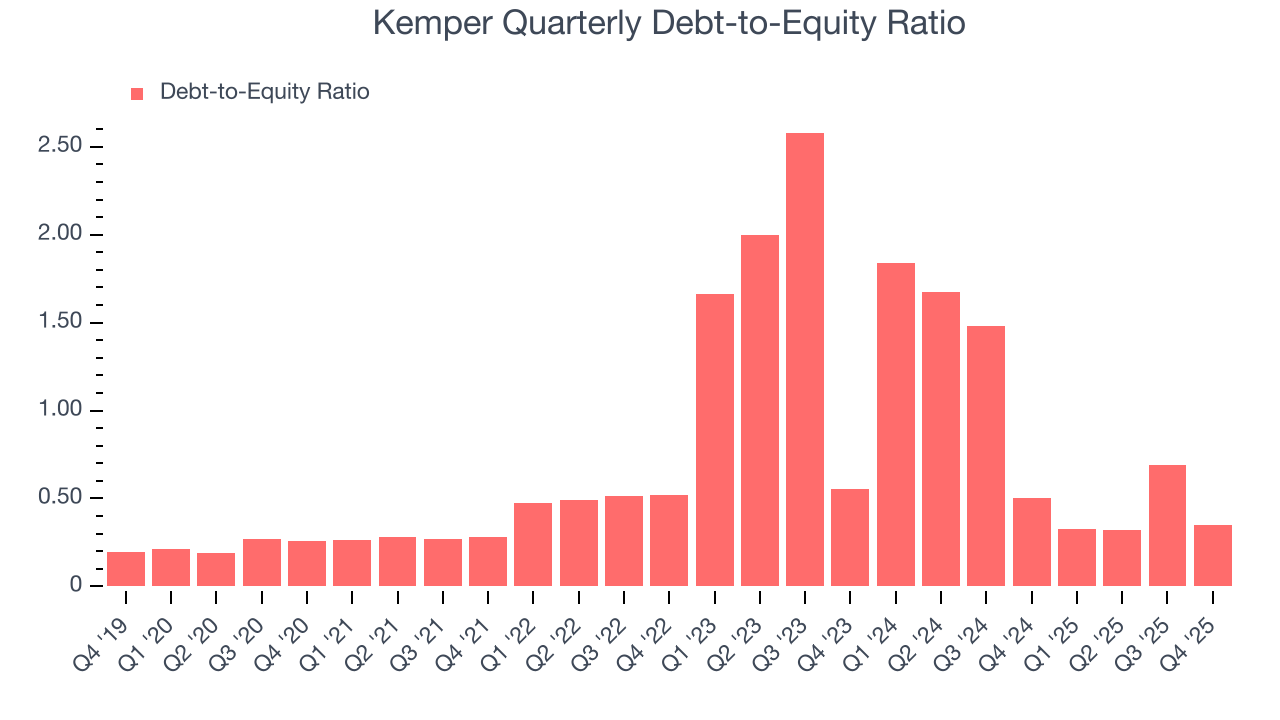
Kemper currently has $943.5 million of debt and $2.68 billion of shareholder's equity on its balance sheet, and over the past four quarters, has averaged a debt-to-equity ratio of 0.4×. We think this is safe and raises no red flags. In general, we’re comfortable with any ratio below 1.0× for an insurance business. Anything below 0.5× is a bonus.
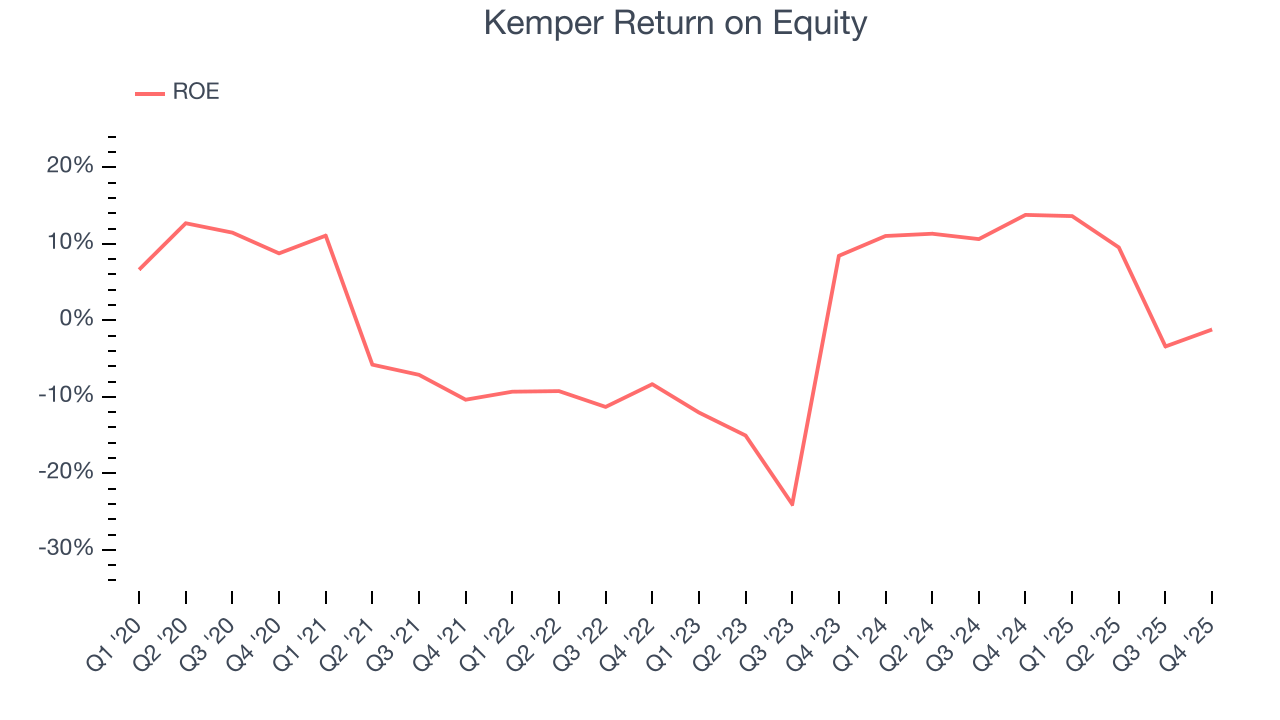
11. Return on Equity
Return on equity (ROE) is a crucial yardstick for insurance companies, measuring their ability to generate returns on the capital provided by shareholders. Insurers that consistently deliver superior ROE tend to create more value for their investors over time through strategic capital allocation and shareholder-friendly policies.
Over the last five years, Kemper has averaged an ROE of negative 1.4%, a bad result not only in absolute terms but also relative to the majority of insurers putting up 20%+. It also shows that Kemper has little to no competitive moat.
12. Key Takeaways from Kemper’s Q4 Results
We struggled to find many positives in these results. Its revenue missed and its net premiums earned fell short of Wall Street’s estimates. Overall, this was a weaker quarter. The stock traded down 4.8% to $36.65 immediately after reporting.
13. Is Now The Time To Buy Kemper?
Updated: March 29, 2026 at 12:41 AM EDT
When considering an investment in Kemper, investors should account for its valuation and business qualities as well as what’s happened in the latest quarter.
Kemper doesn’t pass our quality test. For starters, its revenue has declined over the last five years, and analysts expect its demand to deteriorate over the next 12 months. While its estimated BVPS growth for the next 12 months is great, the downside is its relatively low ROE suggests management has struggled to find compelling investment opportunities. On top of that, its BVPS has declined over the last five years.
Kemper’s P/B ratio based on the next 12 months is 0.6x. While this valuation is optically cheap, the potential downside is huge given its shaky fundamentals. There are better investments elsewhere.
Wall Street analysts have a consensus one-year price target of $57.33 on the company (compared to the current share price of $29.89).
Although the price target is bullish, readers should exercise caution because analysts tend to be overly optimistic. The firms they work for, often big banks, have relationships with companies that extend into fundraising, M&A advisory, and other rewarding business lines. As a result, they typically hesitate to say bad things for fear they will lose out. We at StockStory do not suffer from such conflicts of interest, so we’ll always tell it like it is.