Kohl's (KSS)
We wouldn’t buy Kohl's. Its weak profitability and declining sales not only show demand is fading but also illustrate poor fundamentals.― StockStory Analyst Team
1. News


2. Summary
Why We Think Kohl's Will Underperform
Founded as a corner grocery store in Milwaukee, Wisconsin, Kohl’s (NYSE:KSS) is a department store chain that sells clothing, cosmetics, electronics, and home goods.
- Forecasted revenue decline of 2.1% for the upcoming 12 months implies demand will fall even further
- Responsiveness to unforeseen market trends is restricted due to its substandard operating margin profitability
- High net-debt-to-EBITDA ratio of 6× increases the risk of forced asset sales or dilutive financing if operational performance weakens


Kohl’s quality is inadequate. Our attention is focused on better businesses.
Why There Are Better Opportunities Than Kohl's


Kohl’s stock price of $17.75 implies a valuation ratio of 14.1x forward P/E. This multiple is quite expensive for the quality you get.
It’s better to pay up for high-quality businesses with strong long-term earnings potential rather than to buy lower-quality companies with open questions and big downside risks.
3. Kohl's (KSS) Research Report: Q3 CY2025 Update
Department store chain Kohl’s (NYSE:KSS) reported Q3 CY2025 results topping the market’s revenue expectations, but sales fell by 3.6% year on year to $3.58 billion. Its non-GAAP profit of $0.10 per share was significantly above analysts’ consensus estimates.
Kohl's (KSS) Q3 CY2025 Highlights:
- Revenue: $3.58 billion vs analyst estimates of $3.49 billion (3.6% year-on-year decline, 2.5% beat)
- Adjusted EPS: $0.10 vs analyst estimates of -$0.17 (significant beat)
- Adjusted EBITDA: $258 million vs analyst estimates of $223.7 million (7.2% margin, 15.3% beat)
- Management raised its full-year Adjusted EPS guidance to $1.35 at the midpoint, a 108% increase
- Operating Margin: 2%, in line with the same quarter last year
- Free Cash Flow was $16 million, up from -$323 million in the same quarter last year
- Same-Store Sales fell 1.7% year on year (-9.3% in the same quarter last year)
- Market Capitalization: $1.76 billion
Company Overview
Founded as a corner grocery store in Milwaukee, Wisconsin, Kohl’s (NYSE:KSS) is a department store chain that sells clothing, cosmetics, electronics, and home goods.
As the name suggests, a department store offers a wide variety of merchandise organized into different departments or sections. Before the introduction of department stores in the 19th century, consumers would have to visit three different stores to buy a pair of shoes, nail polish, and towels for the home.
Today, the core Kohl’s customer is a middle-income woman shopping for herself and for her family. This customer can find prominent brands such as Nike, Levi’s, Keurig, and Samsung in a typical Kohl’s store or on its e-commerce site. Stores tend to be between 80,000 and 100,000 square feet and located in strip shopping centers rather than the traditional suburban malls that many department stores anchor. Common departments in a Kohl’s store include women’s/men’s/children’s apparel, beauty/cosmetics, and electronics. Additionally, Kohl's has an e-commerce presence which was launched in 2001 and today enables both online orders to be shipped to a customer’s home as well as buy online for store pickup.
Since the introduction of e-commerce, Kohl’s and peers have faced increased competition. Evolving specialty retailers and developments such as fast fashion have also pressured the department store model.
4. Department Store
Department stores emerged in the 19th century to provide customers with a wide variety of merchandise under one roof, offering a convenient and luxurious shopping experience. They played an important role in the history of American retail and urbanization, and prior to department stores, retailers tended to sell narrow specialty and niche items. But what was once new is now old, and department stores are somewhat considered a relic of the past. They are being attacked from multiple angles–stagnant foot traffic at malls where they’ve served as anchors; more nimble off-price and fast-fashion retailers; and e-commerce-first competitors not burdened by large physical footprints.
Department or general merchandise retail competitors include Macy’s (NYSE:M), Nordstrom (NYSE:JWN), and Dillard’s (NYSE:DDS).
5. Revenue Growth
A company’s long-term sales performance can indicate its overall quality. Any business can put up a good quarter or two, but many enduring ones grow for years.
With $15.75 billion in revenue over the past 12 months, Kohl's is one of the larger companies in the consumer retail industry and benefits from a well-known brand that influences purchasing decisions. However, its scale is a double-edged sword because there are only a finite number of places to build new stores, making it harder to find incremental growth. To accelerate sales, Kohl's likely needs to optimize its pricing or lean into international expansion.
As you can see below, Kohl’s demand was weak over the last three years (we compare to 2019 to normalize for COVID-19 impacts). Its sales fell by 5.4% annually as it didn’t open many new stores and observed lower sales at existing, established locations.
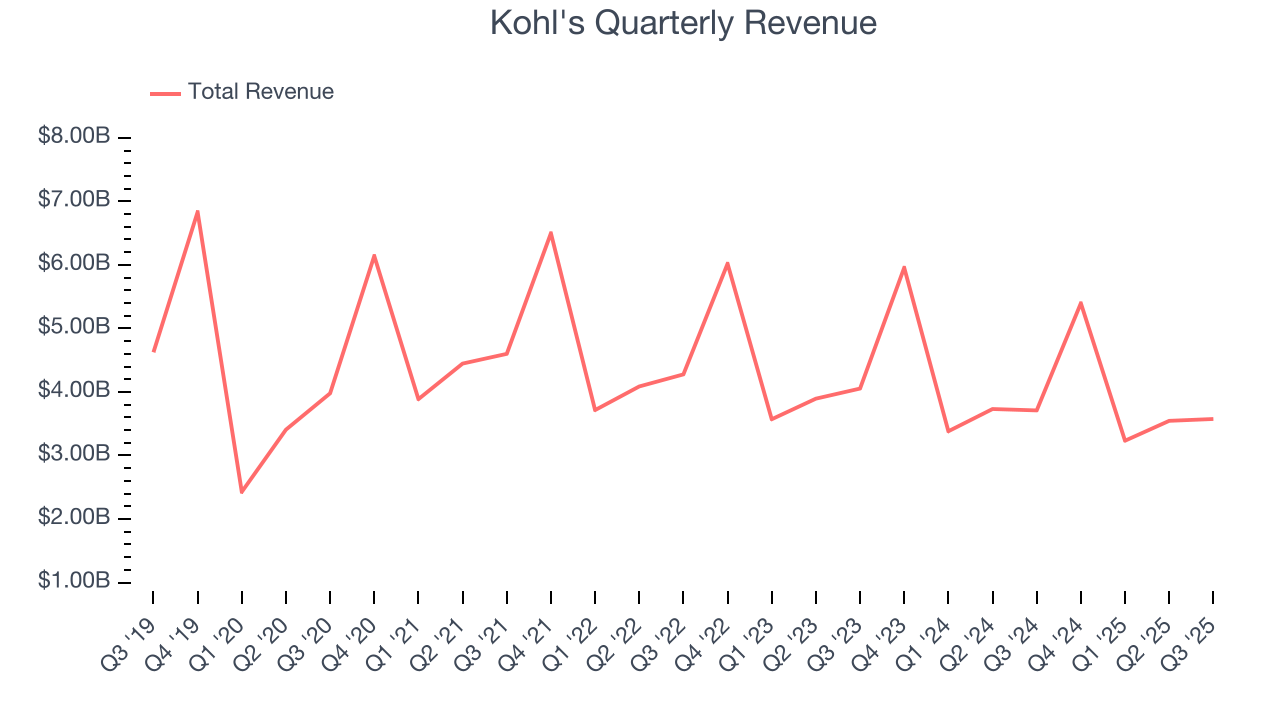
This quarter, Kohl’s revenue fell by 3.6% year on year to $3.58 billion but beat Wall Street’s estimates by 2.5%.
Looking ahead, sell-side analysts expect revenue to decline by 3.5% over the next 12 months. it’s tough to feel optimistic about a company facing demand difficulties.
6. Store Performance
Number of Stores
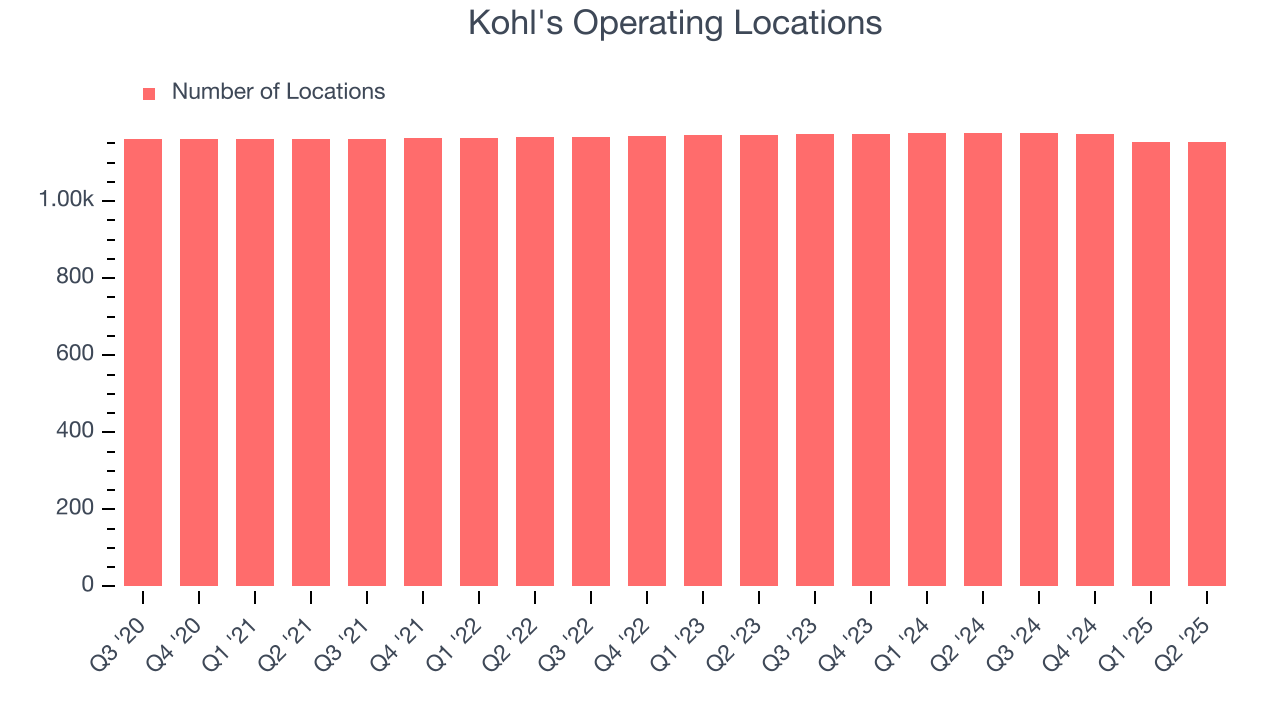
A retailer’s store count often determines how much revenue it can generate.
Over the last two years, Kohl's has kept its store count flat while other consumer retail businesses have opted for growth.
When a retailer keeps its store footprint steady, it usually means demand is stable and it’s focusing on operational efficiency to increase profitability.
Note that Kohl's reports its store count intermittently, so some data points are missing in the chart below.
Same-Store Sales
The change in a company's store base only tells one side of the story. The other is the performance of its existing locations and e-commerce sales, which informs management teams whether they should expand or downsize their physical footprints. Same-store sales is an industry measure of whether revenue is growing at those existing stores and is driven by customer visits (often called traffic) and the average spending per customer (ticket).
Kohl’s demand has been shrinking over the last two years as its same-store sales have averaged 5% annual declines. This performance isn’t ideal, and we’d be concerned if Kohl's starts opening new stores to artificially boost revenue growth.
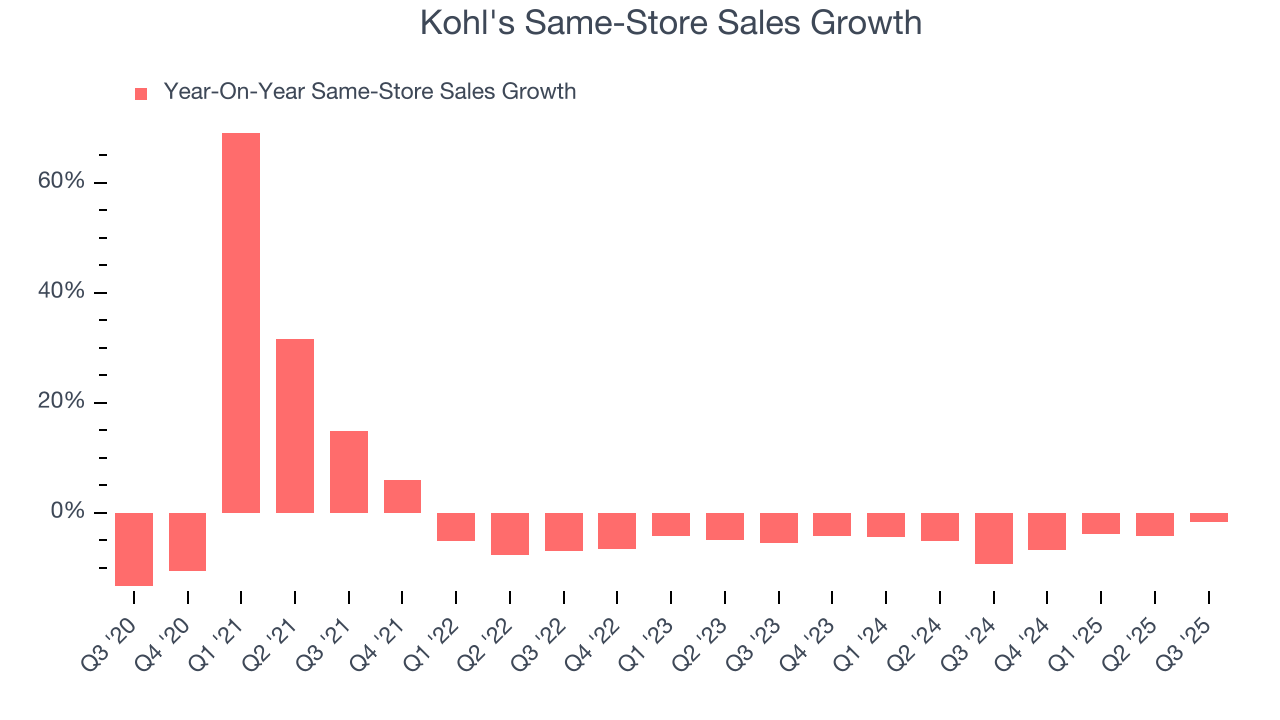
In the latest quarter, Kohl’s same-store sales fell by 1.7% year on year. This decrease was an improvement from its historical levels. It’s always great to see a business’s demand trends improve.
7. Gross Margin & Pricing Power
Kohl’s unit economics are higher than the typical retailer, giving it the flexibility to invest in areas such as marketing and talent to reach more consumers. As you can see below, it averaged a decent 40.3% gross margin over the last two years. That means for every $100 in revenue, $59.71 went towards paying for inventory, transportation, and distribution. 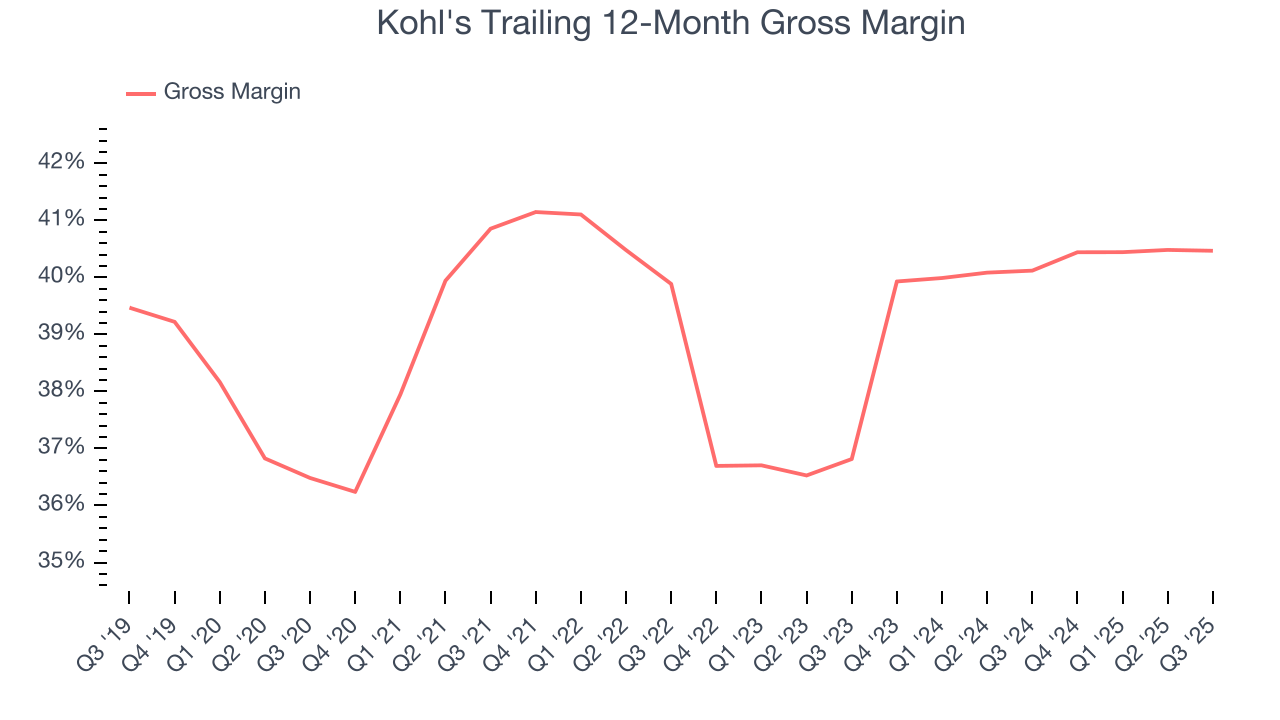
In Q3, Kohl's produced a 42.4% gross profit margin, in line with the same quarter last year. Zooming out, the company’s full-year margin has remained steady over the past 12 months, suggesting it strives to keep prices low for customers and has stable input costs (such as labor and freight expenses to transport goods).
8. Operating Margin
Kohl’s operating margin might fluctuated slightly over the last 12 months but has generally stayed the same, averaging 3.5% over the last two years. This profitability was lousy for a consumer retail business and caused by its suboptimal cost structure.
Looking at the trend in its profitability, Kohl’s operating margin might fluctuated slightly but has generally stayed the same over the last year, meaning it will take a fundamental shift in the business model to change.
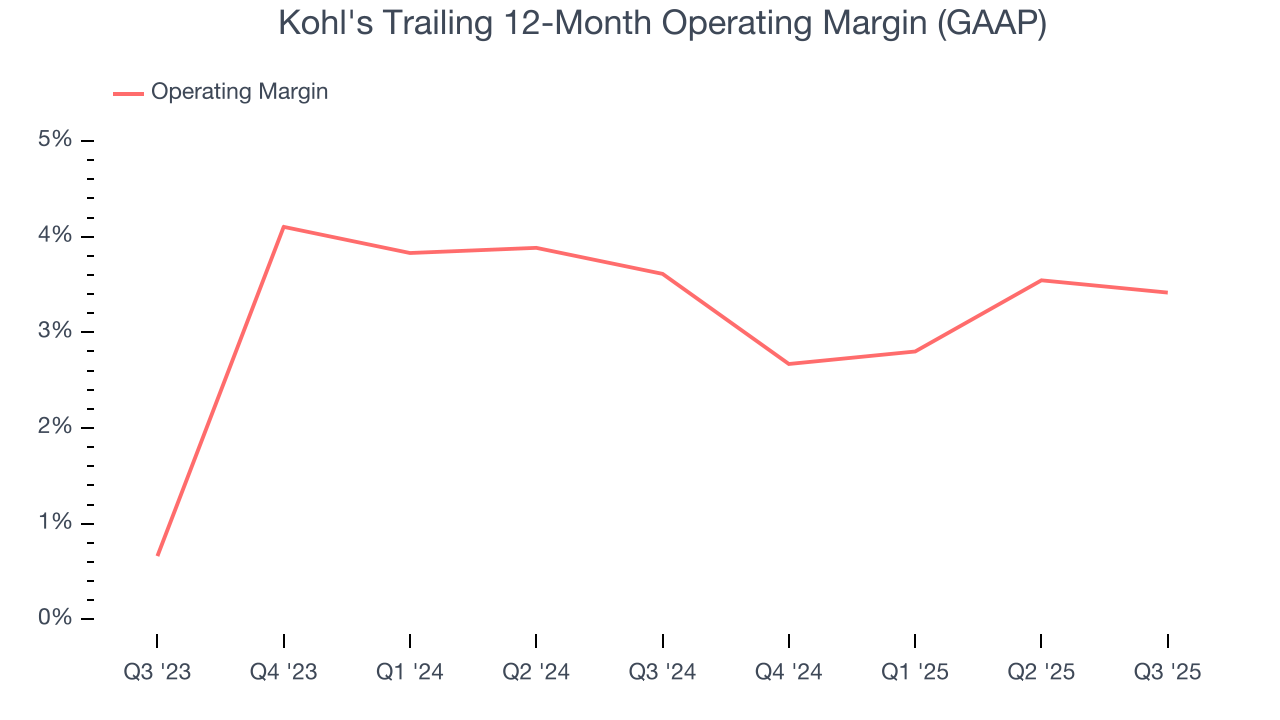
This quarter, Kohl's generated an operating margin profit margin of 2%, in line with the same quarter last year. This indicates the company’s cost structure has recently been stable.
9. Cash Is King
Free cash flow isn't a prominently featured metric in company financials and earnings releases, but we think it's telling because it accounts for all operating and capital expenses, making it tough to manipulate. Cash is king.
Kohl's has shown decent cash profitability, giving it some flexibility to reinvest or return capital to investors. The company’s free cash flow margin averaged 3.7% over the last two years, slightly better than the broader consumer retail sector.
Taking a step back, we can see that Kohl’s margin expanded by 2.9 percentage points over the last year. This shows the company is heading in the right direction, and we can see it became a less capital-intensive business because its free cash flow profitability rose while its operating profitability was flat.
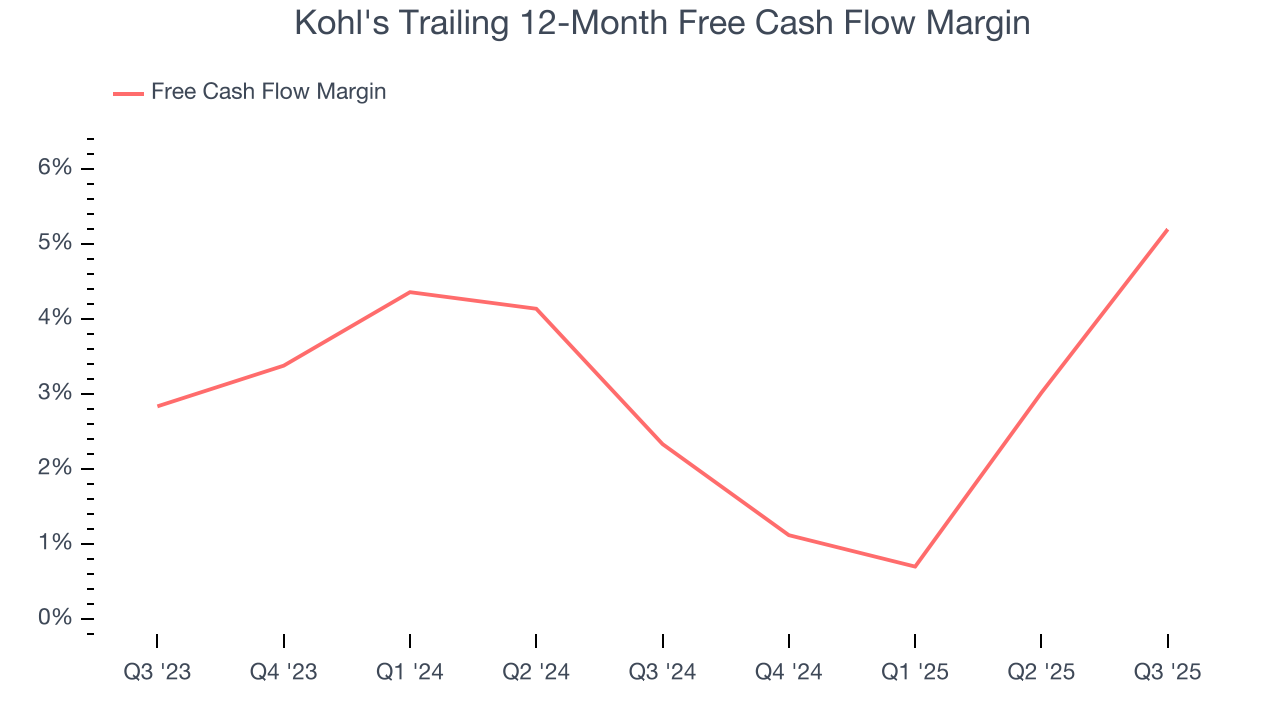
Kohl's broke even from a free cash flow perspective in Q3. This result was good as its margin was 9.2 percentage points higher than in the same quarter last year, building on its favorable historical trend.
10. Balance Sheet Risk
As long-term investors, the risk we care about most is the permanent loss of capital, which can happen when a company goes bankrupt or raises money from a disadvantaged position. This is separate from short-term stock price volatility, something we are much less bothered by.
Kohl’s $6.80 billion of debt exceeds the $144 million of cash on its balance sheet. Furthermore, its 5× net-debt-to-EBITDA ratio (based on its EBITDA of $1.21 billion over the last 12 months) shows the company is overleveraged.
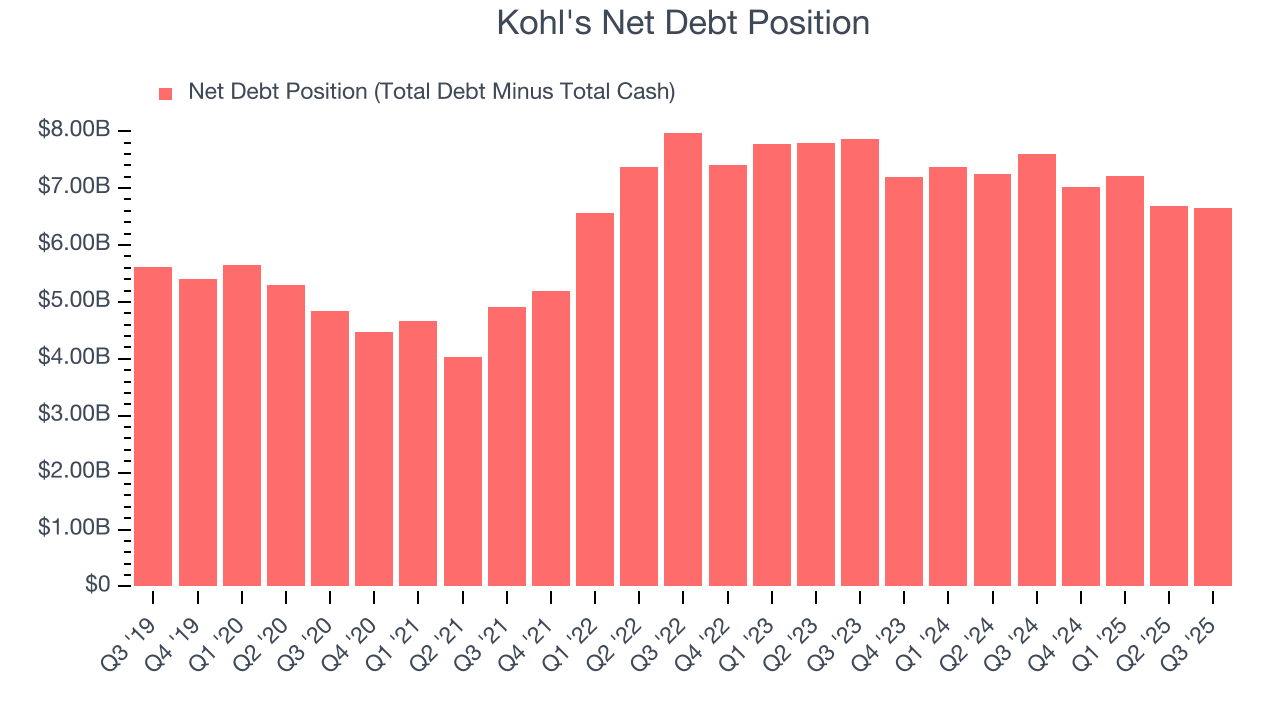
At this level of debt, incremental borrowing becomes increasingly expensive and credit agencies could downgrade the company’s rating if profitability falls. Kohl's could also be backed into a corner if the market turns unexpectedly – a situation we seek to avoid as investors in high-quality companies.
We hope Kohl's can improve its balance sheet and remain cautious until it increases its profitability or pays down its debt.
11. Key Takeaways from Kohl’s Q3 Results
It was good to see Kohl's beat analysts’ EPS expectations this quarter. We were also excited its gross margin outperformed Wall Street’s estimates by a wide margin. Icing on the cake was a big guidance raise. Zooming out, we think this was a solid print. The stock traded up 21.5% to $19.51 immediately after reporting.
12. Is Now The Time To Buy Kohl's?
Updated: January 21, 2026 at 9:42 PM EST
A common mistake we notice when investors are deciding whether to buy a stock or not is that they simply look at the latest earnings results. Business quality and valuation matter more, so we urge you to understand these dynamics as well.
Kohl's falls short of our quality standards. To kick things off, its revenue has declined over the last three years. And while its popular brand gives it meaningful influence over consumers’ purchasing decisions, the downside is its declining EPS over the last three years makes it a less attractive asset to the public markets. On top of that, its shrinking same-store sales tell us it will need to change its strategy to succeed.
Kohl’s P/E ratio based on the next 12 months is 14.3x. This multiple tells us a lot of good news is priced in - we think other companies feature superior fundamentals at the moment.
Wall Street analysts have a consensus one-year price target of $22 on the company (compared to the current share price of $17.96).
Although the price target is bullish, readers should exercise caution because analysts tend to be overly optimistic. The firms they work for, often big banks, have relationships with companies that extend into fundraising, M&A advisory, and other rewarding business lines. As a result, they typically hesitate to say bad things for fear they will lose out. We at StockStory do not suffer from such conflicts of interest, so we’ll always tell it like it is.