
Lennar (LEN)
Lennar keeps us up at night. Its poor sales growth and falling returns on capital suggest its growth opportunities are shrinking.― StockStory Analyst Team
1. News


2. Summary
Why We Think Lennar Will Underperform
One of the largest homebuilders in America, Lennar (NYSE:LEN) is known for constructing affordable, move-up, and retirement homes across a range of markets and communities.
- Sales tumbled by 2.7% annually over the last two years, showing market trends are working against its favor during this cycle
- Earnings per share fell by 4.6% annually over the last five years while its revenue grew, showing its incremental sales were much less profitable
- Backlog has dropped by 11.4% on average over the past two years, suggesting it’s losing orders as competition picks up


Lennar’s quality isn’t up to par. We’d rather invest in businesses with stronger moats.
Why There Are Better Opportunities Than Lennar


At $89.65 per share, Lennar trades at 14.6x forward P/E. Yes, this valuation multiple is lower than that of other industrials peers, but we’ll remind you that you often get what you pay for.
Cheap stocks can look like a great deal at first glance, but they can be value traps. They often have less earnings power, meaning there is more reliance on a re-rating to generate good returns - an unlikely scenario for low-quality companies.
3. Lennar (LEN) Research Report: Q1 CY2026 Update
Homebuilder Lennar (NYSE:LEN) fell short of the market’s revenue expectations in Q1 CY2026, with sales falling 13.3% year on year to $6.62 billion. Its GAAP profit of $0.93 per share was 3.2% below analysts’ consensus estimates.
Lennar (LEN) Q1 CY2026 Highlights:
- Revenue: $6.62 billion vs analyst estimates of $6.93 billion (13.3% year-on-year decline, 4.5% miss)
- EPS (GAAP): $0.93 vs analyst expectations of $0.96 (3.2% miss)
- Operating Margin: 5.1%, down from 9.1% in the same quarter last year
- Backlog: $6 billion at quarter end, up 3.4% year on year
- Market Capitalization: $23.74 billion
Company Overview
One of the largest homebuilders in America, Lennar (NYSE:LEN) is known for constructing affordable, move-up, and retirement homes across a range of markets and communities.
Lennar Corporation, one of the largest U.S. homebuilders, operates in homebuilding, mortgage financing, title insurance, closing services, and multifamily rental property development. The company also invests in technology companies focused on improving the homebuilding industry and real estate-related financial services.
Homebuilding operations generate a large majority of Lennar's consolidated revenues, with the company operating in various states across the East, Central, Texas, and West regions, as well as in urban divisions and other homebuilding-related investments, primarily in California. Founded in 1954, Lennar has expanded through organic growth and acquisitions, focusing on increasing efficiencies, reducing expenses, and maintaining strong operating margins.
Lennar generates revenue through the construction and sale of single-family attached and detached homes, as well as the purchase, development, and sale of residential land directly and through investments in entities. The company targets various homebuyer segments, including first-time, move-up, active adult, and luxury buyers.
Lennar's financial services operations include residential mortgage financing, title insurance, closing services, and commercial mortgage origination, primarily serving buyers of its homes through its subsidiary, Lennar Mortgage.
4. Home Builders
Traditionally, homebuilders have built competitive advantages with economies of scale that lead to advantaged purchasing and brand recognition among consumers. Aesthetic trends have always been important in the space, but more recently, energy efficiency and conservation are driving innovation. However, these companies are still at the whim of the macro, specifically interest rates that heavily impact new and existing home sales. In fact, homebuilders are one of the most cyclical subsectors within industrials.
Competitors of Lennar include D.R. Horton (NYSE:DHI), PulteGroup (NYSE:PHM), and KE Home (NYSE:KBH)
5. Revenue Growth
Reviewing a company’s long-term sales performance reveals insights into its quality. Any business can put up a good quarter or two, but the best consistently grow over the long haul. Unfortunately, Lennar’s 7.3% annualized revenue growth over the last five years was mediocre. This fell short of our benchmark for the industrials sector and is a rough starting point for our analysis.
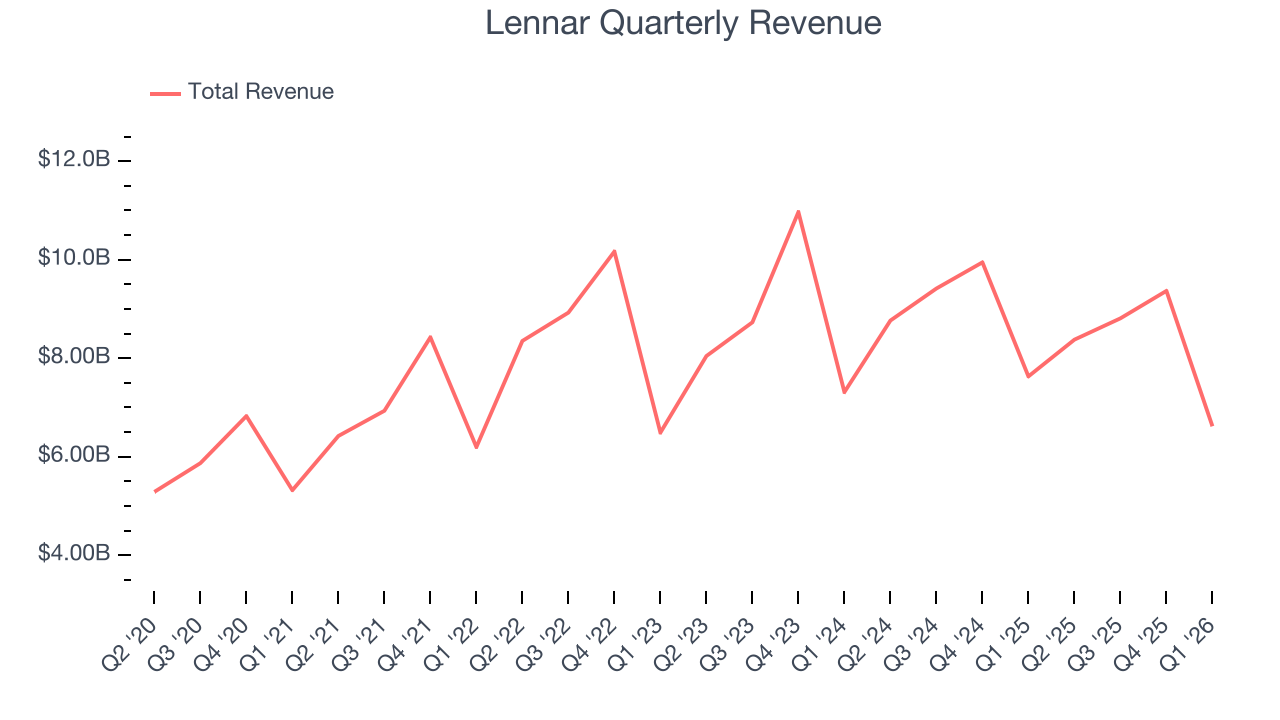
Long-term growth is the most important, but within industrials, a half-decade historical view may miss new industry trends or demand cycles. Lennar’s performance shows it grew in the past but relinquished its gains over the last two years, as its revenue fell by 2.7% annually. 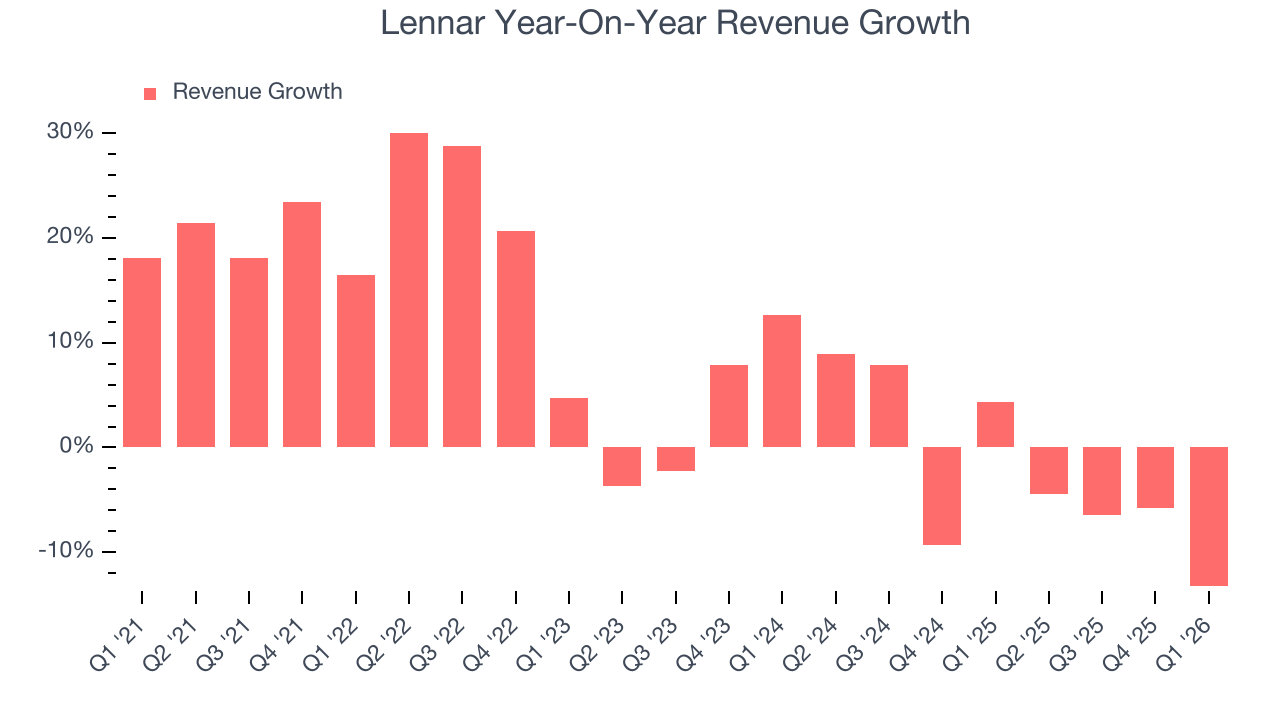
Lennar also reports its backlog, or the value of its outstanding orders that have not yet been executed or delivered. Lennar’s backlog reached $6 billion in the latest quarter and averaged 11.4% year-on-year declines over the last two years. Because this number is lower than its revenue growth, we can see the company hasn’t secured enough new orders to maintain its growth rate in the future. 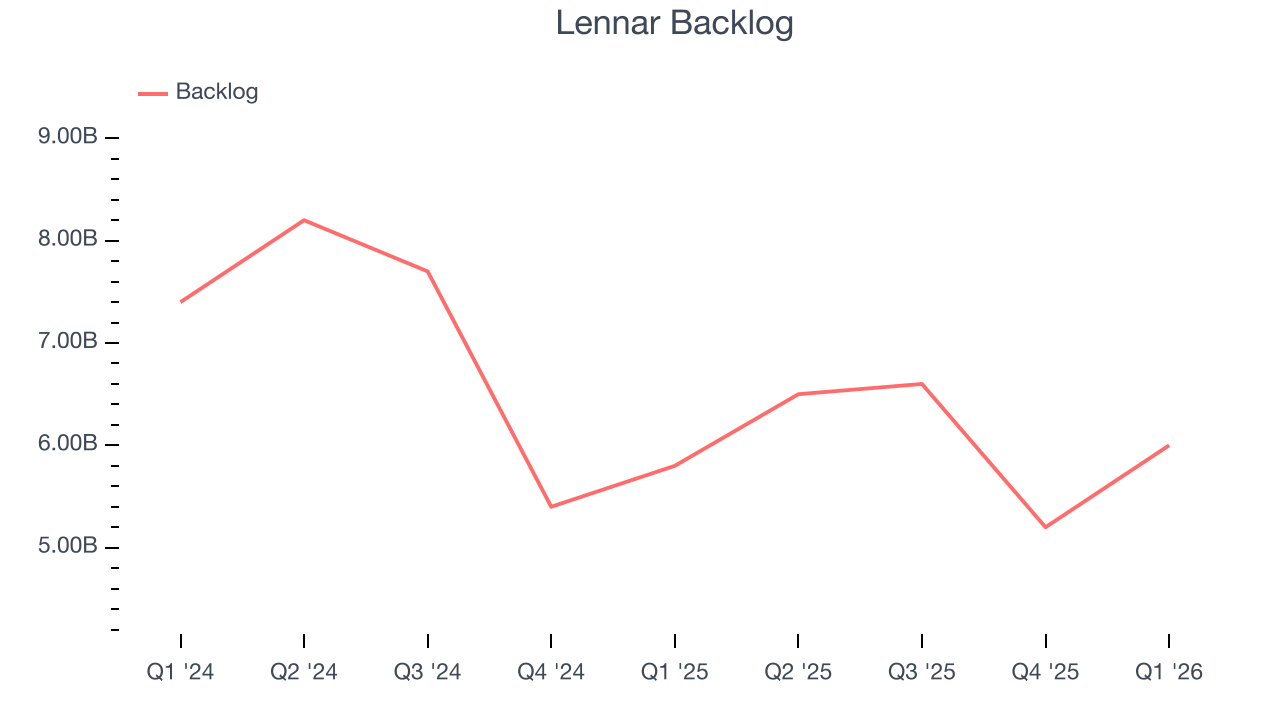
This quarter, Lennar missed Wall Street’s estimates and reported a rather uninspiring 13.3% year-on-year revenue decline, generating $6.62 billion of revenue.
Looking ahead, sell-side analysts expect revenue to grow 2.4% over the next 12 months. Although this projection implies its newer products and services will spur better top-line performance, it is still below the sector average.
6. Gross Margin & Pricing Power
Lennar has bad unit economics for an industrials company, giving it less room to reinvest and develop new offerings. As you can see below, it averaged a 23.2% gross margin over the last five years. That means Lennar paid its suppliers a lot of money ($76.77 for every $100 in revenue) to run its business. 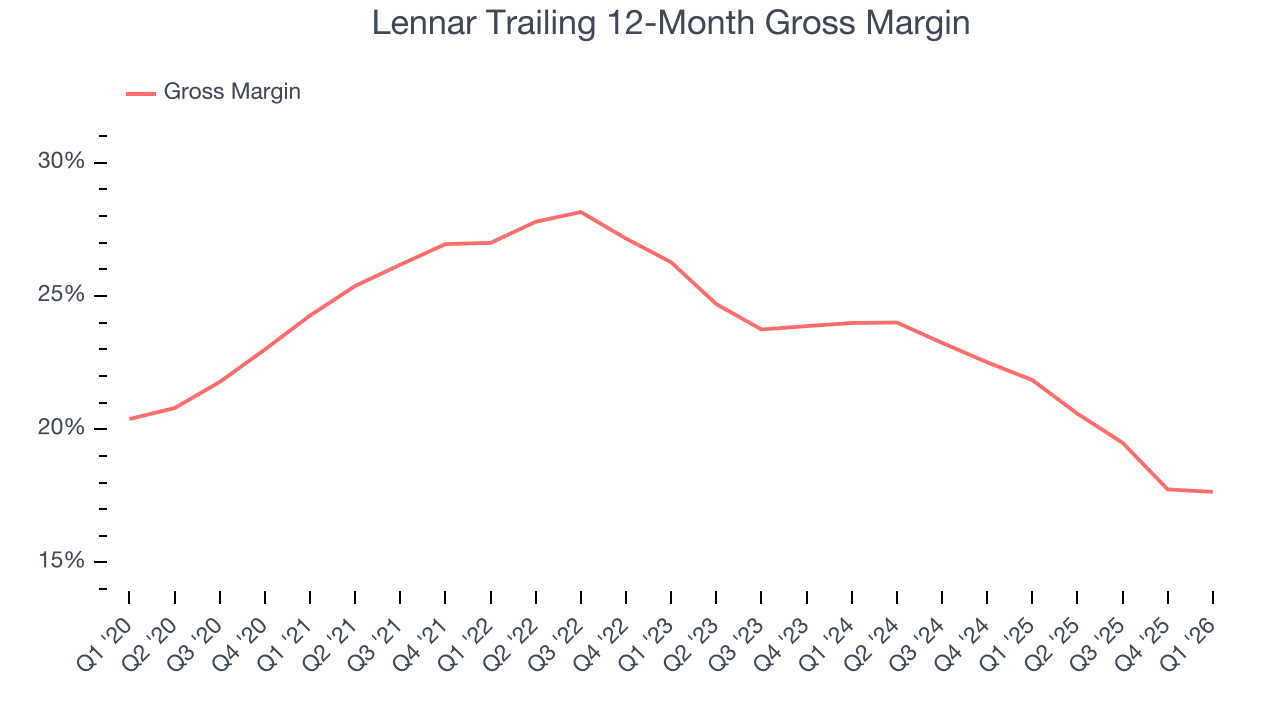
Lennar produced a 19.1% gross profit margin in Q1, in line with the same quarter last year. On a wider time horizon, Lennar’s full-year margin has been trending down over the past 12 months, decreasing by 4.2 percentage points. If this move continues, it could suggest a more competitive environment with some pressure to lower prices and higher input costs (such as raw materials and manufacturing expenses).
7. Operating Margin
Operating margin is an important measure of profitability as it shows the portion of revenue left after accounting for all core expenses – everything from the cost of goods sold to advertising and wages. It’s also useful for comparing profitability across companies with different levels of debt and tax rates because it excludes interest and taxes.
Lennar has been an efficient company over the last five years. It was one of the more profitable businesses in the industrials sector, boasting an average operating margin of 14.5%. This result was particularly impressive because of its low gross margin, which is mostly a factor of what it sells and takes huge shifts to move meaningfully. Companies have more control over their operating margins, and it’s a show of well-managed operations if they’re high when gross margins are low.
Looking at the trend in its profitability, Lennar’s operating margin decreased by 12 percentage points over the last five years. This raises questions about the company’s expense base because its revenue growth should have given it leverage on its fixed costs, resulting in better economies of scale and profitability.
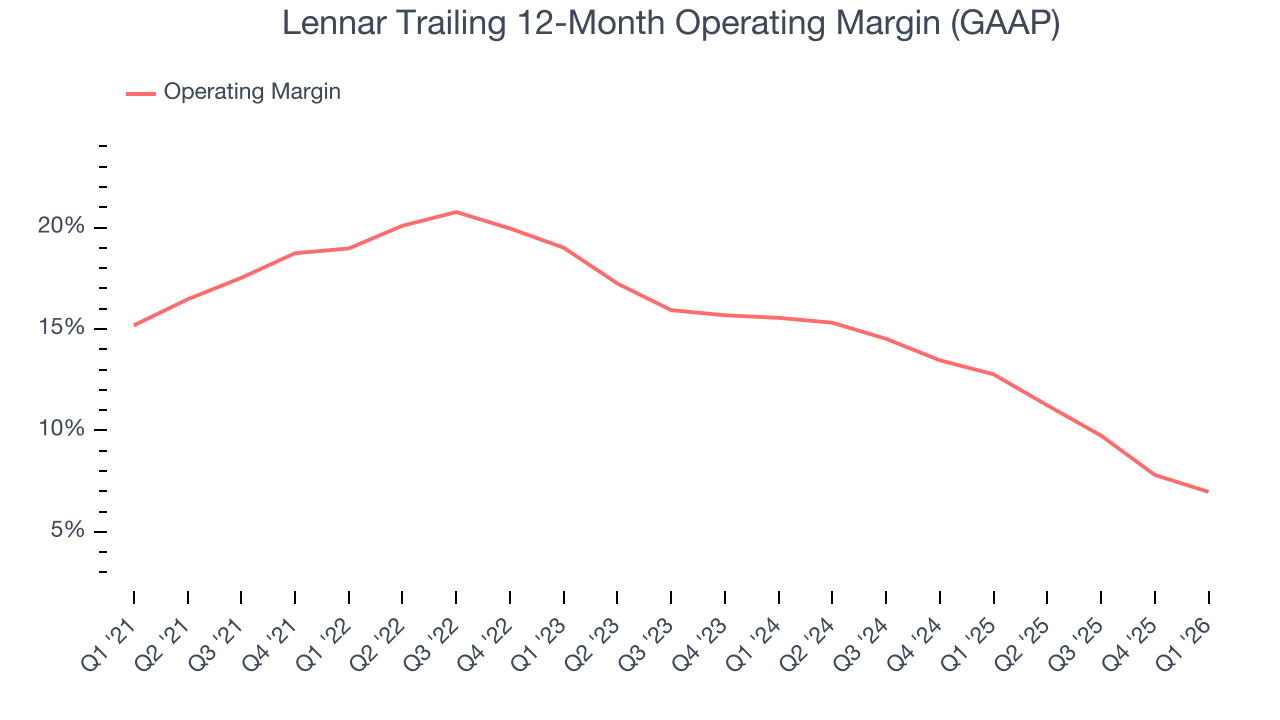
In Q1, Lennar generated an operating margin profit margin of 5.1%, down 4 percentage points year on year. Since Lennar’s operating margin decreased more than its gross margin, we can assume it was less efficient because expenses such as marketing, R&D, and administrative overhead increased.
8. Earnings Per Share
Revenue trends explain a company’s historical growth, but the long-term change in earnings per share (EPS) points to the profitability of that growth – for example, a company could inflate its sales through excessive spending on advertising and promotions.
Sadly for Lennar, its EPS declined by 6.7% annually over the last five years while its revenue grew by 7.3%. This tells us the company became less profitable on a per-share basis as it expanded due to non-fundamental factors such as interest expenses and taxes.
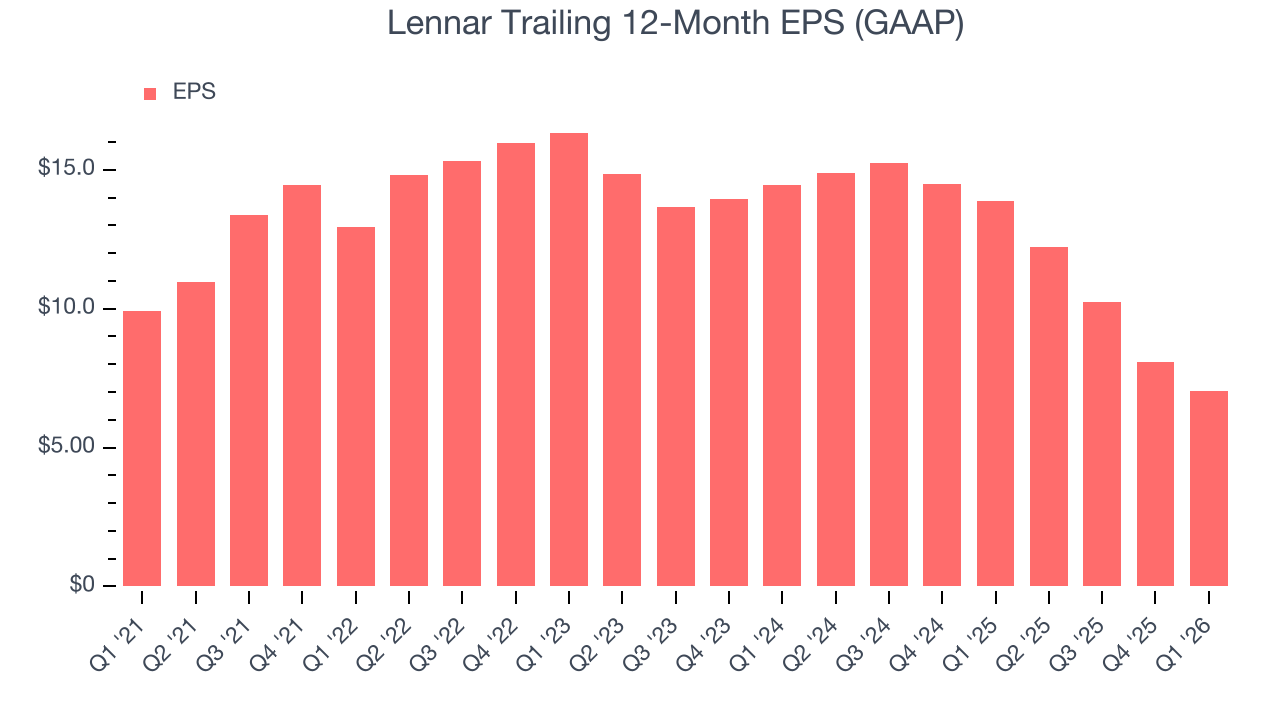
We can take a deeper look into Lennar’s earnings to better understand the drivers of its performance. As we mentioned earlier, Lennar’s operating margin declined by 12 percentage points over the last five years. This was the most relevant factor (aside from the revenue impact) behind its lower earnings; interest expenses and taxes can also affect EPS but don’t tell us as much about a company’s fundamentals.
Like with revenue, we analyze EPS over a more recent period because it can provide insight into an emerging theme or development for the business.
For Lennar, its two-year annual EPS declines of 30.3% show it’s continued to underperform. These results were bad no matter how you slice the data.
In Q1, Lennar reported EPS of $0.93, down from $1.98 in the same quarter last year. This print missed analysts’ estimates. Over the next 12 months, Wall Street expects Lennar’s full-year EPS of $7.02 to grow 2.3%.
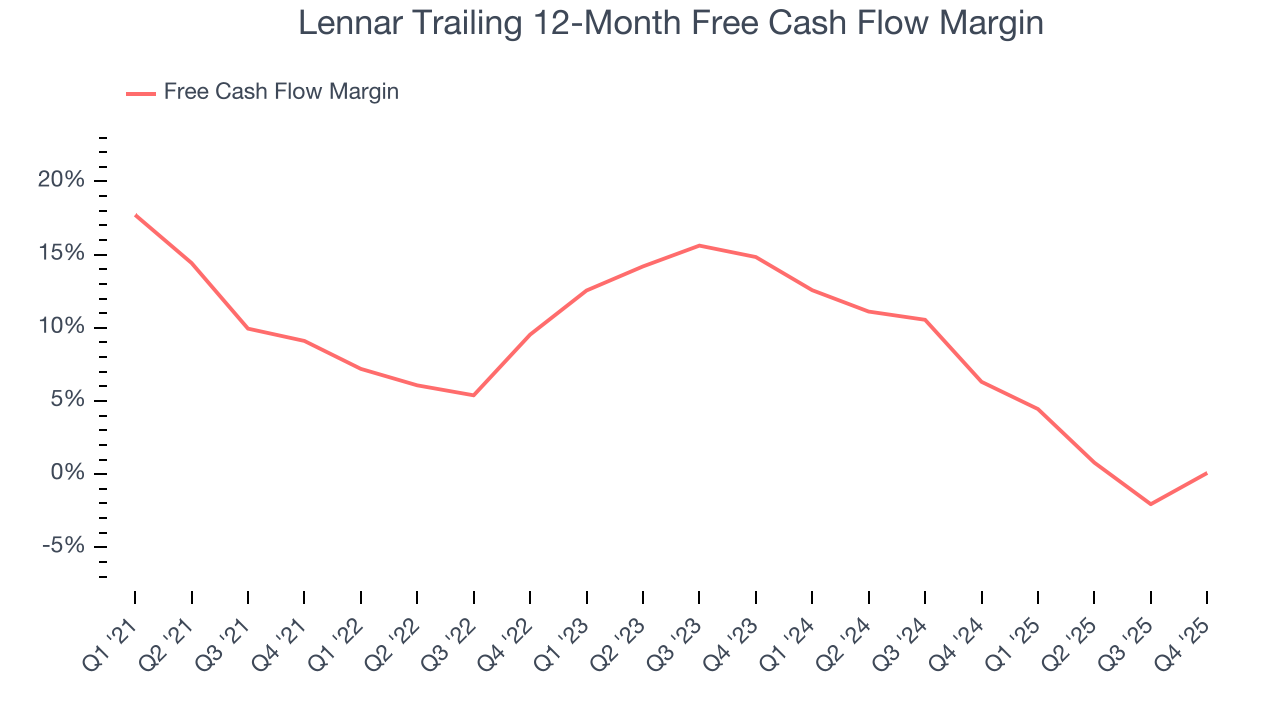
9. Cash Is King
If you’ve followed StockStory for a while, you know we emphasize free cash flow. Why, you ask? We believe that in the end, cash is king, and you can’t use accounting profits to pay the bills.
Lennar has shown impressive cash profitability, enabling it to ride out cyclical downturns more easily while maintaining its investments in new and existing offerings. The company’s free cash flow margin averaged 7.9% over the last five years, better than the broader industrials sector.
Taking a step back, we can see that Lennar’s margin dropped by 8.2 percentage points during that time. Continued declines could signal it is in the middle of an investment cycle.
10. Return on Invested Capital (ROIC)
EPS and free cash flow tell us whether a company was profitable while growing its revenue. But was it capital-efficient? A company’s ROIC explains this by showing how much operating profit it makes compared to the money it has raised (debt and equity).
Although Lennar hasn’t been the highest-quality company lately because of its poor bottom-line (EPS) performance, it historically found a few growth initiatives that worked out well. Its five-year average ROIC was 16.1%, impressive for an industrials business.
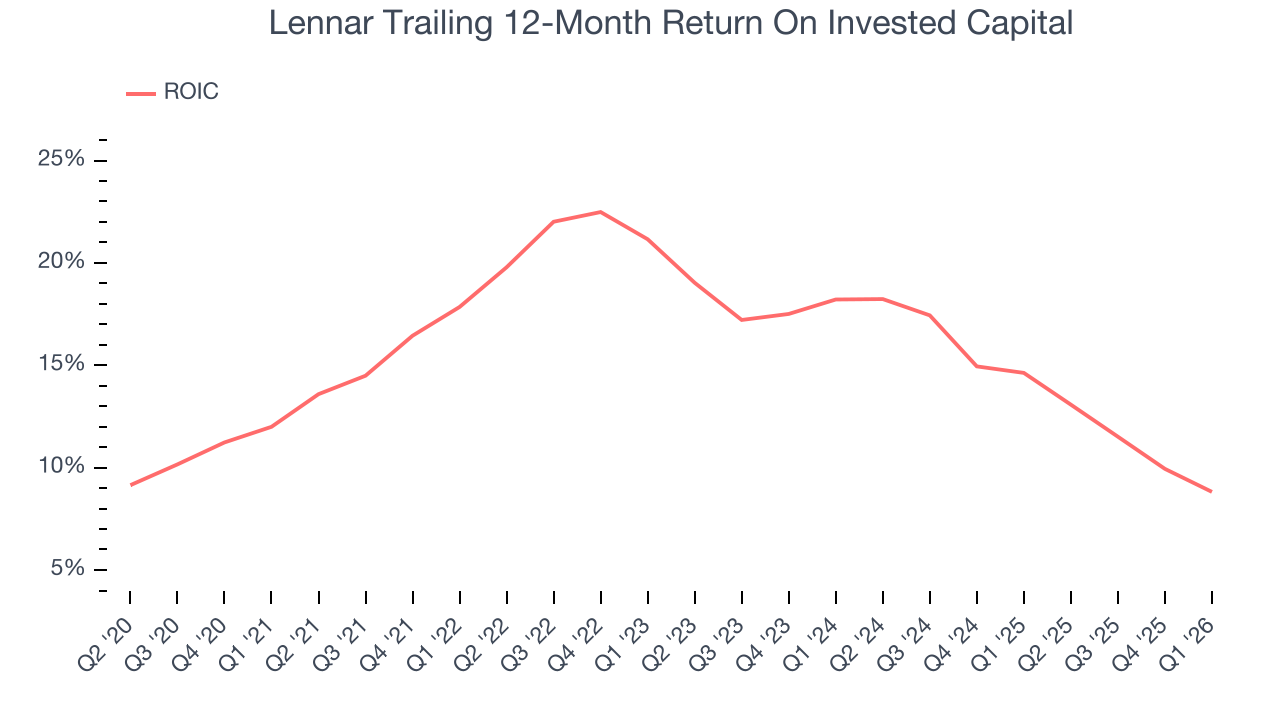
We like to invest in businesses with high returns, but the trend in a company’s ROIC is what often surprises the market and moves the stock price. Unfortunately, Lennar’s ROIC has decreased over the last few years. We like what management has done in the past, but its declining returns are perhaps a symptom of fewer profitable growth opportunities.
11. Balance Sheet Assessment
Lennar reported $2.11 billion of cash and $4.07 billion of debt on its balance sheet in the most recent quarter. As investors in high-quality companies, we primarily focus on two things: 1) that a company’s debt level isn’t too high and 2) that its interest payments are not excessively burdening the business.
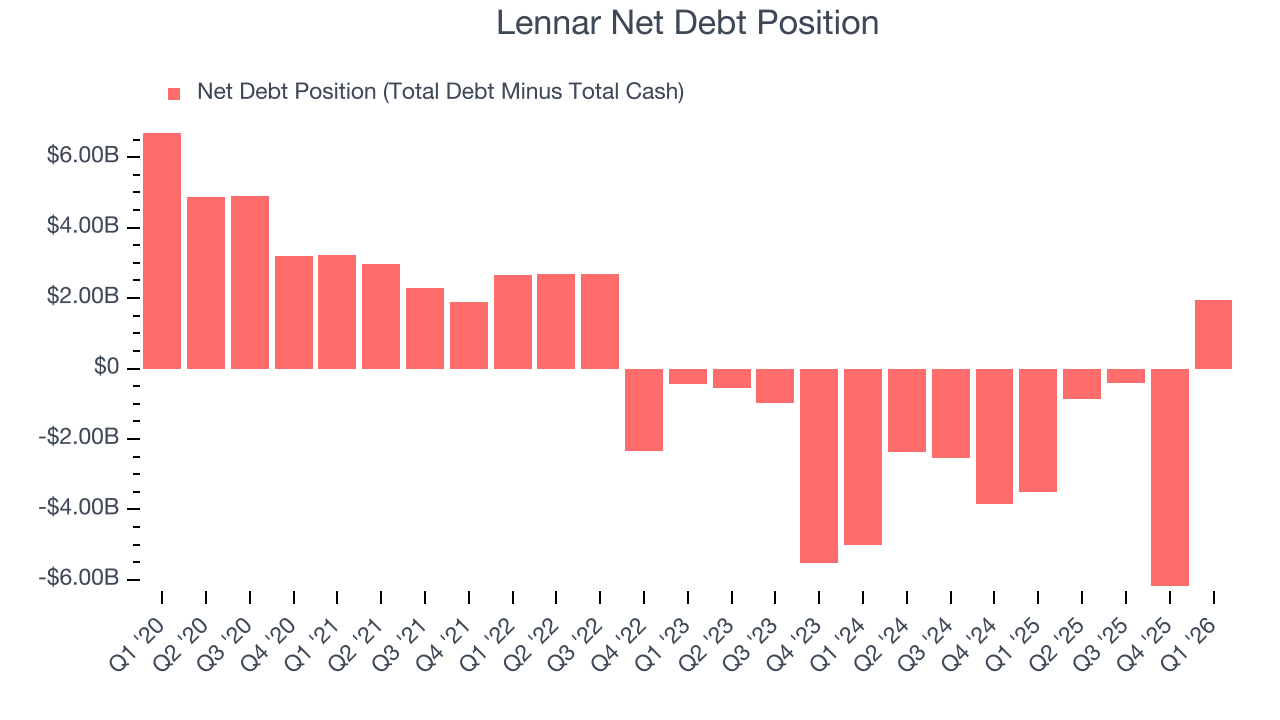
With $2.32 billion of EBITDA over the last 12 months, we view Lennar’s 0.8× net-debt-to-EBITDA ratio as safe. We also see its $114.6 million of annual interest expenses as appropriate. The company’s profits give it plenty of breathing room, allowing it to continue investing in growth initiatives.
12. Key Takeaways from Lennar’s Q1 Results
We struggled to find many positives in these results. Its revenue missed and its EPS fell short of Wall Street’s estimates. Overall, this was a softer quarter. The stock traded down 1.1% to $92.25 immediately after reporting.
13. Is Now The Time To Buy Lennar?
Updated: March 29, 2026 at 11:20 PM EDT
The latest quarterly earnings matters, sure, but we actually think longer-term fundamentals and valuation matter more. Investors should consider all these pieces before deciding whether or not to invest in Lennar.
We see the value of companies helping their customers, but in the case of Lennar, we’re out. For starters, its revenue growth was mediocre over the last five years, and analysts expect its demand to deteriorate over the next 12 months. While its strong operating margins show it’s a well-run business, the downside is its diminishing returns show management's prior bets haven't worked out. On top of that, its projected EPS for the next year is lacking.
Lennar’s P/E ratio based on the next 12 months is 14.6x. While this valuation is fair, the upside isn’t great compared to the potential downside. There are better stocks to buy right now.
Wall Street analysts have a consensus one-year price target of $101.93 on the company (compared to the current share price of $89.65).