Eli Lilly (LLY)
Eli Lilly is a world-class company. Its superior revenue growth and returns on capital show it can achieve fast and profitable expansion.― StockStory Analyst Team
1. News


2. Summary
Why We Like Eli Lilly
Founded in 1876 by a Civil War veteran and pharmacist frustrated with the poor quality of medicines, Eli Lilly (NYSE:LLY) discovers, develops, and manufactures pharmaceutical products for conditions including diabetes, obesity, cancer, immunological disorders, and neurological diseases.
- Annual revenue growth of 38.2% over the last two years was superb and indicates its market share increased during this cycle
- Earnings growth has massively outpaced its peers over the last five years as its EPS has compounded at 25% annually
- Revenue outlook for the upcoming 12 months is outstanding and shows it’s on track to gain market share


Eli Lilly is a top-tier company. The valuation looks reasonable when considering its quality, and we believe now is the time to invest.
Why Is Now The Time To Buy Eli Lilly?


Eli Lilly is trading at $983.75 per share, or 28.2x forward P/E. While this multiple is higher than most healthcare companies, we think the valuation is fair given its quality characteristics.
Entry price may seem important in the moment, but our work shows that time and again, long-term market outperformance is determined by business quality rather than getting an absolute bargain on a stock.
3. Eli Lilly (LLY) Research Report: Q4 CY2025 Update
Global pharmaceutical company Eli Lilly (NYSE:LLY) reported Q4 CY2025 results exceeding the market’s revenue expectations, with sales up 42.6% year on year to $19.29 billion. The company’s full-year revenue guidance of $81.5 billion at the midpoint came in 5.1% above analysts’ estimates. Its non-GAAP profit of $7.54 per share was 8.7% above analysts’ consensus estimates.
Eli Lilly (LLY) Q4 CY2025 Highlights:
- Revenue: $19.29 billion vs analyst estimates of $17.96 billion (42.6% year-on-year growth, 7.4% beat)
- Adjusted EPS: $7.54 vs analyst estimates of $6.93 (8.7% beat)
- Adjusted EPS guidance for the upcoming financial year 2026 is $34.25 at the midpoint, beating analyst estimates by 2.9%
- Operating Margin: 43.4%, up from 38% in the same quarter last year
- Market Capitalization: $898.5 billion
Company Overview
Founded in 1876 by a Civil War veteran and pharmacist frustrated with the poor quality of medicines, Eli Lilly (NYSE:LLY) discovers, develops, and manufactures pharmaceutical products for conditions including diabetes, obesity, cancer, immunological disorders, and neurological diseases.
Eli Lilly's product portfolio spans several major therapeutic areas. Its diabetes and obesity medications include insulin products like Humalog and Humulin, as well as newer treatments like Mounjaro for type 2 diabetes and Zepbound for obesity. These GLP-1 receptor agonists have become significant growth drivers for the company due to the massive addressable markets. In oncology, Lilly markets treatments such as Verzenio for breast cancer and Retevmo for certain lung and thyroid cancers. The company's immunology portfolio includes Taltz for psoriasis and psoriatic arthritis, while its neuroscience offerings feature Emgality for migraine prevention.
Lilly generates revenue primarily through prescription drug sales to wholesalers, who then distribute to pharmacies, hospitals, and other healthcare facilities. The company maintains its own sales force in most countries, supplemented by contract sales organizations in some markets. In the U.S., three major wholesalers—McKesson, Cencora (formerly AmerisourceBergen), and Cardinal Health—account for a significant portion of Lilly's consolidated revenue.
Lilly operates globally, with manufacturing facilities in the United States (including Puerto Rico), Europe, and Asia. The company sells its products in over 100 countries, adapting its marketing approaches to meet local needs and regulatory requirements.
4. Branded Pharmaceuticals
Looking ahead, the branded pharmaceutical industry is positioned for tailwinds from advancements in precision medicine, increasing adoption of AI to enhance drug development efficiency, and growing global demand for treatments addressing chronic and rare diseases. However, headwinds include heightened regulatory scrutiny, pricing pressures from governments and insurers, and the looming patent cliffs for key blockbuster drugs. Patent cliffs bring about competition from generics, forcing branded pharmaceutical companies back to the drawing board to find the next big thing.
Eli Lilly's main competitors include other large pharmaceutical companies such as Novo Nordisk (NYSE:NVO), particularly in the diabetes and obesity markets, Pfizer (NYSE:PFE), Merck (NYSE:MRK), Johnson & Johnson (NYSE:JNJ), AbbVie (NYSE:ABBV), and Bristol Myers Squibb (NYSE:BMY).
5. Economies of Scale
Larger companies benefit from economies of scale, where fixed costs like infrastructure, technology, and administration are spread over a higher volume of goods or services, reducing the cost per unit. Scale can also lead to bargaining power with suppliers, greater brand recognition, and more investment firepower. A virtuous cycle can ensue if a scaled company plays its cards right.
With $65.18 billion in revenue over the past 12 months, Eli Lilly is one of the most scaled enterprises in healthcare. This is particularly important because branded pharmaceuticals companies are volume-driven businesses due to their low margins.
6. Revenue Growth
A company’s long-term sales performance can indicate its overall quality. Any business can have short-term success, but a top-tier one grows for years. Thankfully, Eli Lilly’s 21.6% annualized revenue growth over the last five years was excellent. Its growth surpassed the average healthcare company and shows its offerings resonate with customers, a great starting point for our analysis.
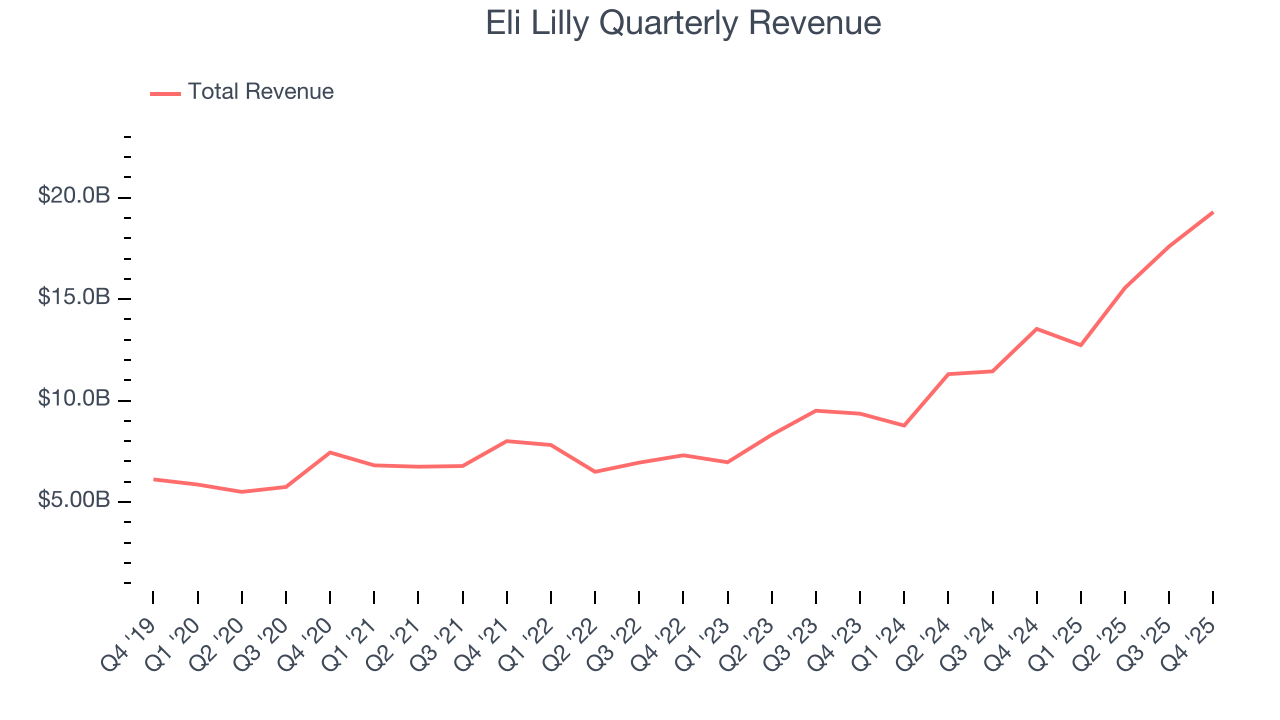
Long-term growth is the most important, but within healthcare, a half-decade historical view may miss new innovations or demand cycles. Eli Lilly’s annualized revenue growth of 38.2% over the last two years is above its five-year trend, suggesting its demand was strong and recently accelerated. 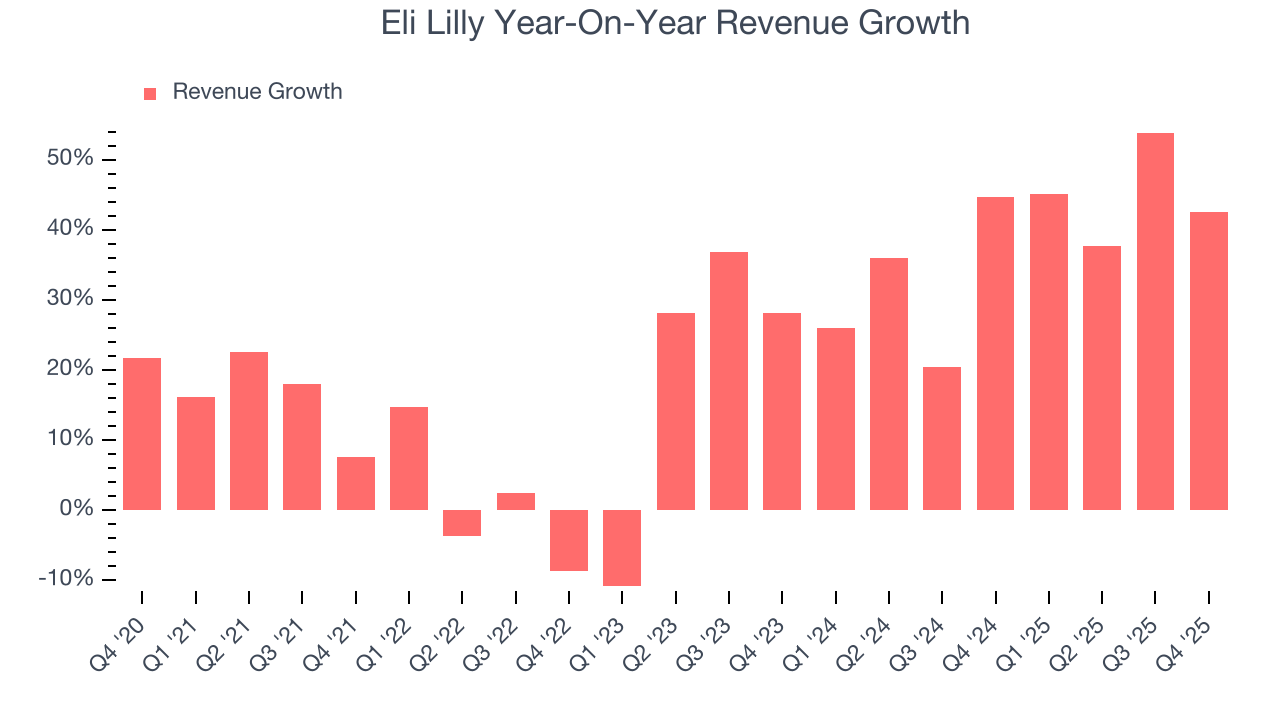
This quarter, Eli Lilly reported magnificent year-on-year revenue growth of 42.6%, and its $19.29 billion of revenue beat Wall Street’s estimates by 7.4%.
Looking ahead, sell-side analysts expect revenue to grow 19.7% over the next 12 months, a deceleration versus the last two years. Still, this projection is eye-popping given its scale and implies the market is baking in success for its products and services.
7. Operating Margin
Operating margin is one of the best measures of profitability because it tells us how much money a company takes home after subtracting all core expenses, like marketing and R&D.
Eli Lilly has been an efficient company over the last five years. It was one of the more profitable businesses in the healthcare sector, boasting an average operating margin of 29.4%.
Looking at the trend in its profitability, Eli Lilly’s operating margin rose by 17.9 percentage points over the last five years, as its sales growth gave it immense operating leverage. This performance was mostly driven by its recent improvements as the company’s margin has increased by 21.4 percentage points on a two-year basis. These data points are very encouraging and show momentum is on its side.
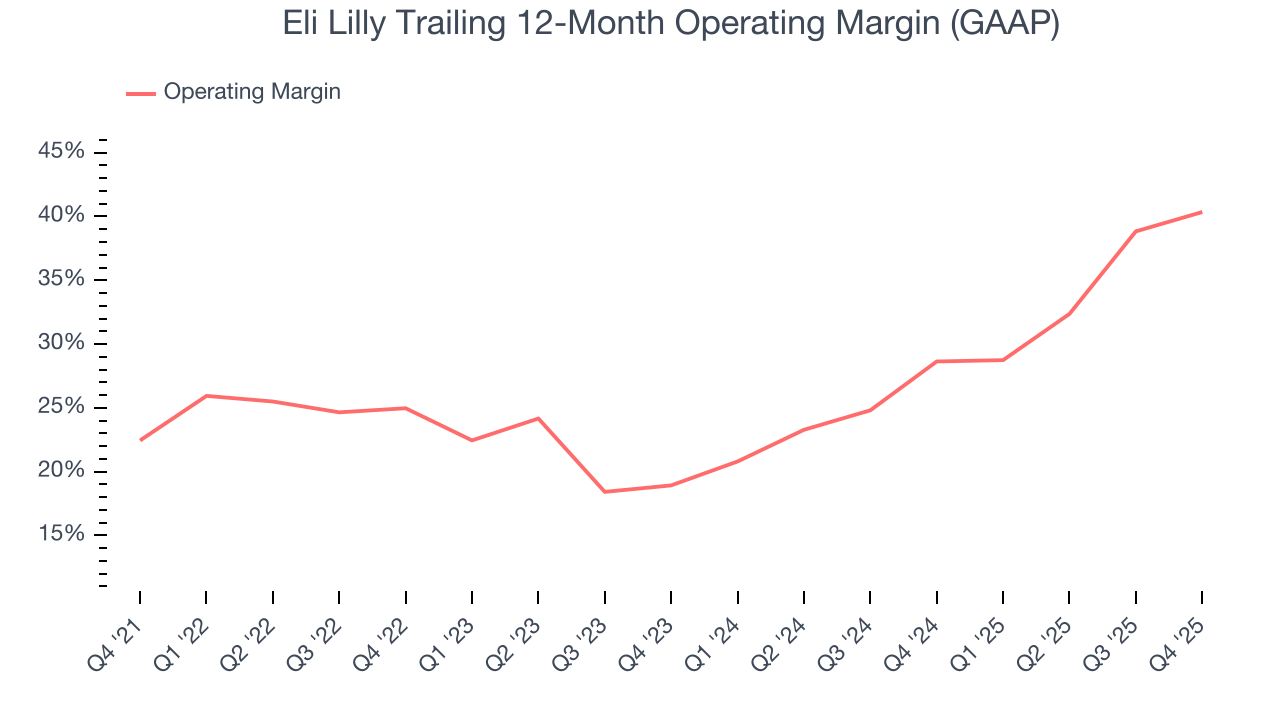
This quarter, Eli Lilly generated an operating margin profit margin of 43.4%, up 5.4 percentage points year on year. This increase was a welcome development and shows it was more efficient.
8. Earnings Per Share
Revenue trends explain a company’s historical growth, but the long-term change in earnings per share (EPS) points to the profitability of that growth – for example, a company could inflate its sales through excessive spending on advertising and promotions.
Eli Lilly’s EPS grew at an astounding 29% compounded annual growth rate over the last five years, higher than its 21.6% annualized revenue growth. This tells us the company became more profitable on a per-share basis as it expanded.
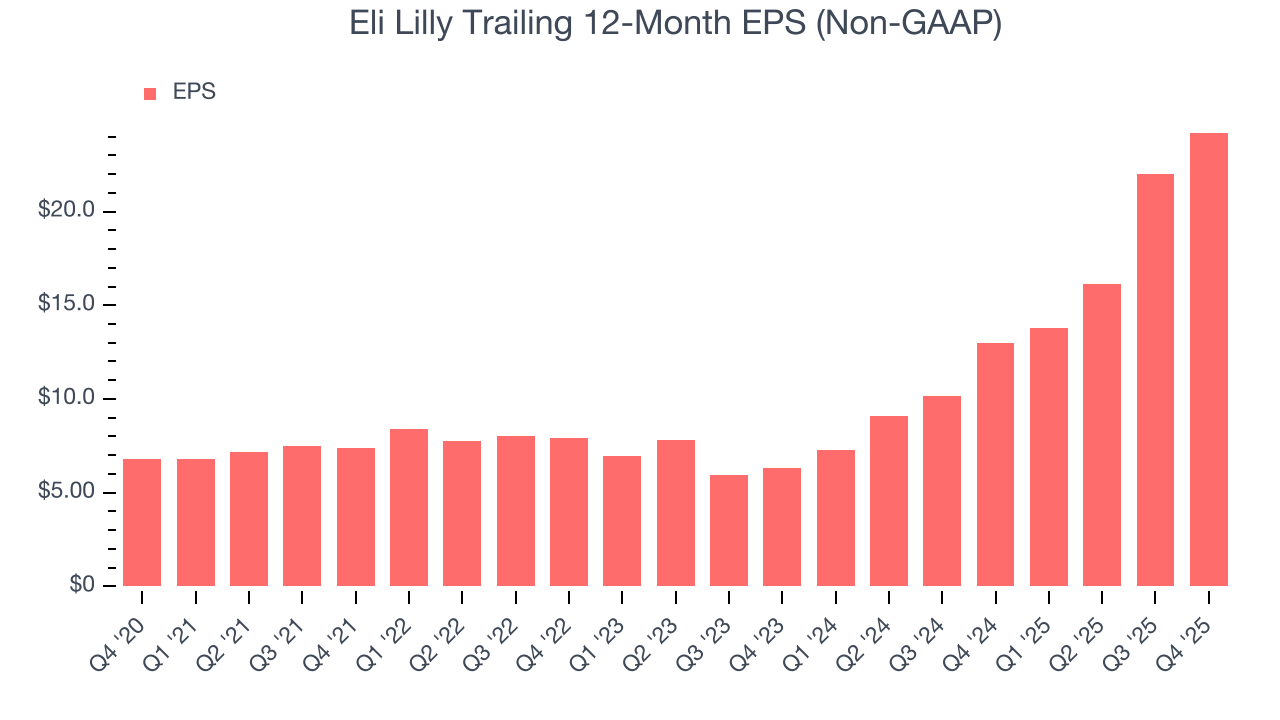
We can take a deeper look into Eli Lilly’s earnings quality to better understand the drivers of its performance. As we mentioned earlier, Eli Lilly’s operating margin expanded by 17.9 percentage points over the last five years. On top of that, its share count shrank by 1.6%. These are positive signs for shareholders because improving profitability and share buybacks turbocharge EPS growth relative to revenue growth. 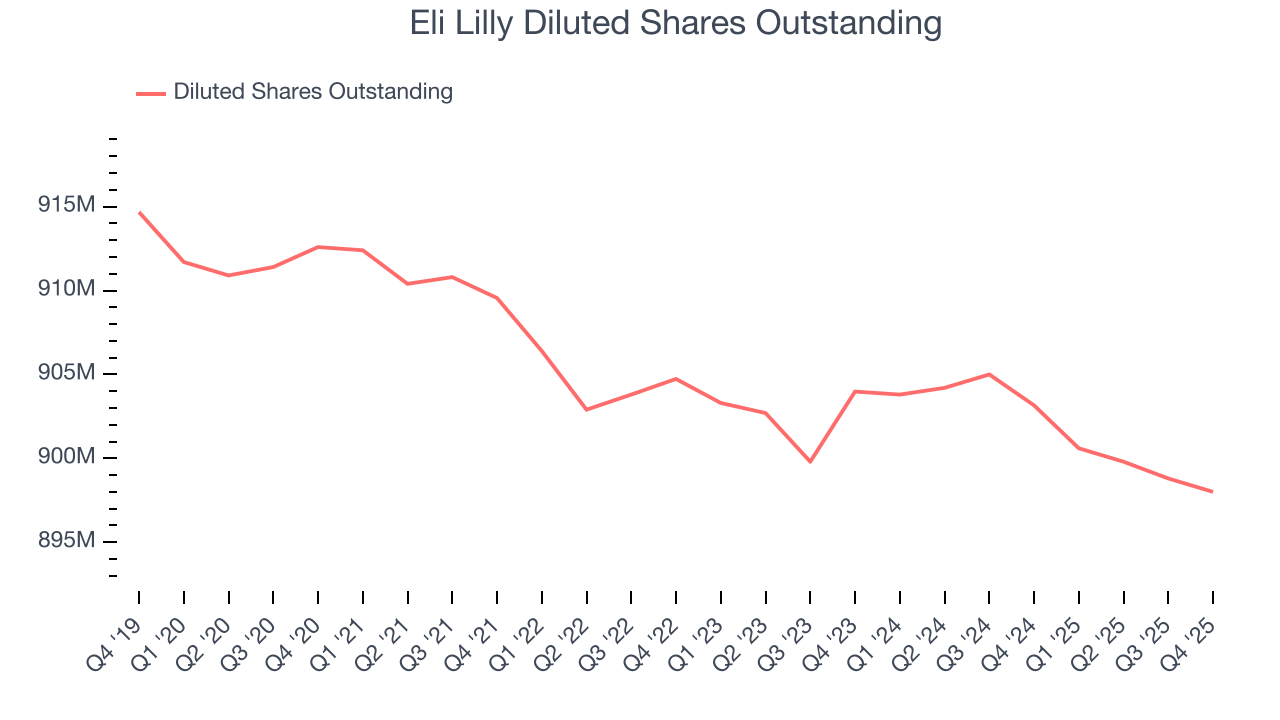
In Q4, Eli Lilly reported adjusted EPS of $7.54, up from $5.32 in the same quarter last year. This print beat analysts’ estimates by 8.7%. Over the next 12 months, Wall Street expects Eli Lilly’s full-year EPS of $24.21 to grow 39.8%.
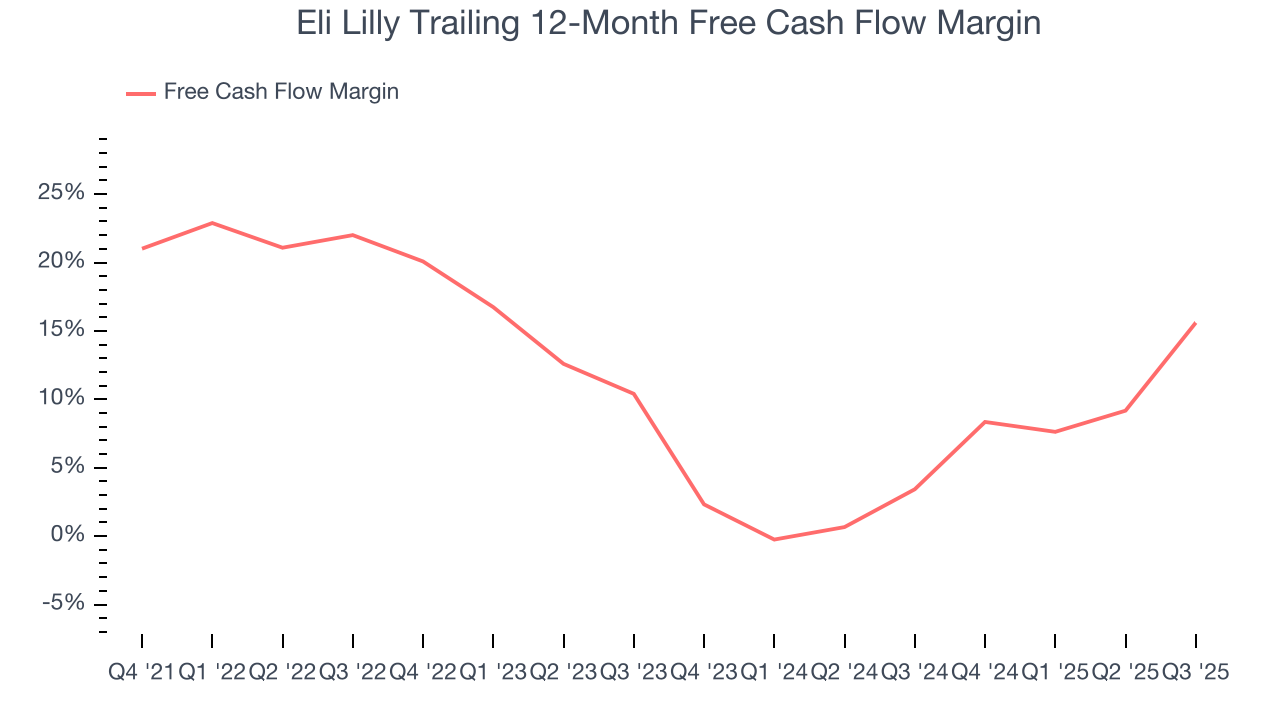
9. Cash Is King
If you’ve followed StockStory for a while, you know we emphasize free cash flow. Why, you ask? We believe that in the end, cash is king, and you can’t use accounting profits to pay the bills.
Eli Lilly has shown impressive cash profitability, giving it the option to reinvest or return capital to investors. The company’s free cash flow margin averaged 13.5% over the last five years, better than the broader healthcare sector.
Taking a step back, we can see that Eli Lilly’s margin dropped by 2 percentage points during that time. We’re willing to live with its performance for now but hope its cash conversion can rise soon. If its declines continue, it could signal increasing investment needs and capital intensity.
10. Return on Invested Capital (ROIC)
EPS and free cash flow tell us whether a company was profitable while growing its revenue. But was it capital-efficient? Enter ROIC, a metric showing how much operating profit a company generates relative to the money it has raised (debt and equity).
Eli Lilly’s five-year average ROIC was 25.2%, placing it among the best healthcare companies. This illustrates its management team’s ability to invest in highly profitable ventures and produce tangible results for shareholders.
We like to invest in businesses with high returns, but the trend in a company’s ROIC is what often surprises the market and moves the stock price. Unfortunately, Eli Lilly’s ROIC has decreased over the last few years. Only time will tell if its new bets can bear fruit and potentially reverse the trend.
11. Balance Sheet Assessment
Eli Lilly reported $14.77 billion of cash and $42.11 billion of debt on its balance sheet in the most recent quarter. As investors in high-quality companies, we primarily focus on two things: 1) that a company’s debt level isn’t too high and 2) that its interest payments are not excessively burdening the business.
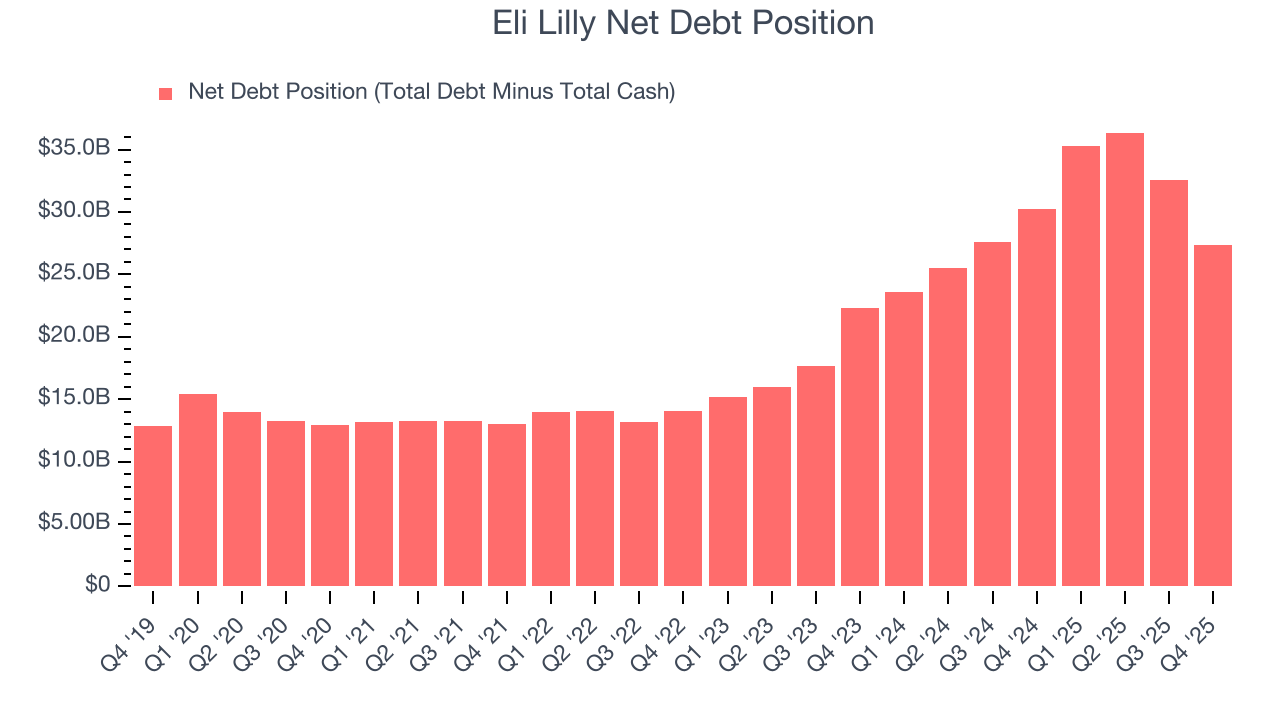
With $29.01 billion of EBITDA over the last 12 months, we view Eli Lilly’s 0.9× net-debt-to-EBITDA ratio as safe. We also see its $642 million of annual interest expenses as appropriate. The company’s profits give it plenty of breathing room, allowing it to continue investing in growth initiatives.
12. Key Takeaways from Eli Lilly’s Q4 Results
We were impressed by how significantly Eli Lilly blew past analysts’ revenue expectations this quarter. We were also glad its full-year revenue guidance trumped Wall Street’s estimates. Zooming out, we think this was a solid print. The stock traded up 8.5% to $1,089 immediately following the results.
13. Is Now The Time To Buy Eli Lilly?
Updated: March 15, 2026 at 12:15 AM EDT
A common mistake we notice when investors are deciding whether to buy a stock or not is that they simply look at the latest earnings results. Business quality and valuation matter more, so we urge you to understand these dynamics as well.
There are multiple reasons why we think Eli Lilly is an elite healthcare company. For starters, its revenue growth was impressive over the last five years and is expected to accelerate over the next 12 months. And while its cash profitability fell over the last five years, its scale makes it a trusted partner with negotiating leverage. Additionally, Eli Lilly’s expanding adjusted operating margin shows the business has become more efficient.
Eli Lilly’s P/E ratio based on the next 12 months is 28.2x. Looking at the healthcare space today, Eli Lilly’s qualities as one of the best businesses really stand out, and we like it at this price.
Wall Street analysts have a consensus one-year price target of $1,217 on the company (compared to the current share price of $983.75), implying they see 23.7% upside in buying Eli Lilly in the short term.