
Luxfer (LXFR)
Luxfer keeps us up at night. Its weak sales growth and low returns on capital show it struggled to generate demand and profits.― StockStory Analyst Team
1. News


2. Summary
Why We Think Luxfer Will Underperform
With its magnesium alloys used in the construction of the famous Spirit of St. Louis aircraft, Luxfer (NYSE:LXFR) offers specialized materials, components, and gas containment devices to various industries.
- Customers postponed purchases of its products and services this cycle as its revenue declined by 2.6% annually over the last two years
- Projected sales decline of 6.5% over the next 12 months indicates demand will continue deteriorating
- Earnings growth underperformed the sector average over the last five years as its EPS grew by just 2.3% annually


Luxfer’s quality is lacking. There are more rewarding stocks elsewhere.
Why There Are Better Opportunities Than Luxfer


Luxfer is trading at $11.53 per share, or 10.6x forward P/E. Luxfer’s valuation may seem like a bargain, especially when stacked up against other industrials companies. We remind you that you often get what you pay for, though.
It’s better to pay up for high-quality businesses with higher long-term earnings potential rather than to buy lower-quality stocks because they appear cheap. These challenged businesses often don’t re-rate, a phenomenon known as a “value trap”.
3. Luxfer (LXFR) Research Report: Q4 CY2025 Update
Speciality material and gas containment company Luxfer (NYSE:LXFR) missed Wall Street’s revenue expectations in Q4 CY2025, with sales falling 12.3% year on year to $90.7 million. Its non-GAAP profit of $0.24 per share was in line with analysts’ consensus estimates.
Luxfer (LXFR) Q4 CY2025 Highlights:
- Revenue: $90.7 million vs analyst estimates of $92.8 million (12.3% year-on-year decline, 2.3% miss)
- Adjusted EPS: $0.24 vs analyst estimates of $0.24 (in line)
- Adjusted EBITDA: $13 million vs analyst estimates of $11.5 million (14.3% margin, 13% beat)
- Adjusted EPS guidance for the upcoming financial year 2026 is $1.13 at the midpoint, missing analyst estimates by 4.7%
- EBITDA guidance for the upcoming financial year 2026 is $52.5 million at the midpoint, in line with analyst expectations
- Operating Margin: 3.6%, down from 9.1% in the same quarter last year
- Free Cash Flow Margin: 13.7%, down from 21.8% in the same quarter last year
- Market Capitalization: $405.4 million
Company Overview
With its magnesium alloys used in the construction of the famous Spirit of St. Louis aircraft, Luxfer (NYSE:LXFR) offers specialized materials, components, and gas containment devices to various industries.
Luxfer Group, founded in 1898 in Manchester, England, began with developing and patenting magnesium alloys for lightweight, high-strength applications. Early successes included photographic flashbulbs and the world's first aluminum gas cylinders. Throughout the 20th century, Luxfer expanded its product line to include gas cylinders and composite materials, meeting growing demands in healthcare, environmental technology, and aerospace.
The company’s product offerings include high-pressure gas cylinders, magnesium alloys, zirconium chemicals and materials, and carbon composite materials, among others. Luxfer’s products are designed to meet the requirements of a broad array of end markets. These markets include environmental technologies, healthcare, protection, specialty automotive systems, and aerospace. Each of these sectors relies on Luxfer for materials for performance under extreme conditions. For instance, in the healthcare sector, Luxfer's lightweight oxygen cylinders are integral for portable medical oxygen systems used in ambulances and emergency medical services. Similarly, in the aerospace industry, Luxfer provides advanced materials that are essential for manufacturing components that can withstand high temperatures and corrosive environments.
Luxfer also produces products for the graphic art industry, primarily known for its magnesium photo-engraving plates, copper and zinc plates for luxury packaging, alongside developer solutions that aid in the engraving process. However, the company has decided to divest its Graphic Arts Segment as part of a strategic shift to focus on high-performance materials and advanced industrial applications. The planned divestiture in 2024 aims to streamline Luxfer's operations and focus resources on areas with higher strategic importance and potential for growth within its portfolio.
4. General Industrial Machinery
Automation that increases efficiency and connected equipment that collects analyzable data have been trending, creating new demand for general industrial machinery companies. Those who innovate and create digitized solutions can spur sales and speed up replacement cycles, but all general industrial machinery companies are still at the whim of economic cycles. Consumer spending and interest rates, for example, can greatly impact the industrial production that drives demand for these companies’ offerings.
Competitors offering similar products include Worthington (NYSE:WOR), Constellium (NYSE:CSTM), and Dynamic Materials (NASDAQ:BOOM).
5. Revenue Growth
Examining a company’s long-term performance can provide clues about its quality. Any business can put up a good quarter or two, but many enduring ones grow for years. Regrettably, Luxfer’s sales grew at a sluggish 3.4% compounded annual growth rate over the last five years. This was below our standard for the industrials sector and is a poor baseline for our analysis.
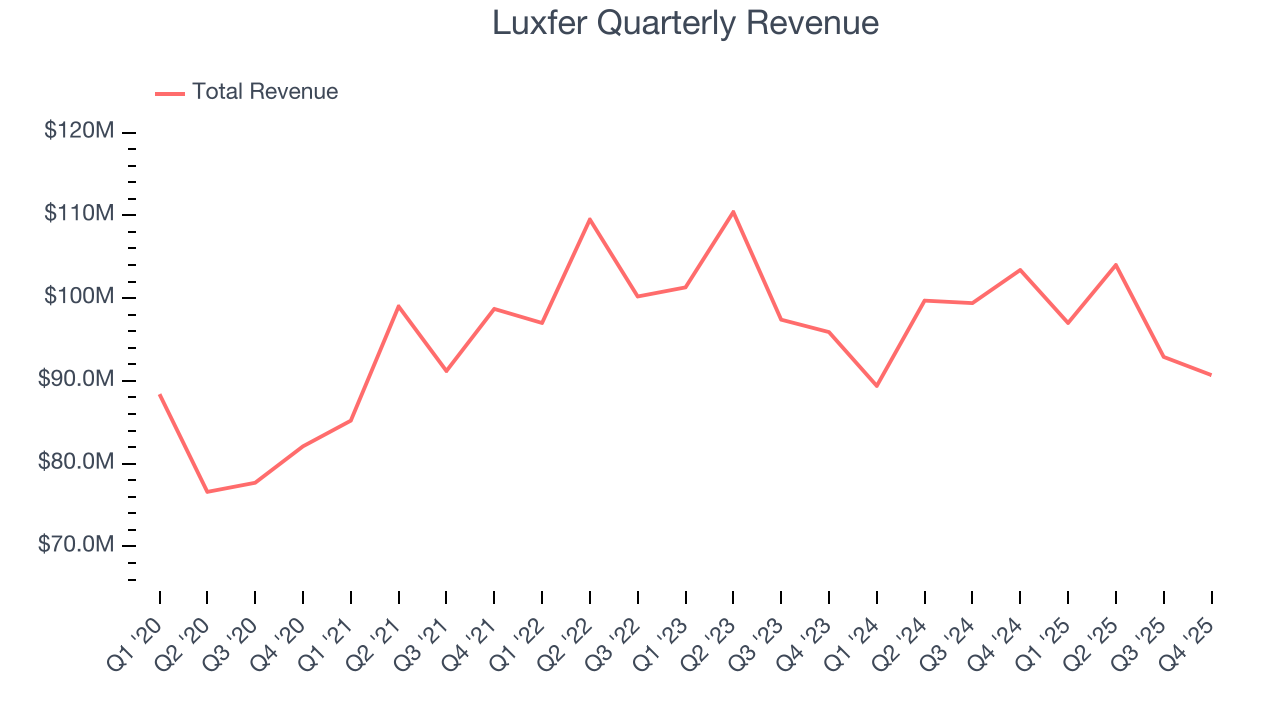
Long-term growth is the most important, but within industrials, a half-decade historical view may miss new industry trends or demand cycles. Luxfer’s performance shows it grew in the past but relinquished its gains over the last two years, as its revenue fell by 2.6% annually. 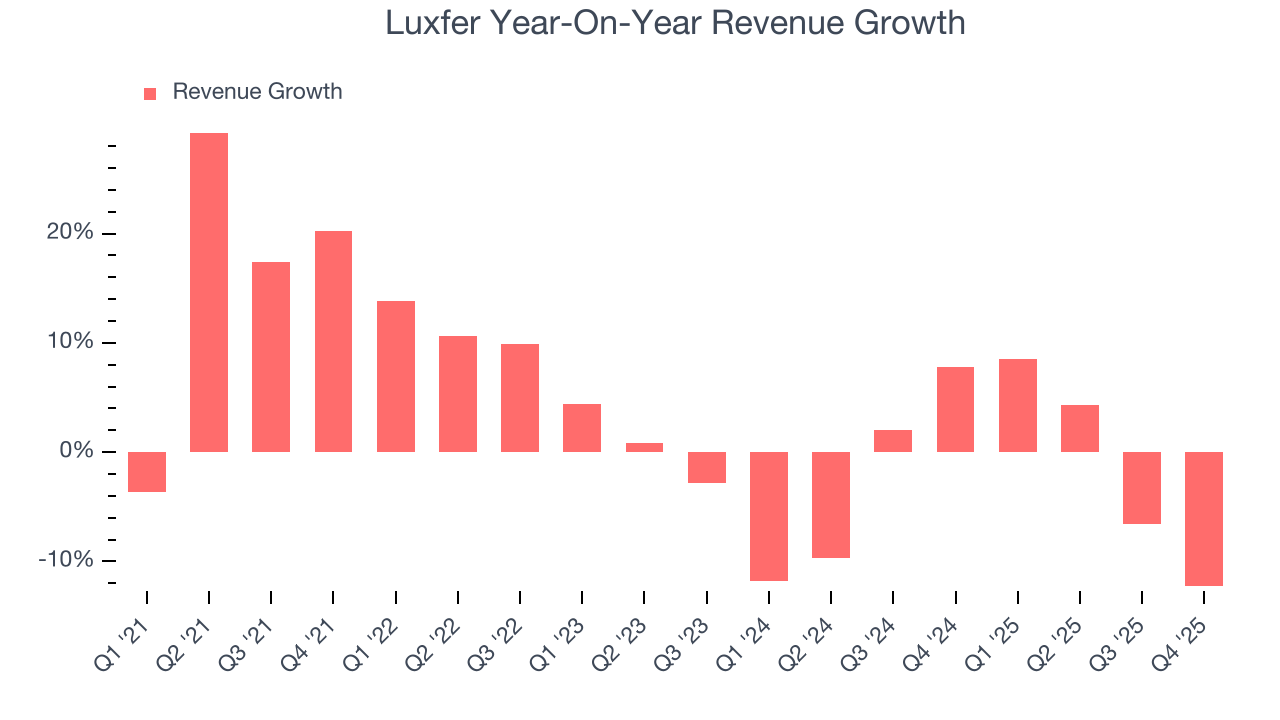
This quarter, Luxfer missed Wall Street’s estimates and reported a rather uninspiring 12.3% year-on-year revenue decline, generating $90.7 million of revenue.
Looking ahead, sell-side analysts expect revenue to remain flat over the next 12 months. While this projection suggests its newer products and services will catalyze better top-line performance, it is still below average for the sector.
6. Gross Margin & Pricing Power
All else equal, we prefer higher gross margins because they make it easier to generate more operating profits and indicate that a company commands pricing power by offering more differentiated products.
Luxfer’s unit economics are better than the typical industrials business, signaling its products are somewhat differentiated through quality or brand.As you can see below, it averaged a decent 31.1% gross margin over the last five years. That means for every $100 in revenue, roughly $31.09 was left to spend on selling, marketing, R&D, and general administrative overhead. 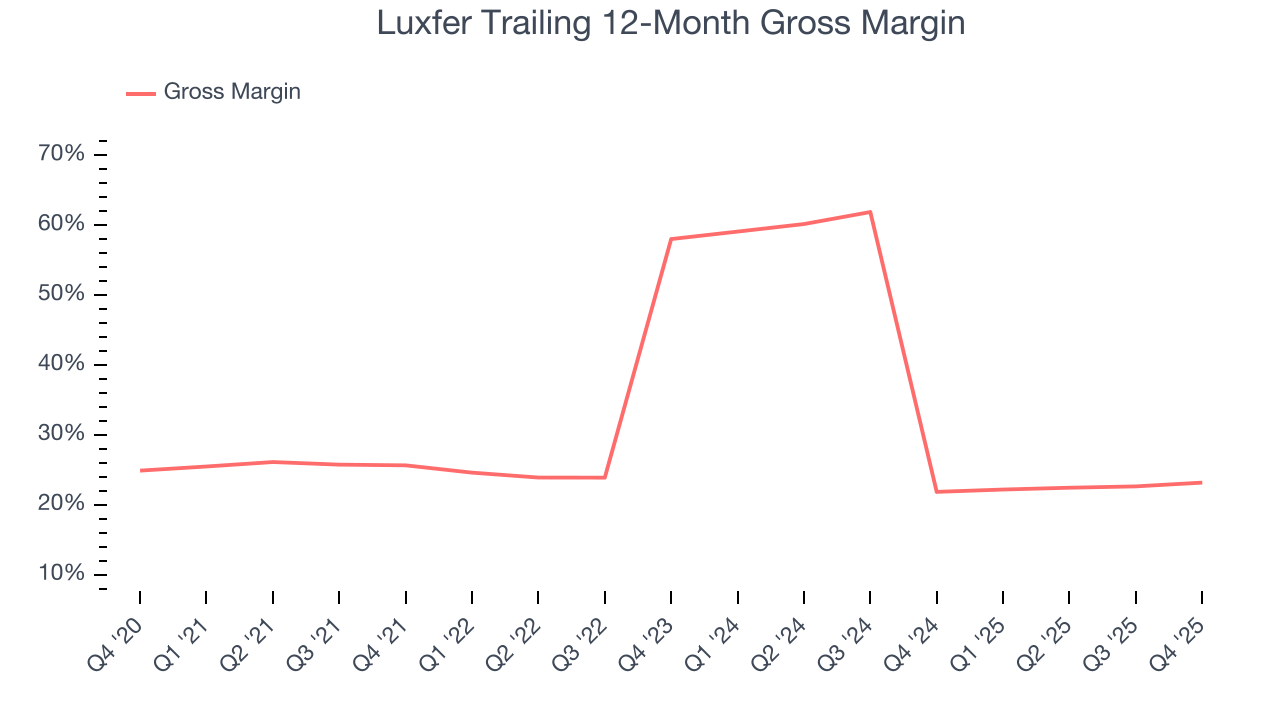
Luxfer produced a 24.4% gross profit margin in Q4, up 2.2 percentage points year on year. Luxfer’s full-year margin has also been trending up over the past 12 months, increasing by 1.3 percentage points. If this move continues, it could suggest better unit economics due to some combination of stable to improving pricing power and input costs (such as raw materials).
7. Operating Margin
Operating margin is one of the best measures of profitability because it tells us how much money a company takes home after procuring and manufacturing its products, marketing and selling those products, and most importantly, keeping them relevant through research and development.
Luxfer has done a decent job managing its cost base over the last five years. The company has produced an average operating margin of 8.2%, higher than the broader industrials sector.
Analyzing the trend in its profitability, Luxfer’s operating margin decreased by 4.2 percentage points over the last five years. This raises questions about the company’s expense base because its revenue growth should have given it leverage on its fixed costs, resulting in better economies of scale and profitability.
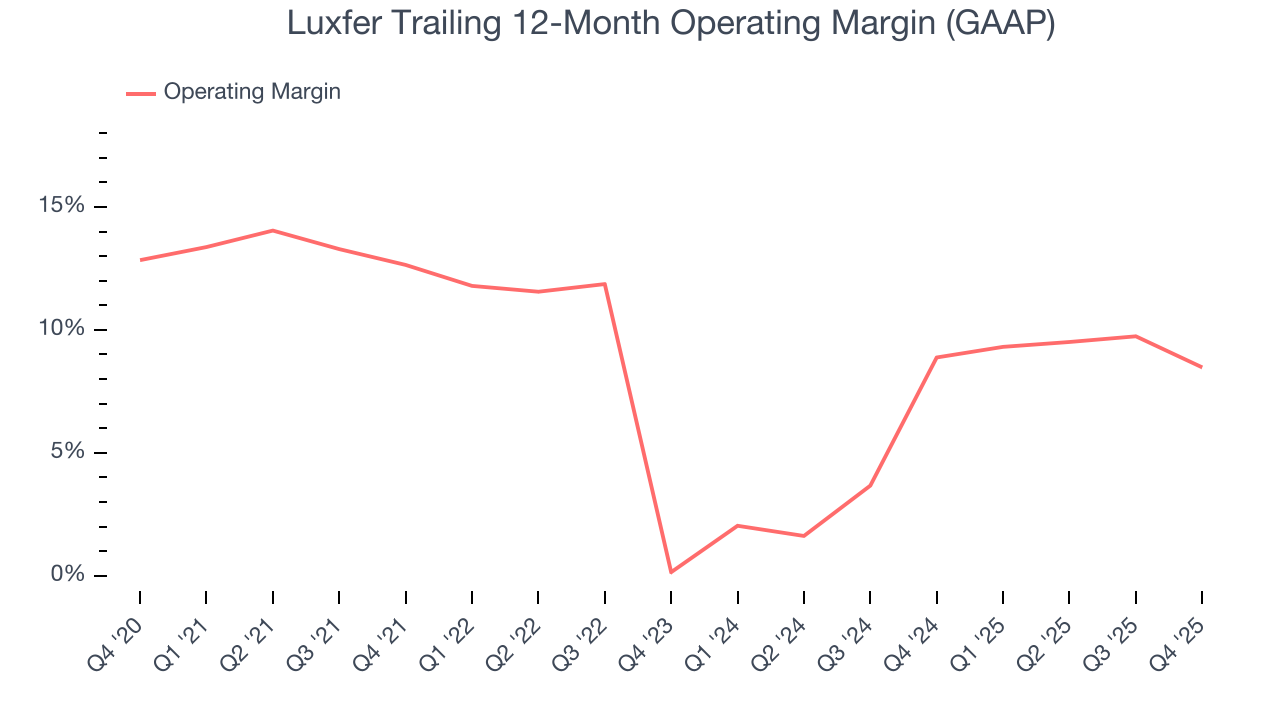
This quarter, Luxfer generated an operating margin profit margin of 3.6%, down 5.5 percentage points year on year. Conversely, its gross margin actually rose, so we can assume its recent inefficiencies were driven by increased operating expenses like marketing, R&D, and administrative overhead.
8. Earnings Per Share
We track the long-term change in earnings per share (EPS) for the same reason as long-term revenue growth. Compared to revenue, however, EPS highlights whether a company’s growth is profitable.
Luxfer’s weak 1.6% annual EPS growth over the last five years aligns with its revenue performance. This tells us it maintained its per-share profitability as it expanded.
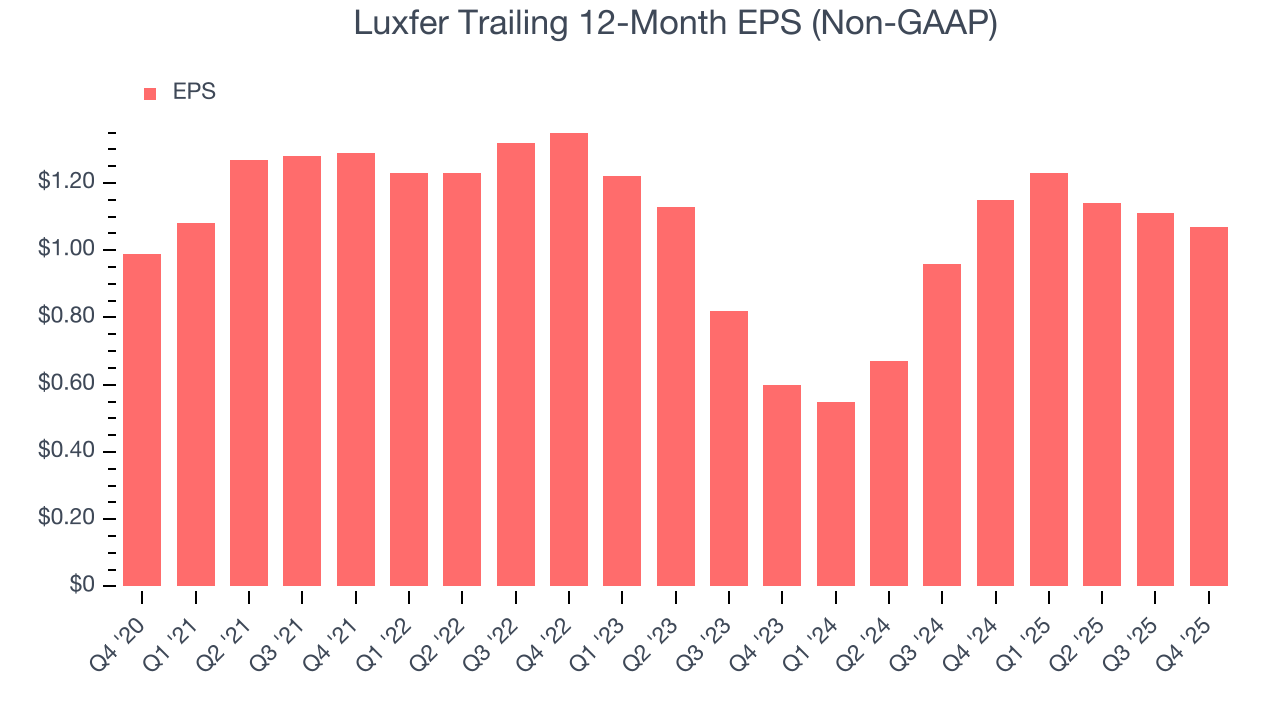
Like with revenue, we analyze EPS over a more recent period because it can provide insight into an emerging theme or development for the business.
Luxfer’s two-year annual EPS growth of 33.5% was fantastic and topped its two-year revenue performance.
Diving into the nuances of Luxfer’s earnings can give us a better understanding of its performance. While we mentioned earlier that Luxfer’s operating margin declined this quarter, a two-year view shows its margin has expanded. This was the most relevant factor (aside from the revenue impact) behind its higher earnings; interest expenses and taxes can also affect EPS but don’t tell us as much about a company’s fundamentals.
In Q4, Luxfer reported adjusted EPS of $0.24, down from $0.28 in the same quarter last year. This print was close to analysts’ estimates. Over the next 12 months, Wall Street expects Luxfer’s full-year EPS of $1.07 to grow 9.3%.
9. Cash Is King
Free cash flow isn't a prominently featured metric in company financials and earnings releases, but we think it's telling because it accounts for all operating and capital expenses, making it tough to manipulate. Cash is king.
Luxfer has shown mediocre cash profitability over the last five years, giving the company limited opportunities to return capital to shareholders. Its free cash flow margin averaged 4.8%, subpar for an industrials business.
Taking a step back, an encouraging sign is that Luxfer’s margin expanded by 2.3 percentage points during that time. The company’s improvement shows it’s heading in the right direction, and we can see it became a less capital-intensive business because its free cash flow profitability rose while its operating profitability fell.
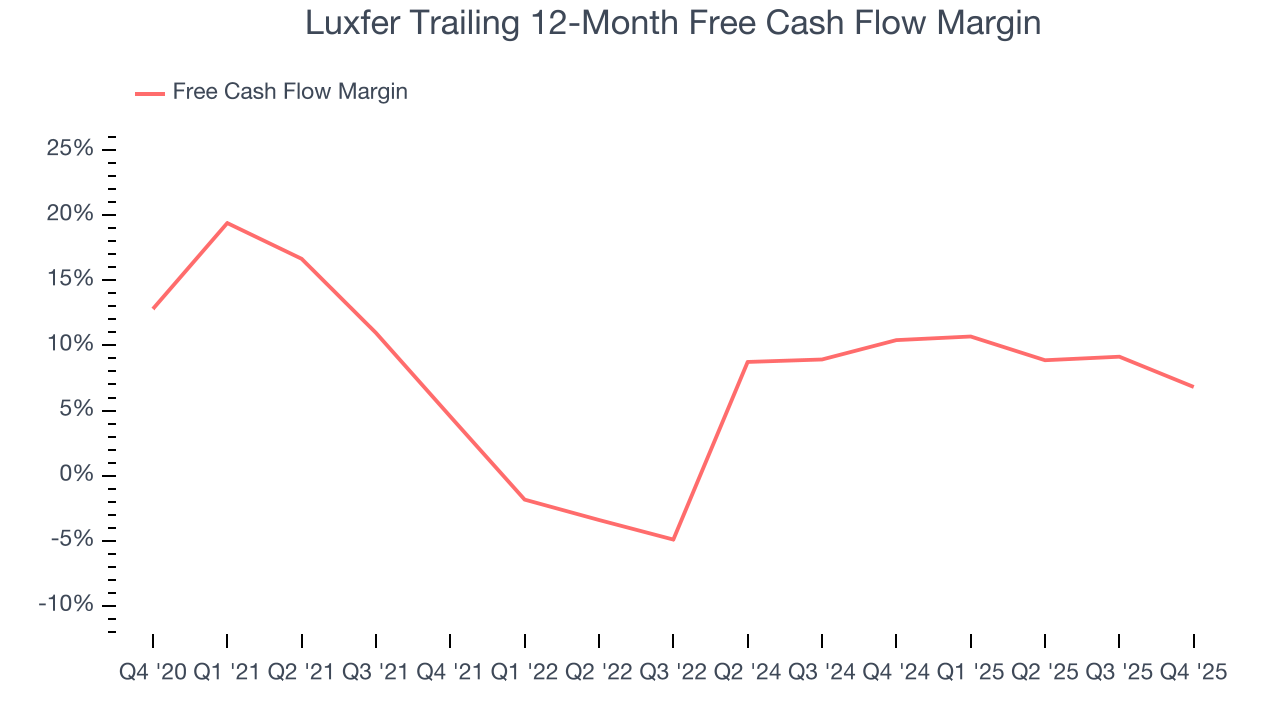
Luxfer’s free cash flow clocked in at $12.4 million in Q4, equivalent to a 13.7% margin. The company’s cash profitability regressed as it was 8.1 percentage points lower than in the same quarter last year, but it’s still above its five-year average. We wouldn’t read too much into this quarter’s decline because investment needs can be seasonal, leading to short-term swings. Long-term trends trump temporary fluctuations.
10. Return on Invested Capital (ROIC)
EPS and free cash flow tell us whether a company was profitable while growing its revenue. But was it capital-efficient? A company’s ROIC explains this by showing how much operating profit it makes compared to the money it has raised (debt and equity).
Luxfer historically did a mediocre job investing in profitable growth initiatives. Its five-year average ROIC was 9%, somewhat low compared to the best industrials companies that consistently pump out 20%+.
We like to invest in businesses with high returns, but the trend in a company’s ROIC is what often surprises the market and moves the stock price. On average, Luxfer’s ROIC increased by 1.6 percentage points annually each year over the last few years. This is a good sign, and we hope the company can continue improving.
11. Balance Sheet Assessment
Luxfer reported $10.7 million of cash and $39.4 million of debt on its balance sheet in the most recent quarter. As investors in high-quality companies, we primarily focus on two things: 1) that a company’s debt level isn’t too high and 2) that its interest payments are not excessively burdening the business.
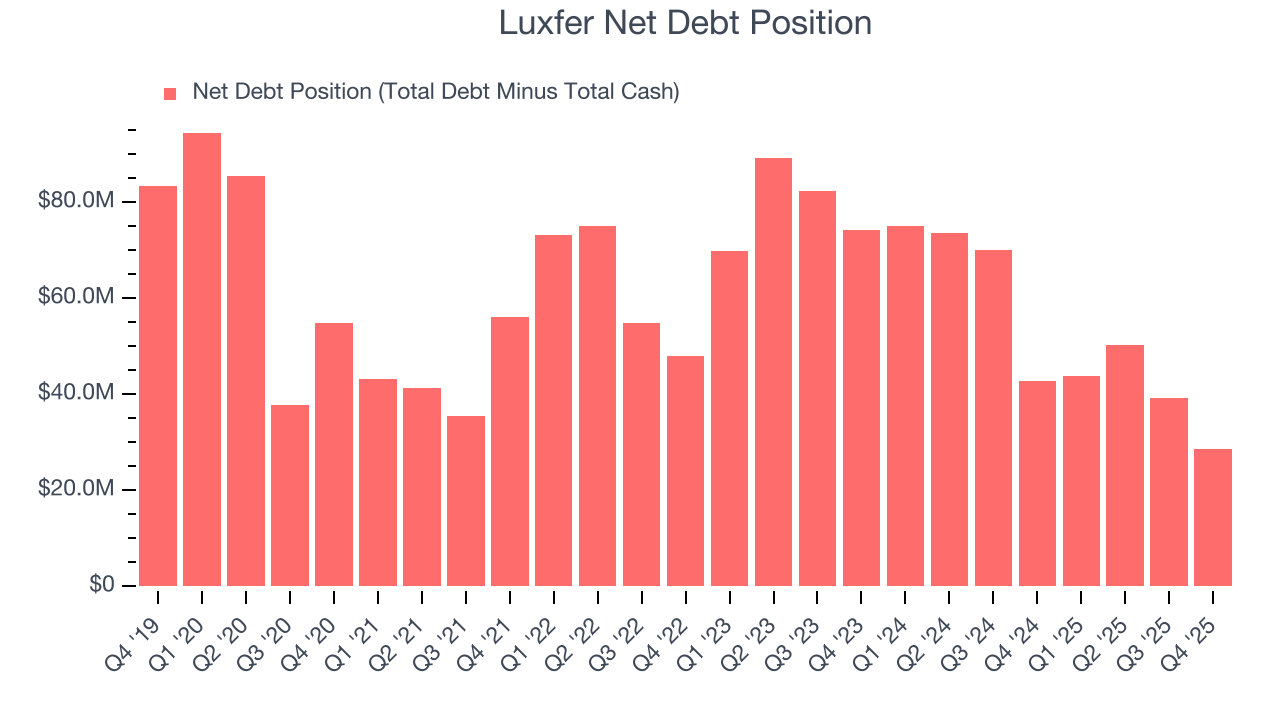
With $51.9 million of EBITDA over the last 12 months, we view Luxfer’s 0.6× net-debt-to-EBITDA ratio as safe. We also see its $3.1 million of annual interest expenses as appropriate. The company’s profits give it plenty of breathing room, allowing it to continue investing in growth initiatives.
12. Key Takeaways from Luxfer’s Q4 Results
We were impressed by how significantly Luxfer blew past analysts’ EBITDA expectations this quarter. On the other hand, its revenue missed. Looking ahead, full-year EBITDA guidance missed, but full-year EPS guidance was in line. Overall, this was a mixed quarter. The stock remained flat at $15.55 immediately after reporting.
13. Is Now The Time To Buy Luxfer?
Updated: March 22, 2026 at 12:14 AM EDT
Before making an investment decision, investors should account for Luxfer’s business fundamentals and valuation in addition to what happened in the latest quarter.
Luxfer falls short of our quality standards. First off, its revenue growth was weak over the last five years, and analysts expect its demand to deteriorate over the next 12 months. While its rising cash profitability gives it more optionality, the downside is its projected EPS for the next year is lacking. On top of that, its weak EPS growth over the last five years shows it’s failed to produce meaningful profits for shareholders.
Luxfer’s P/E ratio based on the next 12 months is 10.6x. This valuation multiple is fair, but we don’t have much confidence in the company. There are better investments elsewhere.
Wall Street analysts have a consensus one-year price target of $17 on the company (compared to the current share price of $11.53).
Although the price target is bullish, readers should exercise caution because analysts tend to be overly optimistic. The firms they work for, often big banks, have relationships with companies that extend into fundraising, M&A advisory, and other rewarding business lines. As a result, they typically hesitate to say bad things for fear they will lose out. We at StockStory do not suffer from such conflicts of interest, so we’ll always tell it like it is.