
Masco (MAS)
We wouldn’t buy Masco. Its poor sales growth and falling returns on capital suggest its growth opportunities are shrinking.― StockStory Analyst Team
1. News
2. Summary
Why We Think Masco Will Underperform
Headquartered just outside of Detroit, MI, Masco (NYSE:MAS) designs and manufactures home-building products such as glass shower doors, decorative lighting, bathtubs, and faucets.
- Customers postponed purchases of its products and services this cycle as its revenue declined by 2.6% annually over the last two years
- Absence of organic revenue growth over the past two years suggests it may have to lean into acquisitions to drive its expansion
- Estimated sales growth of 2% for the next 12 months is soft and implies weaker demand


Masco lacks the business quality we seek. Better stocks can be found in the market.
Why There Are Better Opportunities Than Masco


Masco’s stock price of $70.68 implies a valuation ratio of 17.8x forward P/E. Masco’s multiple may seem like a great deal among industrials peers, but we think there are valid reasons why it’s this cheap.
Cheap stocks can look like a great deal at first glance, but they can be value traps. They often have less earnings power, meaning there is more reliance on a re-rating to generate good returns - an unlikely scenario for low-quality companies.
3. Masco (MAS) Research Report: Q4 CY2025 Update
Home-building design and manufacturing company Masco Corporation (NYSE:MAS) missed Wall Street’s revenue expectations in Q4 CY2025, with sales falling 1.9% year on year to $1.79 billion. Its non-GAAP profit of $0.82 per share was 3.2% above analysts’ consensus estimates.
Masco (MAS) Q4 CY2025 Highlights:
- Revenue: $1.79 billion vs analyst estimates of $1.82 billion (1.9% year-on-year decline, 1.5% miss)
- Adjusted EPS: $0.82 vs analyst estimates of $0.79 (3.2% beat)
- Adjusted EBITDA: $298 million vs analyst estimates of $294.8 million (16.6% margin, 1.1% beat)
- Adjusted EPS guidance for the upcoming financial year 2026 is $4.20 at the midpoint, in line with analyst estimates
- Operating Margin: 13.8%, down from 15.9% in the same quarter last year
- Free Cash Flow Margin: 20.7%, up from 19.2% in the same quarter last year
- Organic Revenue fell 2% year on year (miss)
- Market Capitalization: $14.87 billion
Company Overview
Headquartered just outside of Detroit, MI, Masco (NYSE:MAS) designs and manufactures home-building products such as glass shower doors, decorative lighting, bathtubs, and faucets.
The company offers customers the products they need to build a home from scratch or the products they need to renovate their already existing homes. It is most known for providing products for the residential sector, although recently its subsidiaries and product lines have expanded to include commercial and industrial sectors. The company’s portfolio includes over 20 brands and has an international presence, most notably in Europe.
Masco segments its products into 2 categories: decorative architectural products like glass shower doors, decorative light fixtures, and aesthetic closet and cabinet space; and plumbing products, like faucets, showerheads, and toilets. The company does not offer any installation services or any other kind of significant service.
The company revenue breakdown is evenly split between the sales of its decorative architectural products and plumbing products. It sells to both professional contractors and do-it-yourself (DIY) customers, primarily through retail distribution, online sales, and distributor networks to professional contractors. The company does not have a source of recurring revenue as all of its revenue is driven by one-time product sales. Masco only sells its plumbing products in international markets, instead of selling both plumbing and its decorative architectural products.
4. Home Construction Materials
Traditionally, home construction materials companies have built economic moats with expertise in specialized areas, brand recognition, and strong relationships with contractors. More recently, advances to address labor availability and job site productivity have spurred innovation that is driving incremental demand. However, these companies are at the whim of residential construction volumes, which tend to be cyclical and can be impacted heavily by economic factors such as interest rates. Additionally, the costs of raw materials can be driven by a myriad of worldwide factors and greatly influence the profitability of home construction materials companies.
Other companies that compete in Masco’s markets include The Home Depot (NYSE:HD), Lowe’s (NYSE:LOW), and private company American Standard Brands.
5. Revenue Growth
A company’s long-term performance is an indicator of its overall quality. Even a bad business can shine for one or two quarters, but a top-tier one grows for years. Over the last five years, Masco grew its sales at a weak 1% compounded annual growth rate. This was below our standards and is a tough starting point for our analysis.
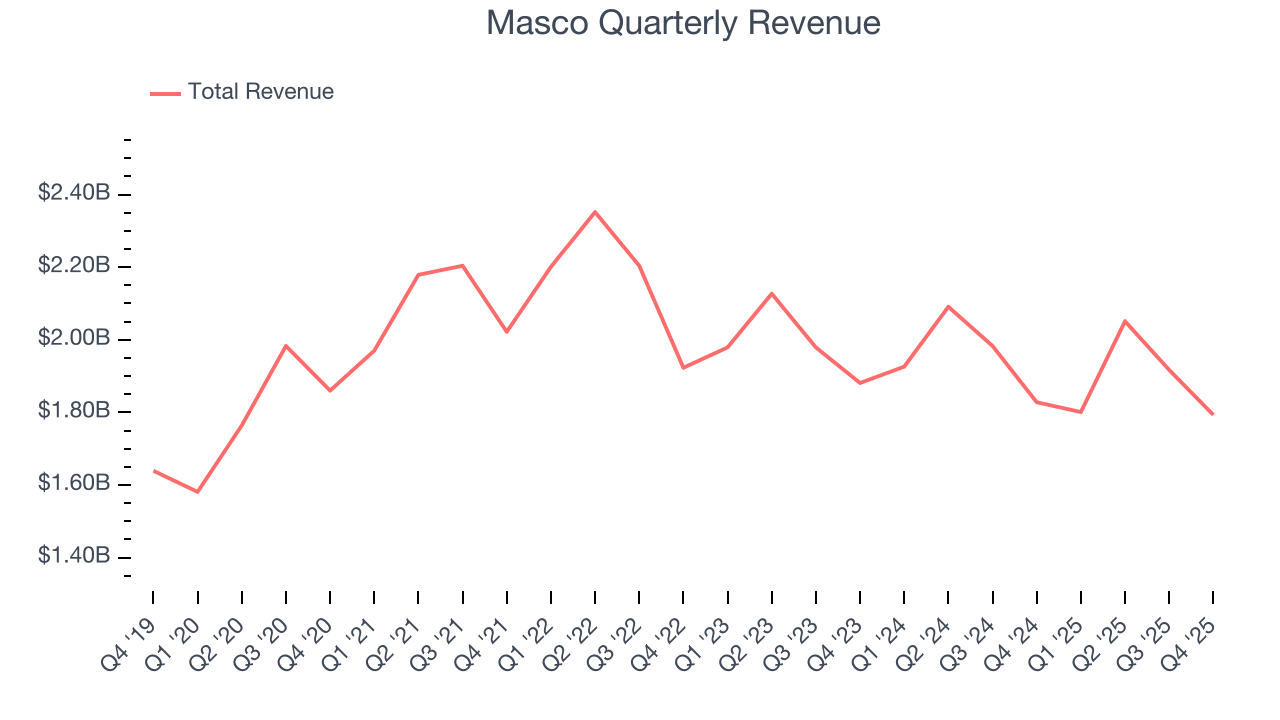
Long-term growth is the most important, but within industrials, a half-decade historical view may miss new industry trends or demand cycles. Masco’s performance shows it grew in the past but relinquished its gains over the last two years, as its revenue fell by 2.6% annually. 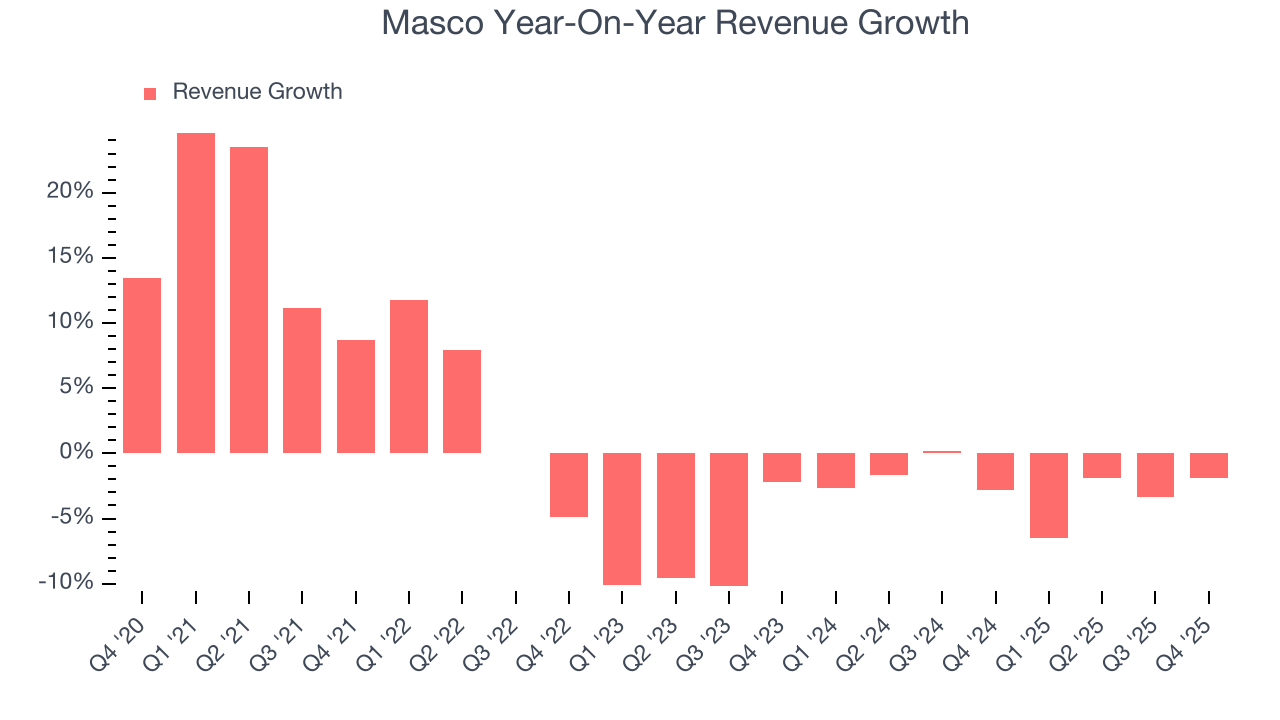
Masco also reports organic revenue, which strips out one-time events like acquisitions and currency fluctuations that don’t accurately reflect its fundamentals. Over the last two years, Masco’s organic revenue averaged 1.5% year-on-year declines. Because this number aligns with its two-year revenue growth, we can see the company’s core operations (not acquisitions and divestitures) drove most of its results. 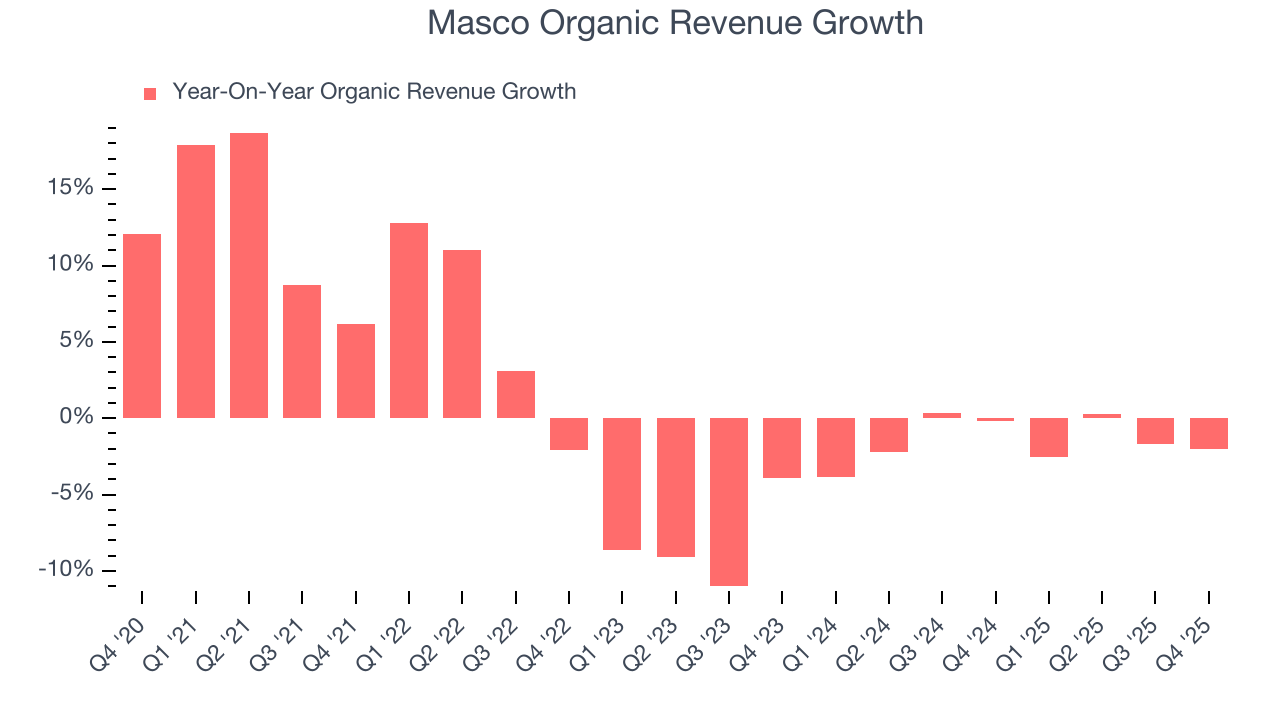
This quarter, Masco missed Wall Street’s estimates and reported a rather uninspiring 1.9% year-on-year revenue decline, generating $1.79 billion of revenue.
Looking ahead, sell-side analysts expect revenue to grow 3.2% over the next 12 months. Although this projection indicates its newer products and services will catalyze better top-line performance, it is still below average for the sector.
6. Gross Margin & Pricing Power
Masco’s gross margin is good compared to other industrials businesses and signals it sells differentiated products, not commodities. As you can see below, it averaged an impressive 34.6% gross margin over the last five years. Said differently, Masco paid its suppliers $65.41 for every $100 in revenue. 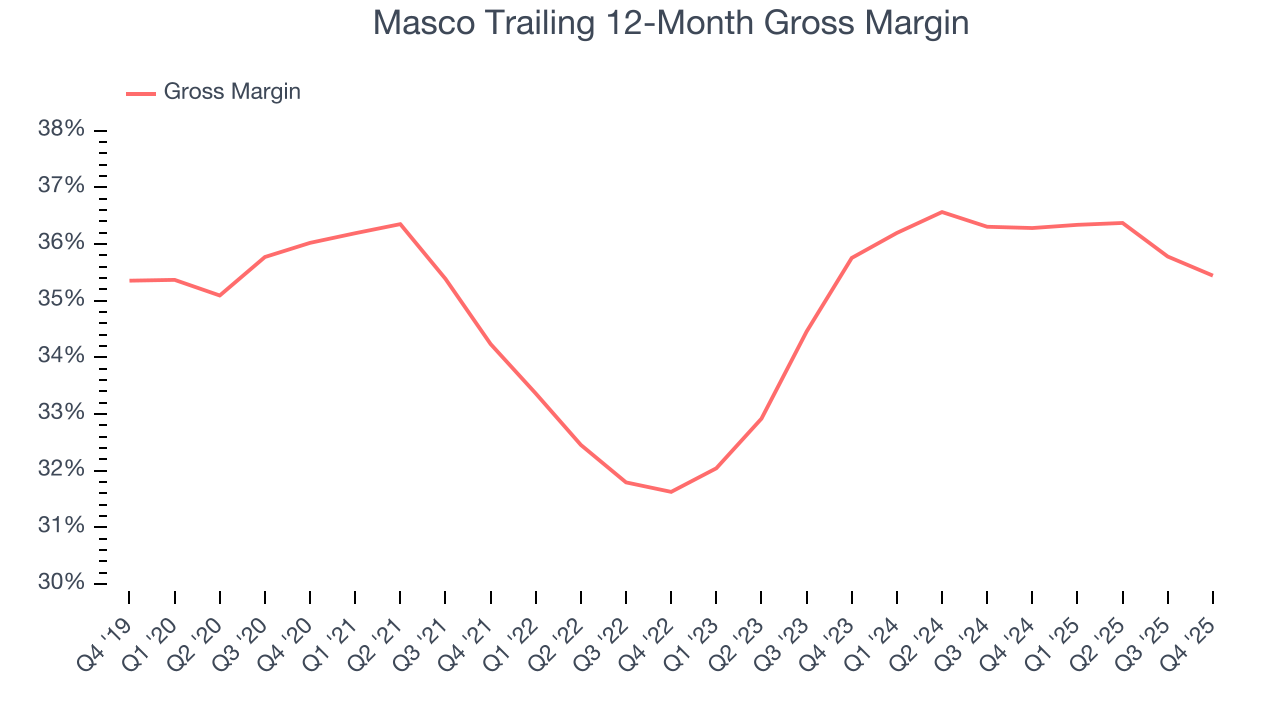
Masco’s gross profit margin came in at 33.9% this quarter, marking a 1.4 percentage point decrease from 35.3% in the same quarter last year. Zooming out, the company’s full-year margin has remained steady over the past 12 months, suggesting its input costs (such as raw materials and manufacturing expenses) have been stable and it isn’t under pressure to lower prices.
7. Operating Margin
Operating margin is one of the best measures of profitability because it tells us how much money a company takes home after procuring and manufacturing its products, marketing and selling those products, and most importantly, keeping them relevant through research and development.
Masco’s operating margin might fluctuated slightly over the last 12 months but has generally stayed the same, averaging 16.5% over the last five years. This profitability was elite for an industrials business thanks to its efficient cost structure and economies of scale. This result isn’t too surprising as its gross margin gives it a favorable starting point.
Analyzing the trend in its profitability, Masco’s operating margin might fluctuated slightly but has generally stayed the same over the last five years. This raises questions about the company’s expense base because its revenue growth should have given it leverage on its fixed costs, resulting in better economies of scale and profitability.
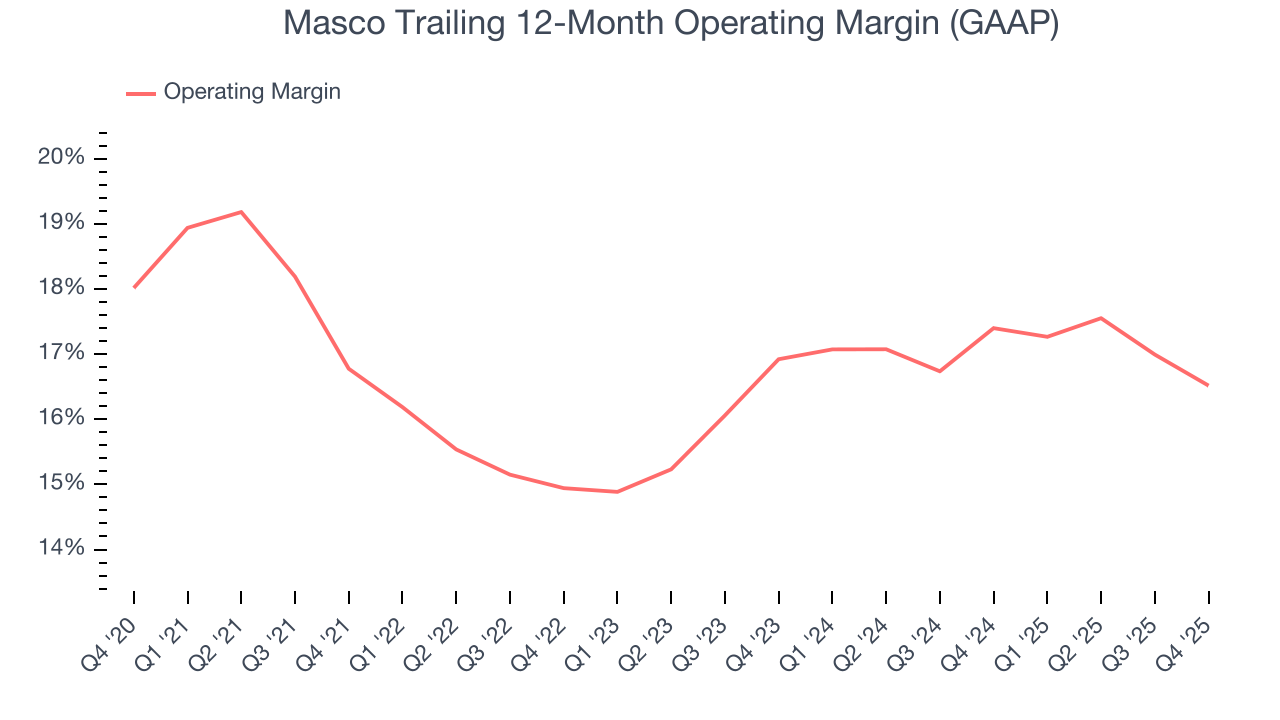
In Q4, Masco generated an operating margin profit margin of 13.8%, down 2 percentage points year on year. Since Masco’s operating margin decreased more than its gross margin, we can assume it was less efficient because expenses such as marketing, R&D, and administrative overhead increased.
8. Earnings Per Share
Revenue trends explain a company’s historical growth, but the long-term change in earnings per share (EPS) points to the profitability of that growth – for example, a company could inflate its sales through excessive spending on advertising and promotions.
Masco’s EPS grew at an unimpressive 5.1% compounded annual growth rate over the last five years. This performance was better than its flat revenue but doesn’t tell us much about its business quality because its operating margin didn’t improve.
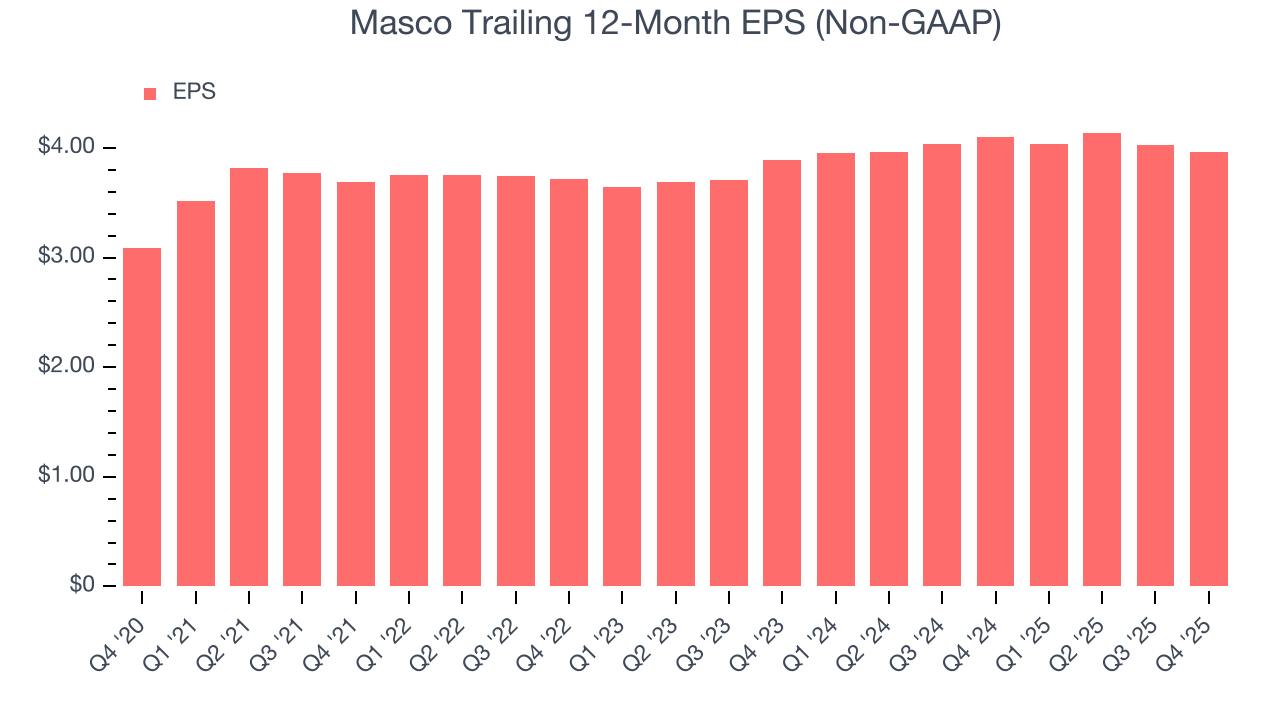
Diving into the nuances of Masco’s earnings can give us a better understanding of its performance. A five-year view shows that Masco has repurchased its stock, shrinking its share count by 54.9%. This tells us its EPS outperformed its revenue not because of increased operational efficiency but financial engineering, as buybacks boost per share earnings. 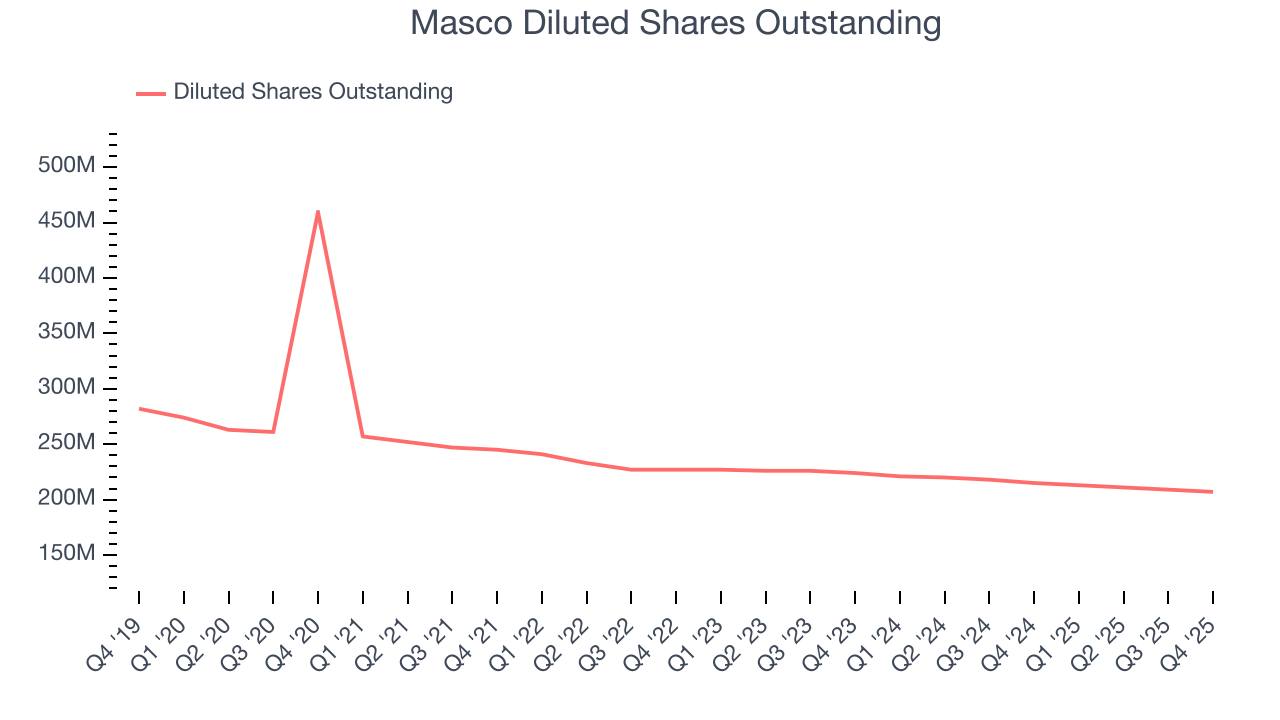
Like with revenue, we analyze EPS over a shorter period to see if we are missing a change in the business.
For Masco, EPS didn’t budge over the last two years, a regression from its five-year trend. We hope it can revert to earnings growth in the coming years.
In Q4, Masco reported adjusted EPS of $0.82, down from $0.89 in the same quarter last year. Despite falling year on year, this print beat analysts’ estimates by 3.2%. Over the next 12 months, Wall Street expects Masco’s full-year EPS of $3.96 to grow 5.7%.
9. Cash Is King
Free cash flow isn't a prominently featured metric in company financials and earnings releases, but we think it's telling because it accounts for all operating and capital expenses, making it tough to manipulate. Cash is king.
Masco has shown robust cash profitability, enabling it to comfortably ride out cyclical downturns while investing in plenty of new offerings and returning capital to investors. The company’s free cash flow margin averaged 10.8% over the last five years, quite impressive for an industrials business.
Taking a step back, we can see that Masco’s margin expanded by 1.9 percentage points during that time. This shows the company is heading in the right direction, and we can see it became a less capital-intensive business because its free cash flow profitability rose while its operating profitability was flat.
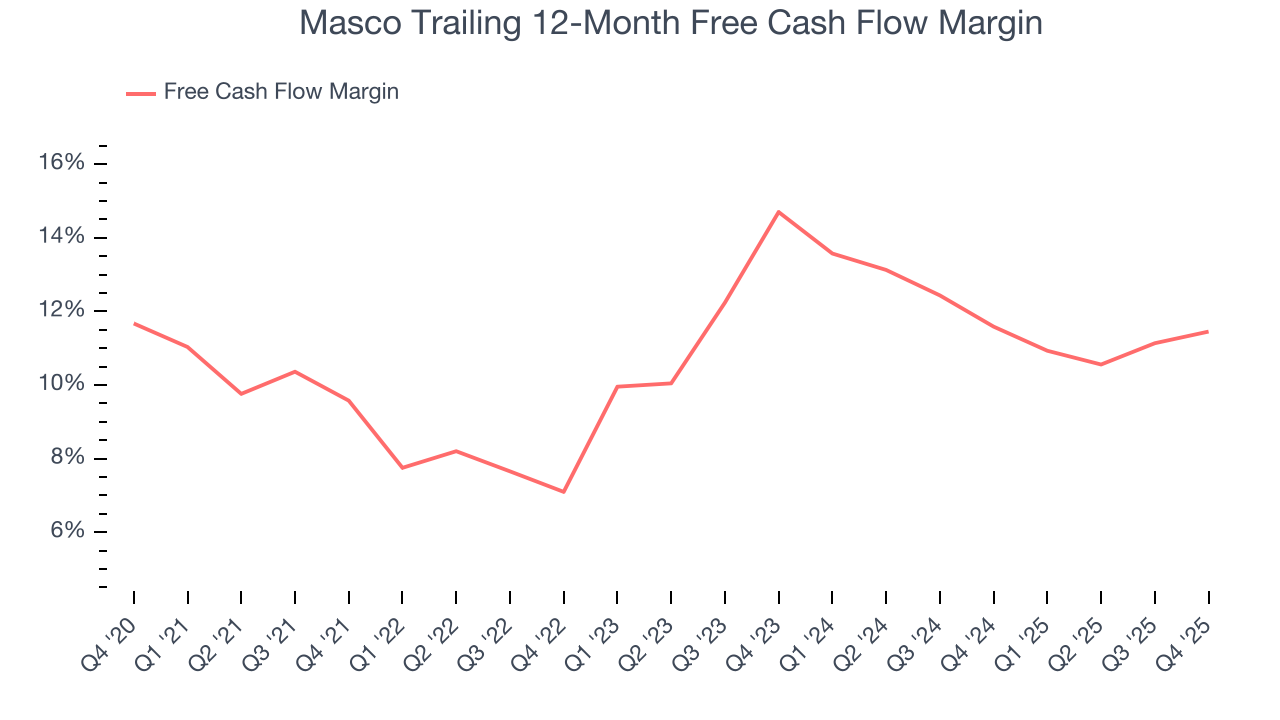
Masco’s free cash flow clocked in at $371 million in Q4, equivalent to a 20.7% margin. This result was good as its margin was 1.5 percentage points higher than in the same quarter last year, building on its favorable historical trend.
10. Return on Invested Capital (ROIC)
EPS and free cash flow tell us whether a company was profitable while growing its revenue. But was it capital-efficient? Enter ROIC, a metric showing how much operating profit a company generates relative to the money it has raised (debt and equity).
Although Masco hasn’t been the highest-quality company lately because of its poor top-line performance, it found a few growth initiatives in the past that worked out wonderfully. Its five-year average ROIC was 45.3%, splendid for an industrials business.
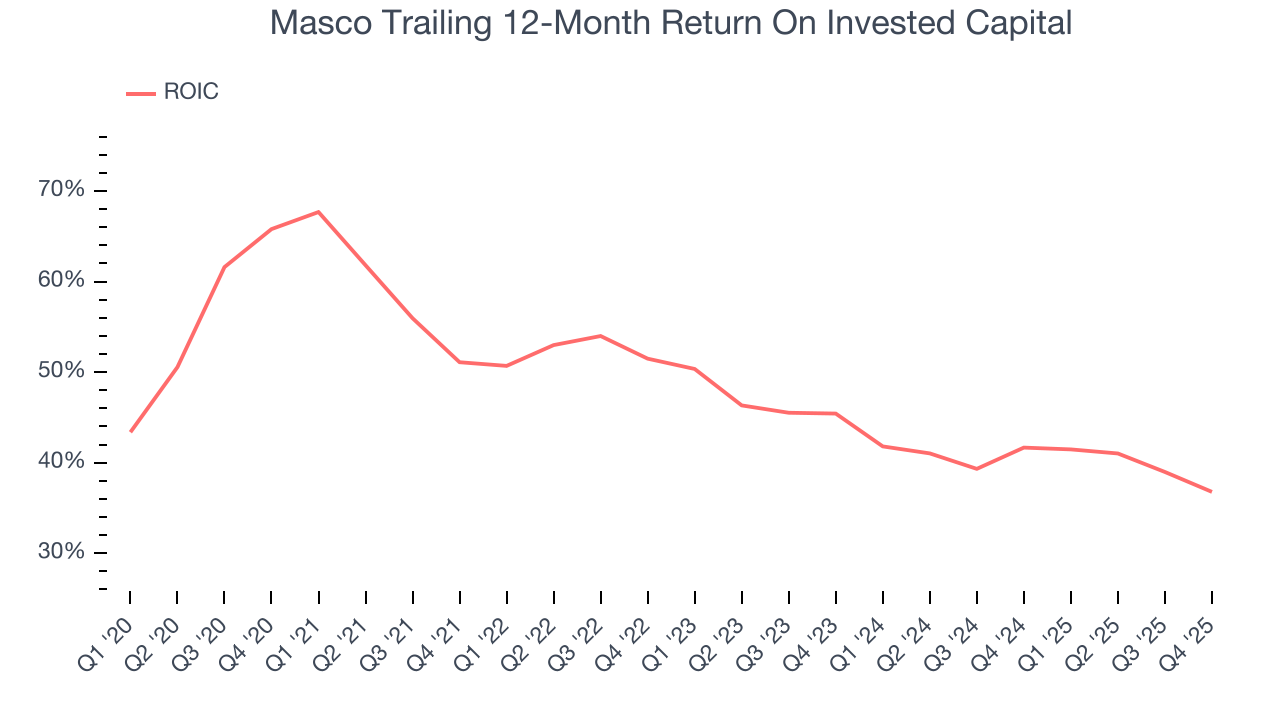
We like to invest in businesses with high returns, but the trend in a company’s ROIC is what often surprises the market and moves the stock price. Unfortunately, Masco’s ROIC has decreased significantly over the last few years. We like what management has done in the past, but its declining returns are perhaps a symptom of fewer profitable growth opportunities.
11. Balance Sheet Assessment
Masco reported $647 million of cash and $3.17 billion of debt on its balance sheet in the most recent quarter. As investors in high-quality companies, we primarily focus on two things: 1) that a company’s debt level isn’t too high and 2) that its interest payments are not excessively burdening the business.
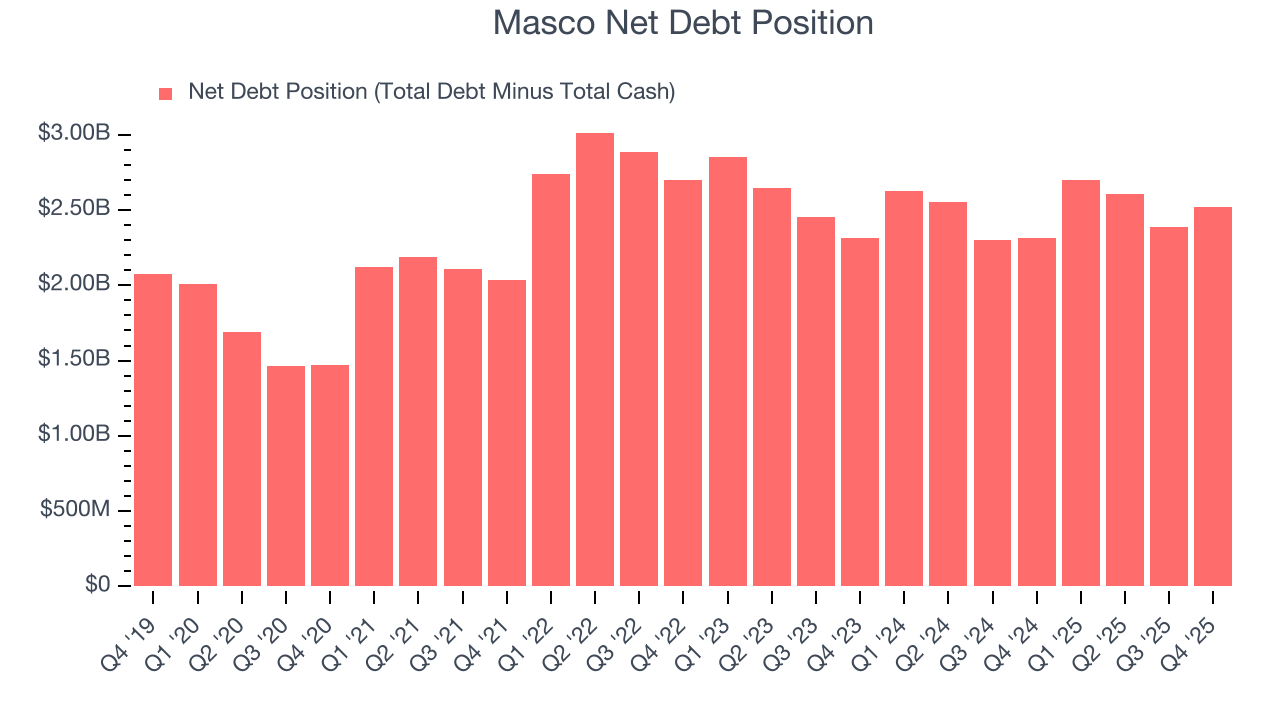
With $1.42 billion of EBITDA over the last 12 months, we view Masco’s 1.8× net-debt-to-EBITDA ratio as safe. We also see its $101 million of annual interest expenses as appropriate. The company’s profits give it plenty of breathing room, allowing it to continue investing in growth initiatives.
12. Key Takeaways from Masco’s Q4 Results
It was good to see Masco narrowly top analysts’ EBITDA expectations this quarter. We were also glad its EPS outperformed Wall Street’s estimates. On the other hand, its revenue slightly missed and its organic revenue fell slightly short of Wall Street’s estimates. Overall, this quarter was mixed. The stock traded up 4.7% to $74.98 immediately after reporting.
13. Is Now The Time To Buy Masco?
Updated: February 10, 2026 at 7:30 AM EST
We think that the latest earnings result is only one piece of the bigger puzzle. If you’re deciding whether to own Masco, you should also grasp the company’s longer-term business quality and valuation.
We cheer for all companies making their customers lives easier, but in the case of Masco, we’ll be cheering from the sidelines. First off, its revenue growth was weak over the last five years. And while its stellar ROIC suggests it has been a well-run company historically, the downside is its diminishing returns show management's prior bets haven't worked out. On top of that, its organic revenue declined.
Masco’s P/E ratio based on the next 12 months is 17.1x. This valuation is reasonable, but the company’s shaky fundamentals present too much downside risk. There are superior stocks to buy right now.
Wall Street analysts have a consensus one-year price target of $74.47 on the company (compared to the current share price of $74.98).