
Mayville Engineering (MEC)
We aren’t fans of Mayville Engineering. Its weak returns on capital suggest it doesn’t generate sufficient profits, a sign of value destruction.― StockStory Analyst Team
1. News
2. Summary
Why We Think Mayville Engineering Will Underperform
Originally founded solely on tool and die manufacturing, Mayville Engineering Company (NYSE:MEC) specializes in metal fabrication, tube bending, and welding to be used in various industries.
- Gross margin of 12.6% reflects its high production costs
- Below-average returns on capital indicate management struggled to find compelling investment opportunities
- A positive is that its earnings per share have outperformed its peers over the last five years, increasing by 21.3% annually


Mayville Engineering is in the doghouse. There are more promising prospects in the market.
Why There Are Better Opportunities Than Mayville Engineering


Mayville Engineering’s stock price of $16.68 implies a valuation ratio of 89.4x forward P/E. We consider this valuation aggressive considering the business fundamentals.
We prefer to invest in similarly-priced but higher-quality companies with superior earnings growth.
3. Mayville Engineering (MEC) Research Report: Q4 CY2025 Update
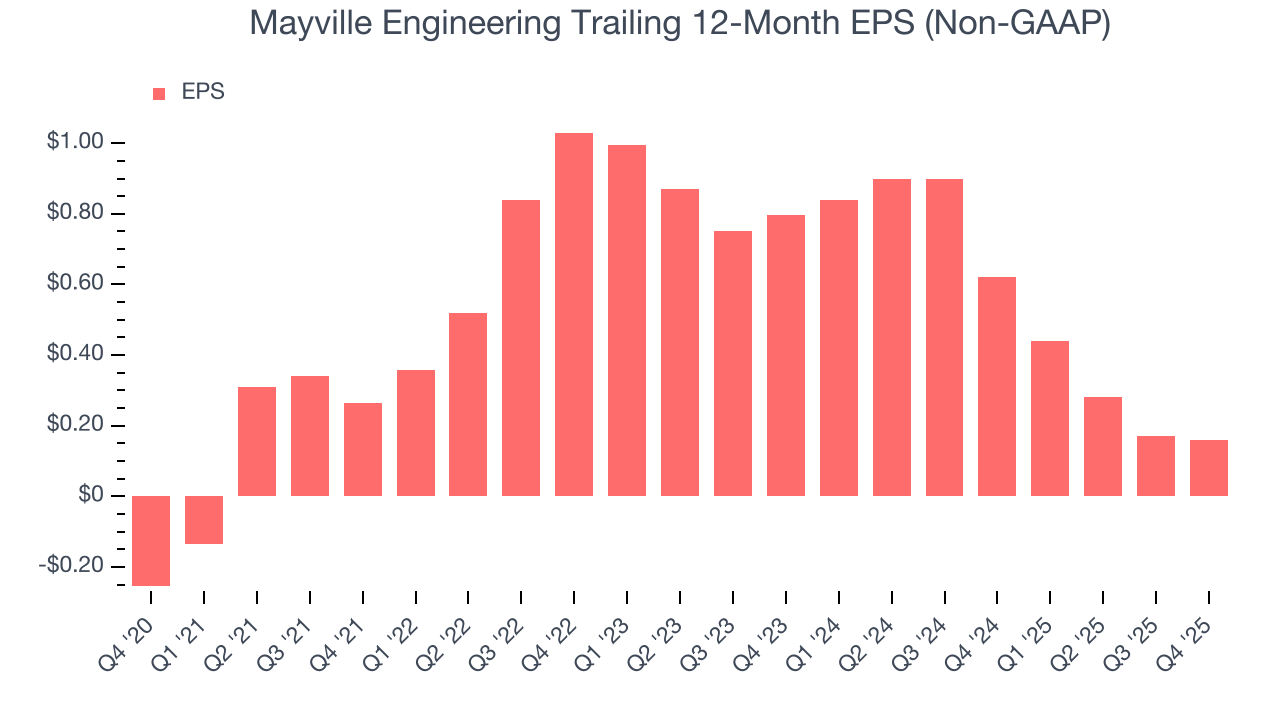
Vertically integrated manufacturing solutions provider Mayville Engineering Company (NYSE:MEC) met Wall Street’s revenue expectations in Q4 CY2025, with sales up 10.7% year on year to $134.3 million. On the other hand, next quarter’s revenue guidance of $140 million was less impressive, coming in 2.5% below analysts’ estimates. Its non-GAAP loss of $0.08 per share was in line with analysts’ consensus estimates.
Mayville Engineering (MEC) Q4 CY2025 Highlights:
- Revenue: $134.3 million vs analyst estimates of $134.1 million (10.7% year-on-year growth, in line)
- Adjusted EPS: -$0.08 vs analyst estimates of -$0.07 (in line)
- Adjusted EBITDA: $6.31 million vs analyst estimates of $11.1 million (4.7% margin, 43.1% miss)
- Revenue Guidance for Q1 CY2026 is $140 million at the midpoint, below analyst estimates of $143.6 million
- EBITDA guidance for the upcoming financial year 2026 is $55 million at the midpoint, below analyst estimates of $66.57 million
- Operating Margin: -4.1%, down from 19% in the same quarter last year
- Free Cash Flow Margin: 7.6%, down from 29.4% in the same quarter last year
- Market Capitalization: $437.7 million
Company Overview
Originally founded solely on tool and die manufacturing, Mayville Engineering Company (NYSE:MEC) specializes in metal fabrication, tube bending, and welding to be used in various industries.
Founded in 1945 and headquartered in Milwaukee, Wisconsin, MEC has established itself as a critical supplier of highly engineered components to original equipment manufacturers (OEMs) across diverse end markets.
MEC's business is providing manufacturing capabilities, including metal fabrication, metal stamping, aluminum extrusion and fabrication, tube bending and forming, robotic welding, and custom coatings. The company serves industries such as heavy- and medium-duty commercial vehicles, construction and access equipment, powersports, agriculture, military, and other industrial sectors.
MEC offers a one-source solution with benefits throughout the entire product lifecycle. This includes front-end collaboration in design and prototyping, product manufacturing, and aftermarket components. Additionally, MEC's customer base comprises leading, blue-chip OEM manufacturers across the United States. The company has developed long-standing relationships with many of these customers, some spanning over four decades.
4. Engineered Components and Systems
Engineered components and systems companies possess technical know-how in sometimes narrow areas such as metal forming or intelligent robotics. Lately, automation and connected equipment collecting analyzable data have been trending, creating new demand. On the other hand, like the broader industrials sector, engineered components and systems companies are at the whim of economic cycles. Consumer spending and interest rates, for example, can greatly impact the industrial production that drives demand for these companies’ offerings.
Competitors offering similar products include Belden (NYSE:BDC), IDEX (NYSE:IEX), and Illinois Tool Works (NYSE:ITW).
5. Revenue Growth
A company’s long-term sales performance can indicate its overall quality. Any business can put up a good quarter or two, but the best consistently grow over the long haul. Luckily, Mayville Engineering’s sales grew at a decent 8.9% compounded annual growth rate over the last five years. Its growth was slightly above the average industrials company and shows its offerings resonate with customers.
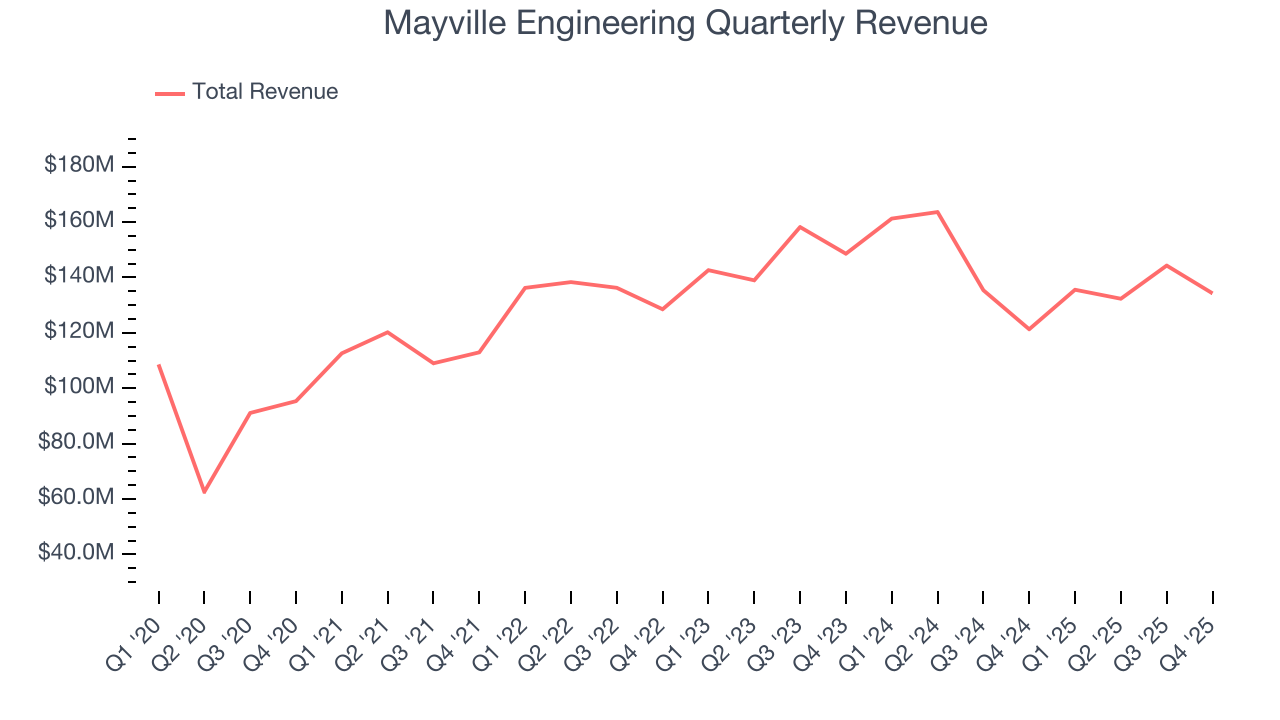
Long-term growth is the most important, but within industrials, a half-decade historical view may miss new industry trends or demand cycles. Mayville Engineering’s recent performance marks a sharp pivot from its five-year trend as its revenue has shown annualized declines of 3.6% over the last two years. 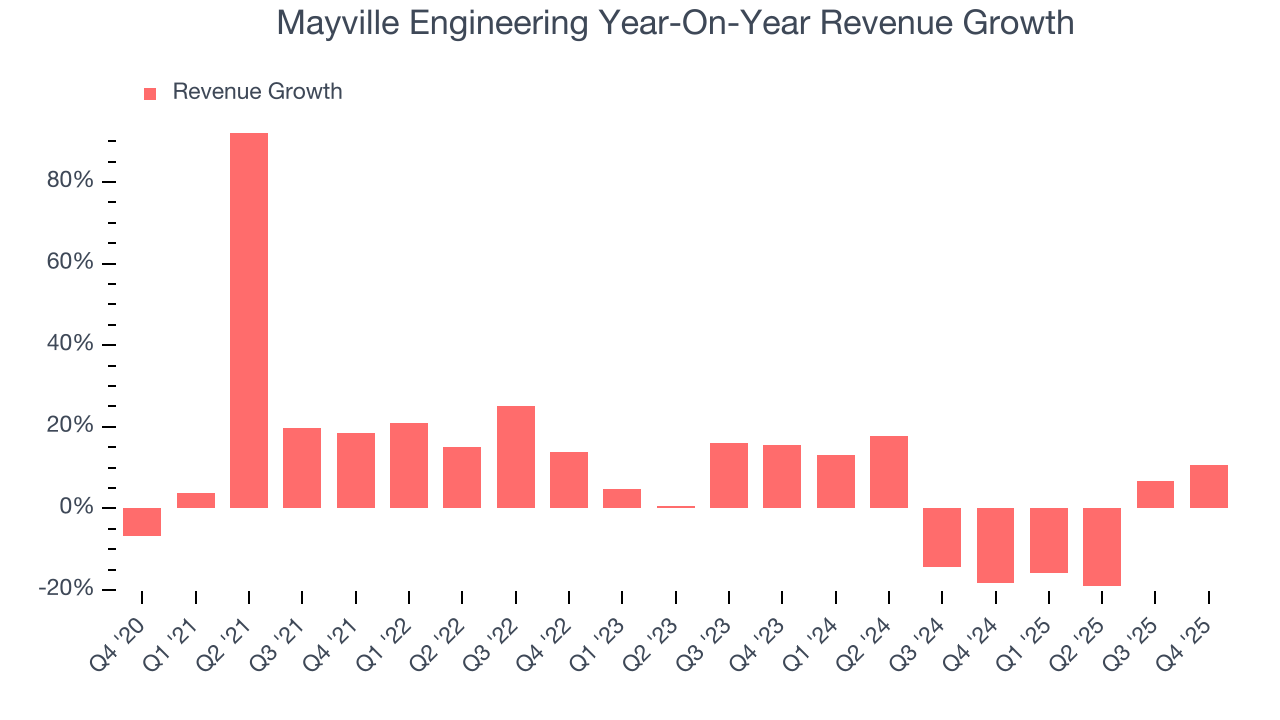
We can dig further into the company’s revenue dynamics by analyzing its most important segments, Commercial Vehicle and Construction & Access, which are 28.6% and 14.3% of revenue. Over the last two years, Mayville Engineering’s Commercial Vehicle revenue (exhaust, engine components, fuel systems) averaged 17.5% year-on-year declines while its Construction & Access revenue (fenders, hoods, frames for heavy machinery) averaged 13.7% declines. 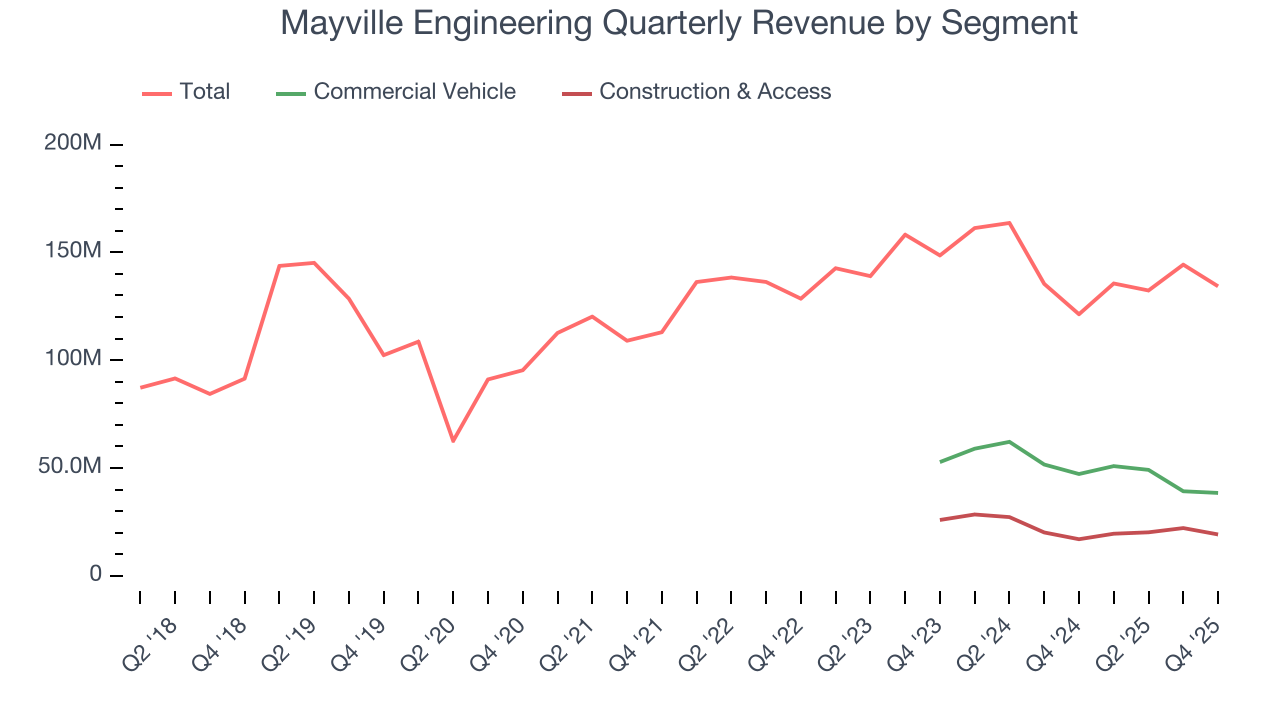
This quarter, Mayville Engineering’s year-on-year revenue growth was 10.7%, and its $134.3 million of revenue was in line with Wall Street’s estimates. Company management is currently guiding for a 3.3% year-on-year increase in sales next quarter.
Looking further ahead, sell-side analysts expect revenue to grow 10.4% over the next 12 months, an improvement versus the last two years. This projection is commendable and suggests its newer products and services will fuel better top-line performance.
6. Gross Margin & Pricing Power
Mayville Engineering has bad unit economics for an industrials business, signaling it operates in a competitive market. As you can see below, it averaged a 12.5% gross margin over the last five years. That means Mayville Engineering paid its suppliers a lot of money ($87.47 for every $100 in revenue) to run its business. 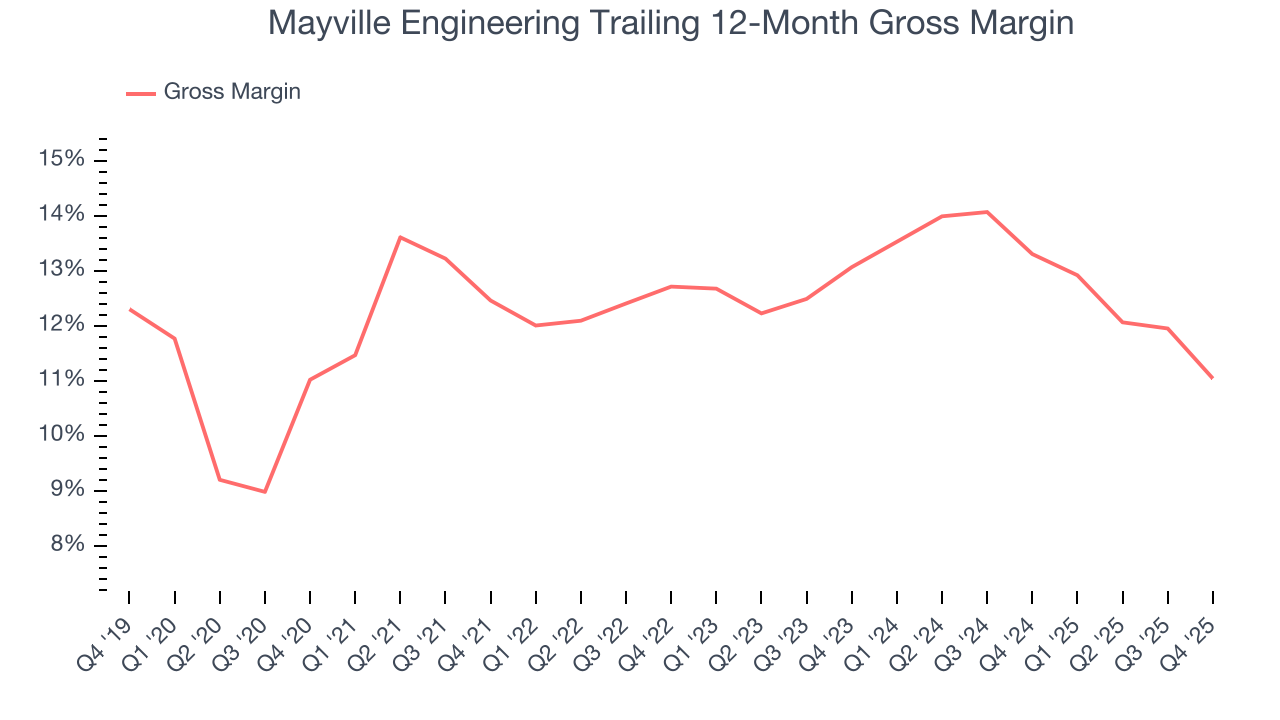
In Q4, Mayville Engineering produced a 6.6% gross profit margin , marking a 3.5 percentage point decrease from 10.2% in the same quarter last year. Mayville Engineering’s full-year margin has also been trending down over the past 12 months, decreasing by 2.3 percentage points. If this move continues, it could suggest a more competitive environment with some pressure to lower prices and higher input costs (such as raw materials and manufacturing expenses).
7. Operating Margin
Mayville Engineering’s operating margin has generally stayed the same over the last 12 months, averaging 2.9% over the last five years. This profitability was lousy for an industrials business and caused by its suboptimal cost structureand low gross margin.
Looking at the trend in its profitability, Mayville Engineering’s operating margin might fluctuated slightly but has generally stayed the same over the last five years. This raises questions about the company’s expense base because its revenue growth should have given it leverage on its fixed costs, resulting in better economies of scale and profitability.
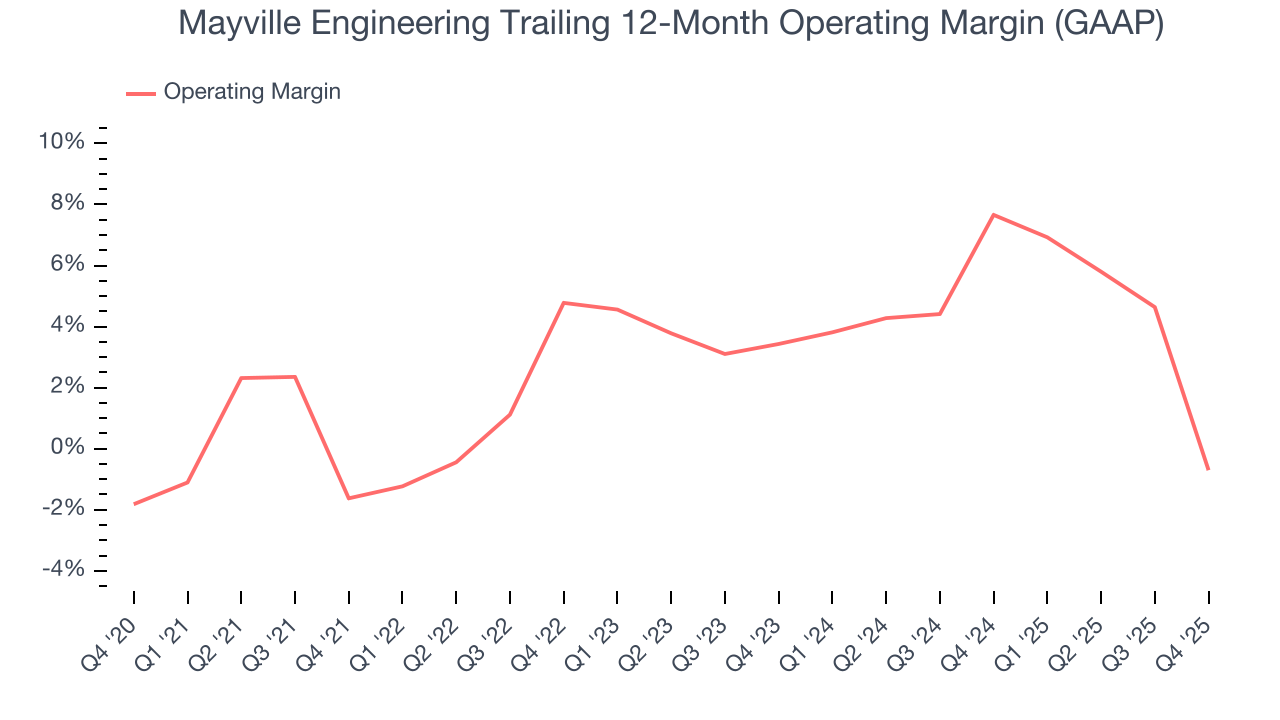
This quarter, Mayville Engineering generated an operating margin profit margin of negative 4.1%, down 23.1 percentage points year on year. Since Mayville Engineering’s operating margin decreased more than its gross margin, we can assume it was less efficient because expenses such as marketing, R&D, and administrative overhead increased.
8. Earnings Per Share
Revenue trends explain a company’s historical growth, but the long-term change in earnings per share (EPS) points to the profitability of that growth – for example, a company could inflate its sales through excessive spending on advertising and promotions.
Mayville Engineering’s full-year EPS flipped from negative to positive over the last five years. This is encouraging and shows it’s at a critical moment in its life.
Like with revenue, we analyze EPS over a more recent period because it can provide insight into an emerging theme or development for the business.
Sadly for Mayville Engineering, its EPS declined by more than its revenue over the last two years, dropping 55.2%. This tells us the company struggled to adjust to shrinking demand.
Diving into the nuances of Mayville Engineering’s earnings can give us a better understanding of its performance. Mayville Engineering’s operating margin has declined over the last two years. This was the most relevant factor (aside from the revenue impact) behind its lower earnings; interest expenses and taxes can also affect EPS but don’t tell us as much about a company’s fundamentals.
In Q4, Mayville Engineering reported adjusted EPS of negative $0.08, down from negative $0.07 in the same quarter last year. This print missed analysts’ estimates, but we care more about long-term adjusted EPS growth than short-term movements. Over the next 12 months, Wall Street expects Mayville Engineering’s full-year EPS of $0.16 to grow 163%.
9. Cash Is King
Although earnings are undoubtedly valuable for assessing company performance, we believe cash is king because you can’t use accounting profits to pay the bills.
Mayville Engineering has shown weak cash profitability relative to peers over the last five years, giving the company fewer opportunities to return capital to shareholders. Its free cash flow margin averaged 3.6%, below what we’d expect for an industrials business.
Taking a step back, an encouraging sign is that Mayville Engineering’s margin expanded by 10.4 percentage points during that time. The company’s improvement shows it’s heading in the right direction, and we can see it became a less capital-intensive business because its free cash flow profitability rose while its operating profitability was flat.
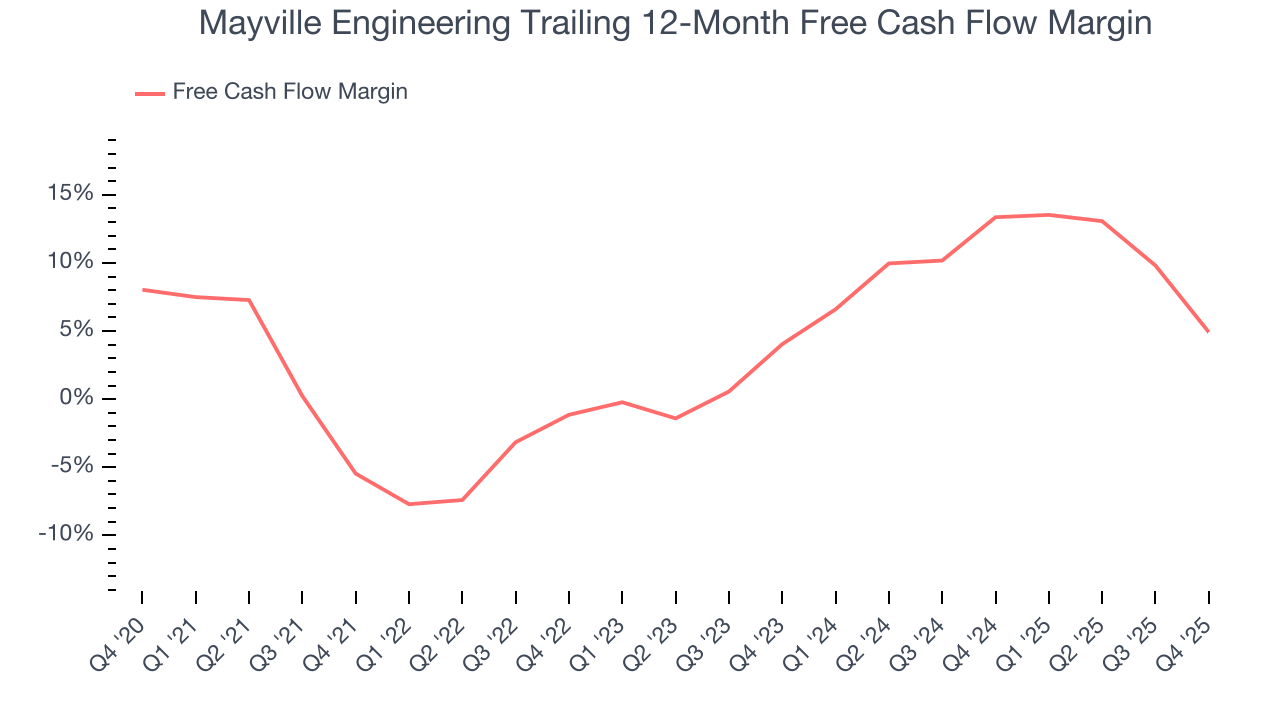
Mayville Engineering’s free cash flow clocked in at $10.16 million in Q4, equivalent to a 7.6% margin. The company’s cash profitability regressed as it was 21.8 percentage points lower than in the same quarter last year, but it’s still above its five-year average. We wouldn’t read too much into this quarter’s decline because capital expenditures can be seasonal and companies often stockpile inventory in anticipation of higher demand, causing short-term swings. Long-term trends trump temporary fluctuations.
10. Return on Invested Capital (ROIC)
EPS and free cash flow tell us whether a company was profitable while growing its revenue. But was it capital-efficient? Enter ROIC, a metric showing how much operating profit a company generates relative to the money it has raised (debt and equity).
Mayville Engineering historically did a mediocre job investing in profitable growth initiatives. Its five-year average ROIC was 4.3%, lower than the typical cost of capital (how much it costs to raise money) for industrials companies.
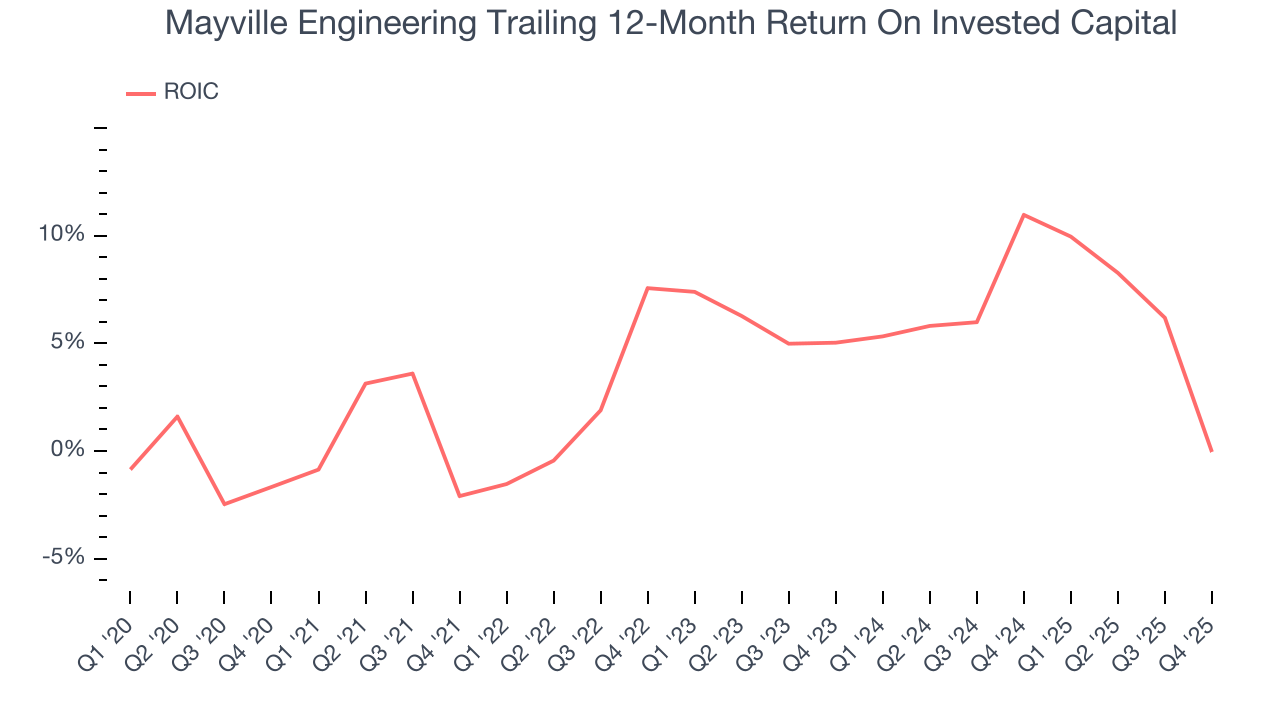
We like to invest in businesses with high returns, but the trend in a company’s ROIC is what often surprises the market and moves the stock price. Over the last few years, Mayville Engineering’s ROIC averaged 2.7 percentage point increases each year. This is a good sign, and we hope the company can continue improving.
11. Balance Sheet Risk
As long-term investors, the risk we care about most is the permanent loss of capital, which can happen when a company goes bankrupt or raises money from a disadvantaged position. This is separate from short-term stock price volatility, something we are much less bothered by.
Mayville Engineering’s $234.8 million of debt exceeds the $1.50 million of cash on its balance sheet. Furthermore, its 5× net-debt-to-EBITDA ratio (based on its EBITDA of $46.23 million over the last 12 months) shows the company is overleveraged.
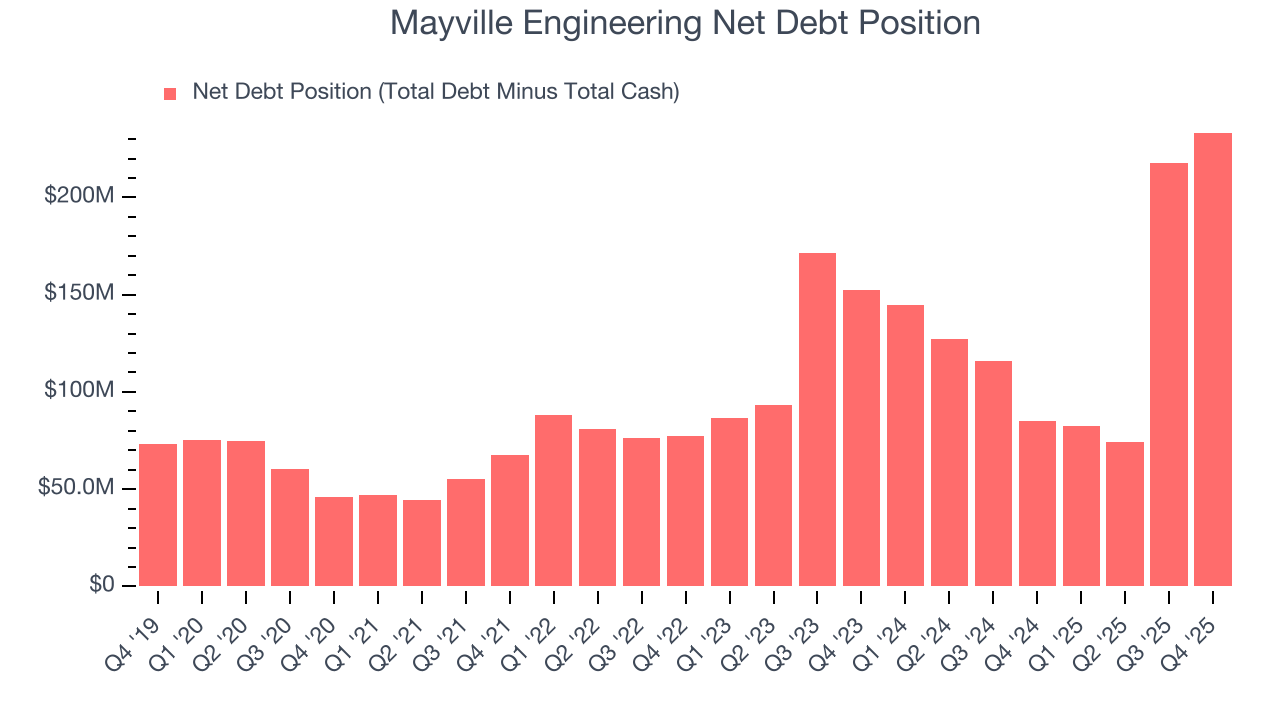
At this level of debt, incremental borrowing becomes increasingly expensive and credit agencies could downgrade the company’s rating if profitability falls. Mayville Engineering could also be backed into a corner if the market turns unexpectedly – a situation we seek to avoid as investors in high-quality companies.
We hope Mayville Engineering can improve its balance sheet and remain cautious until it increases its profitability or pays down its debt.
12. Key Takeaways from Mayville Engineering’s Q4 Results
We struggled to find many positives in these results. Its full-year EBITDA guidance missed and its EBITDA fell short of Wall Street’s estimates. Overall, this quarter could have been better. The stock traded down 2.9% to $20.49 immediately following the results.
13. Is Now The Time To Buy Mayville Engineering?
Updated: March 22, 2026 at 11:31 PM EDT
When considering an investment in Mayville Engineering, investors should account for its valuation and business qualities as well as what’s happened in the latest quarter.
Mayville Engineering isn’t a terrible business, but it isn’t one of our picks. Although its revenue growth was good over the last five years and Wall Street believes it will continue to grow, its relatively low ROIC suggests management has struggled to find compelling investment opportunities. And while the company’s rising cash profitability gives it more optionality, the downside is its low gross margins indicate some combination of competitive pressures and high production costs.
Mayville Engineering’s P/E ratio based on the next 12 months is 89.4x. Beauty is in the eye of the beholder, but our analysis shows the upside isn’t great compared to the potential downside. We're fairly confident there are better investments elsewhere.
Wall Street analysts have a consensus one-year price target of $26.70 on the company (compared to the current share price of $16.68).
Although the price target is bullish, readers should exercise caution because analysts tend to be overly optimistic. The firms they work for, often big banks, have relationships with companies that extend into fundraising, M&A advisory, and other rewarding business lines. As a result, they typically hesitate to say bad things for fear they will lose out. We at StockStory do not suffer from such conflicts of interest, so we’ll always tell it like it is.