
Markel Group (MKL)
Markel Group doesn’t excite us. It’s recently struggled to grow its revenue, a worrying sign for investors seeking high-quality stocks.― StockStory Analyst Team
1. News


2. Summary
Why Markel Group Is Not Exciting
Often referred to as a "mini Berkshire Hathaway" for its three-engine business model of insurance, investments, and wholly-owned businesses, Markel Group (NYSE:MKL) is a specialty insurance company that underwrites complex risks, manages investment portfolios, and owns a diverse collection of operating businesses.
- Demand will likely fall over the next 12 months as Wall Street expects flat revenue
- Estimated book value per share growth of 9.7% for the next 12 months implies profitability will slow from its two-year trend
- A silver lining is that its additional sales over the last five years increased its profitability as the 20.7% annual growth in its earnings per share outpaced its revenue


Markel Group falls short of our expectations. We believe there are better businesses elsewhere.
Why There Are Better Opportunities Than Markel Group


At $2,028 per share, Markel Group trades at 1.4x forward P/B. Yes, this valuation multiple is lower than that of other insurance peers, but we’ll remind you that you often get what you pay for.
Cheap stocks can look like great bargains at first glance, but you often get what you pay for. These mediocre businesses often have less earnings power, meaning there is more reliance on a re-rating to generate good returns - an unlikely scenario for low-quality companies.
3. Markel Group (MKL) Research Report: Q3 CY2025 Update
Specialty insurance company Markel Group (NYSE:MKL) met Wall Street’s revenue expectations in Q3 CY2025, but sales fell by 14.7% year on year to $3.93 billion.
Markel Group (MKL) Q3 CY2025 Highlights:
- Net Premiums Earned: $2.13 billion vs analyst estimates of $2.08 billion (flat year on year, 2.3% beat)
- Revenue: $3.93 billion vs analyst estimates of $3.92 billion (14.7% year-on-year decline, in line)
- Combined Ratio: 93% vs analyst estimates of 95.4% (240 basis point beat)
- Market Capitalization: $23.25 billion
Company Overview
Often referred to as a "mini Berkshire Hathaway" for its three-engine business model of insurance, investments, and wholly-owned businesses, Markel Group (NYSE:MKL) is a specialty insurance company that underwrites complex risks, manages investment portfolios, and owns a diverse collection of operating businesses.
Markel's insurance operations focus on hard-to-place risks that standard insurers typically avoid. The company writes policies across numerous specialty areas including professional liability, marine and energy, property, workers' compensation, and personal lines for unique assets like classic cars and vintage boats. This specialty focus allows Markel to develop expertise in niche markets where competition is less intense and pricing can be more favorable.
The company operates through three complementary business engines. Its insurance engine includes traditional underwriting operations, program services that provide fronting capabilities for other insurers, and insurance-linked securities that manage third-party capital. The investment engine takes insurance premiums and invests them in both fixed income and equity securities. The third engine, Markel Ventures, owns controlling interests in diverse businesses across manufacturing, healthcare, consumer products, and other sectors.
Markel's global footprint includes operations in the United States, Bermuda, London, and throughout Europe. In the U.S., it writes business in both the excess and surplus lines market (for non-standard risks) and the admitted market. A business might turn to Markel when seeking coverage for unusual liability exposures, specialized property risks, or professional services that mainstream insurers won't accommodate.
The company generates revenue through multiple streams: underwriting profits when claims and expenses are less than premiums collected, investment income and gains from its portfolio, management fees from its insurance-linked securities operations, and operating income from its Markel Ventures businesses.
4. Property & Casualty Insurance
Property & Casualty (P&C) insurers protect individuals and businesses against financial loss from damage to property or from legal liability. This is a cyclical industry, and the sector benefits when there is 'hard market', characterized by strong premium rate increases that outpace loss and cost inflation, resulting in robust underwriting margins. The opposite is true in a 'soft market'. Interest rates also matter, as they determine the yields earned on fixed-income portfolios. On the other hand, P&C insurers face a major secular headwind from the increasing frequency and severity of catastrophe losses due to climate change. Furthermore, the liability side of the business is pressured by 'social inflation'—the trend of rising litigation costs and larger jury awards.
Markel's competitors in the specialty insurance market include Chubb Limited (NYSE:CB), W.R. Berkley Corporation (NYSE:WRB), and American Financial Group (NYSE:AFG). In its investment and business ownership model, it competes with diversified insurance operators like Berkshire Hathaway (NYSE:BRK.A, NYSE:BRK.B).
5. Revenue Growth
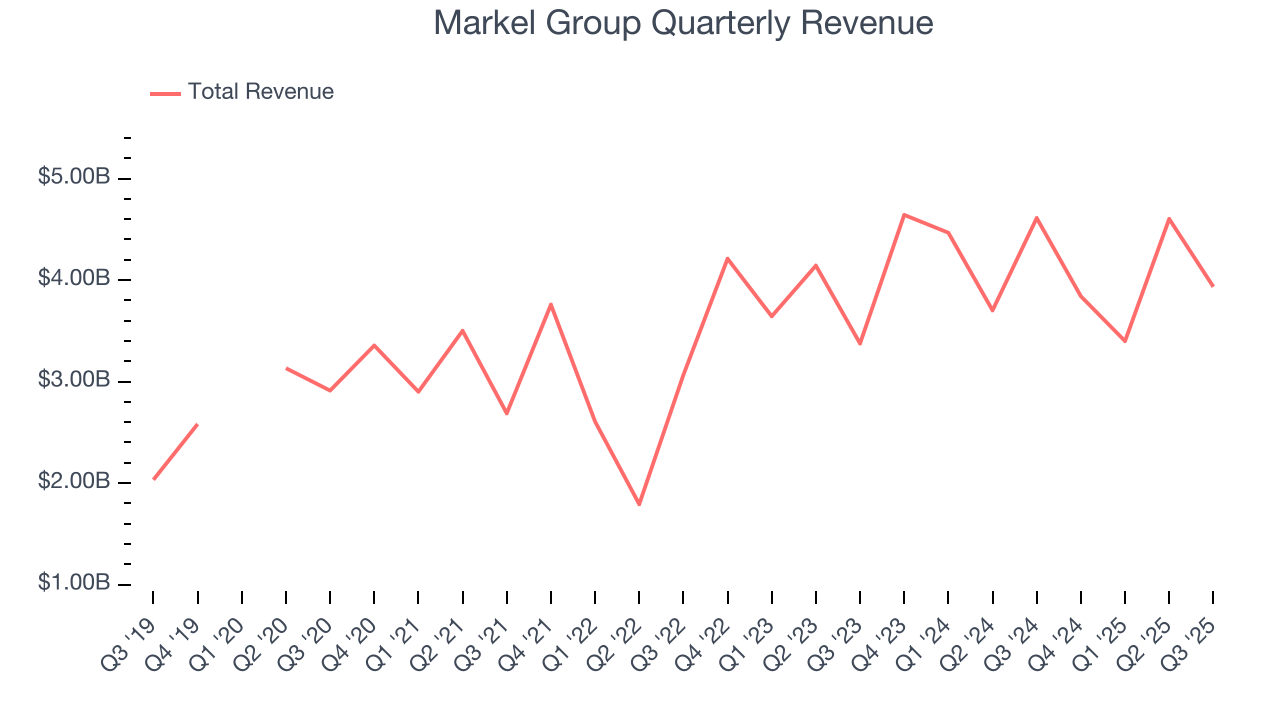
Big picture, insurers generate revenue from three key sources. The first is the core business of underwriting policies. The second source is income from investing the “float” (premiums collected upfront not yet paid out as claims) in assets such as fixed-income assets and equities. The third is fees from various sources such as policy administration, annuities, or other value-added services. Over the last five years, Markel Group grew its revenue at a mediocre 7.5% compounded annual growth rate. This was below our standard for the insurance sector and is a poor baseline for our analysis.
 Note: Quarters not shown were determined to be outliers, impacted by outsized investment gains/losses that are not indicative of the recurring fundamentals of the business.
Long-term growth is the most important, but within financials, a half-decade historical view may miss recent interest rate changes and market returns. Markel Group’s recent performance shows its demand has slowed as its annualized revenue growth of 1.3% over the last two years was below its five-year trend. 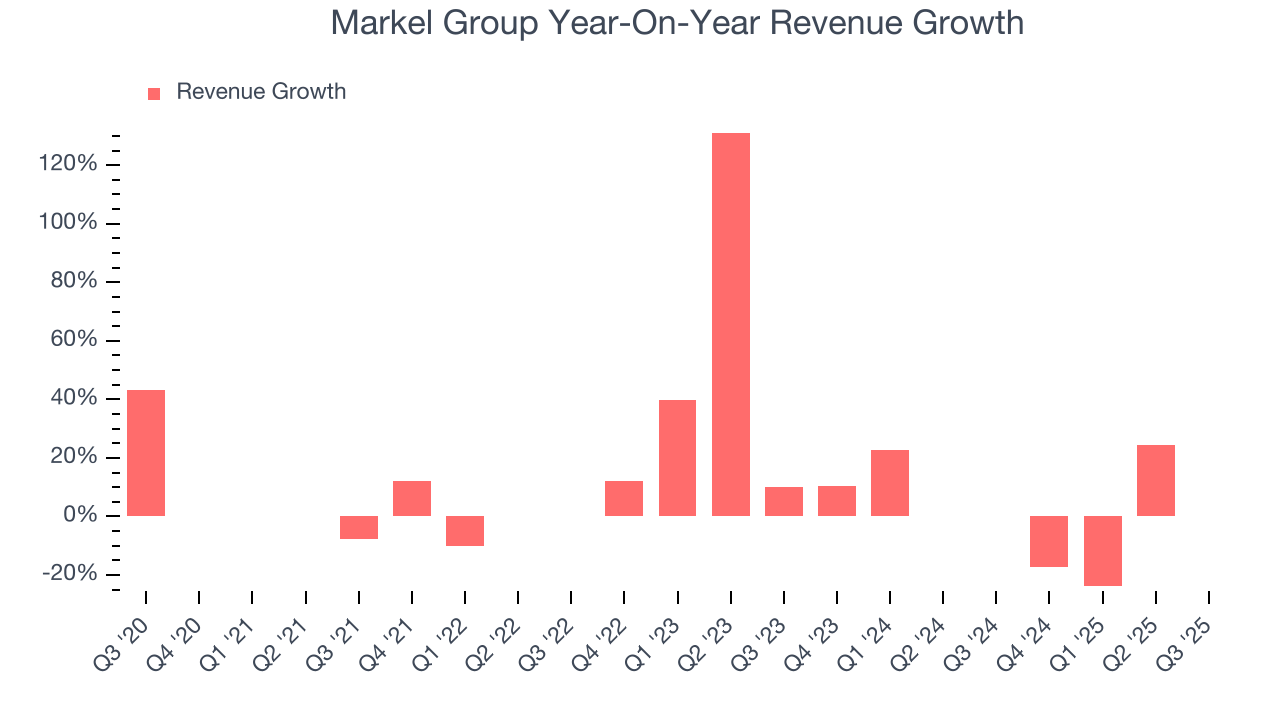 Note: Quarters not shown were determined to be outliers, impacted by outsized investment gains/losses that are not indicative of the recurring fundamentals of the business.
This quarter, Markel Group reported a rather uninspiring 14.7% year-on-year revenue decline to $3.93 billion of revenue, in line with Wall Street’s estimates.
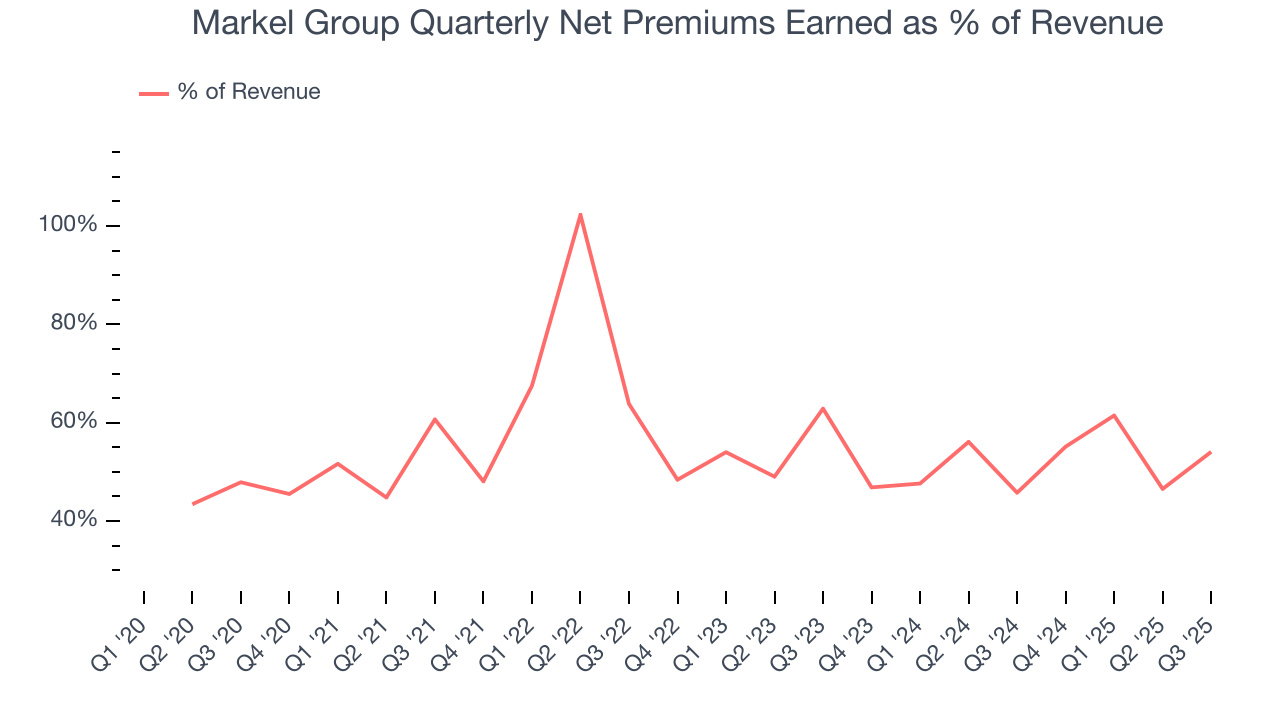
Net premiums earned made up 53.6% of the company’s total revenue during the last five years, meaning Markel Group’s growth drivers strike a balance between insurance and non-insurance activities.
 Note: Quarters not shown were determined to be outliers, impacted by outsized investment gains/losses that are not indicative of the recurring fundamentals of the business.
While insurers generate revenue from multiple sources, investors view net premiums earned as the cornerstone - its direct link to core operations stands in sharp contrast to the unpredictability of investment returns and fees.
6. Net Premiums Earned
When insurers sell policies, they protect themselves from extremely large losses or an outsized accumulation of losses with reinsurance (insurance for insurance companies). Net premiums earned are therefore gross premiums less what’s ceded to reinsurers as a risk mitigation and transfer strategy.
Markel Group’s net premiums earned has grown at a 9.3% annualized rate over the last five years, slightly better than the broader insurance industry and faster than its total revenue.
When analyzing Markel Group’s net premiums earned over the last two years, we can see that growth decelerated to 1.9% annually. This performance was similar to its total revenue.
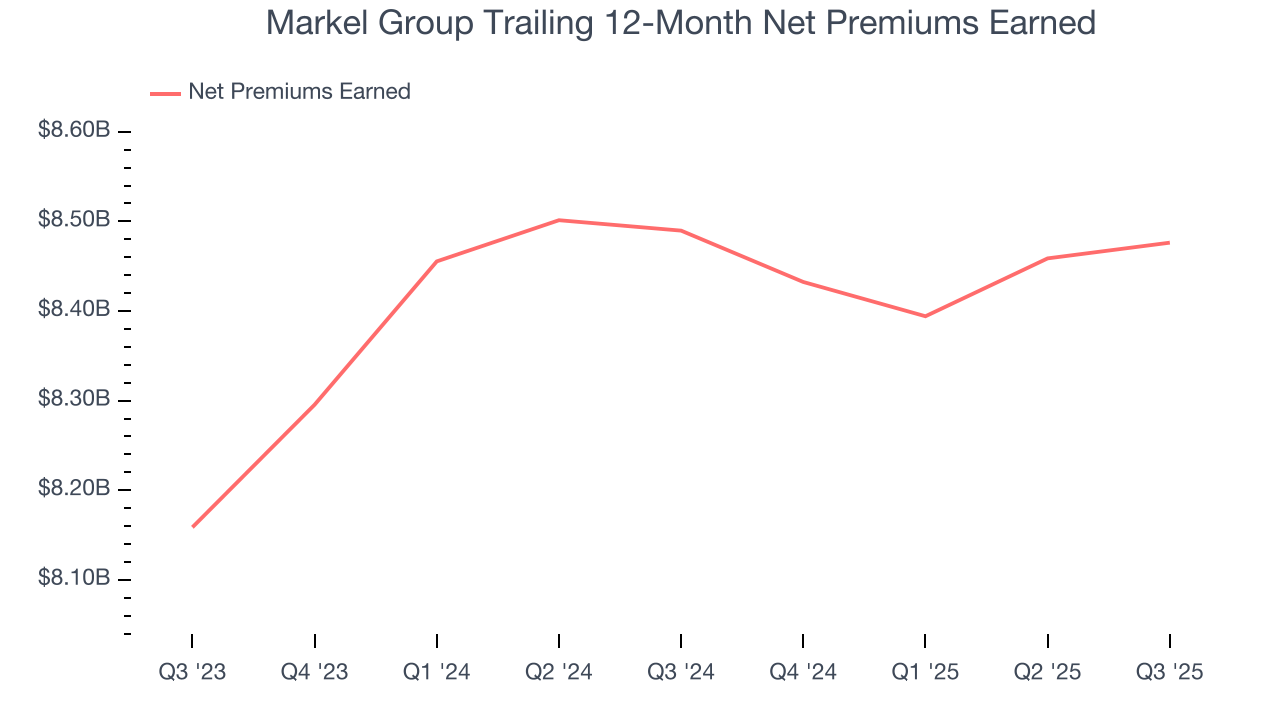
This quarter, Markel Group’s net premiums earned was $2.13 billion, flat year on year. But this was still enough to top Wall Street Consensus estimates by 2.3%.
7. Combined Ratio
Revenue growth is one major determinant of business quality, and the efficiency of operations is another. For insurance companies, we look at the combined ratio rather than the operating expenses and margins that define sectors such as consumer, tech, and industrials.
The combined ratio is:
- The costs of underwriting (salaries, commissions, overhead) + what an insurer pays out in claims, all divided by net premiums earned
If a company boasts a combined ratio under 100%, it is underwriting profitably. If above 100%, it is losing money on its core operations of selling insurance policies.
Given the calculation, a lower expense ratio is better. Over the last five years, Markel Group’s combined ratio has swelled by 6.2 percentage points, going from 91.3% to 95%. However, fixed cost leverage was muted more recently as the company’s combined ratio was flat on a two-year basis.
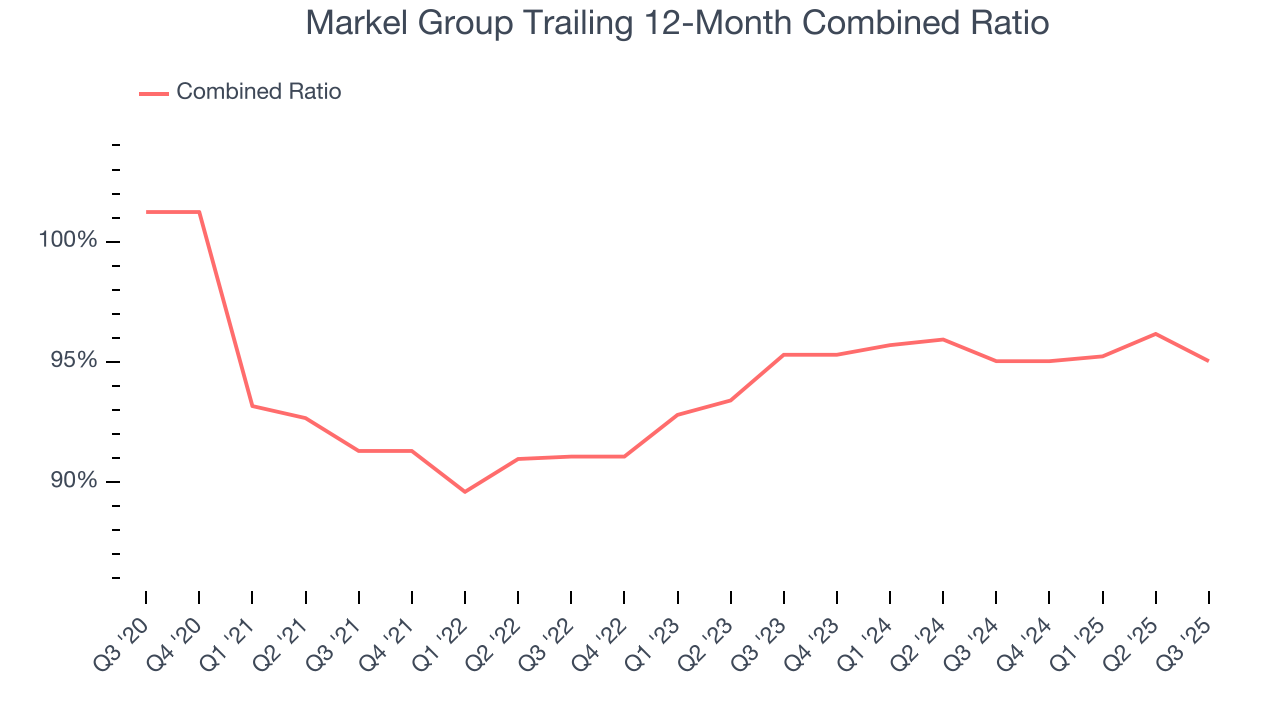
Markel Group’s combined ratio came in at 93% this quarter, beating analysts’ expectations by 240 basis points (100 basis points = 1 percentage point). This result was 3.4 percentage points better than the same quarter last year.
8. Earnings Per Share
Revenue trends explain a company’s historical growth, but the long-term change in earnings per share (EPS) points to the profitability of that growth – for example, a company could inflate its sales through excessive spending on advertising and promotions.
Markel Group’s EPS grew at an astounding 123% compounded annual growth rate over the last five years, higher than its 7.5% annualized revenue growth. However, we take this with a grain of salt because its combined ratio didn’t improve and it didn’t repurchase its shares, meaning the delta came from factors we consider non-core or less sustainable over the long term.
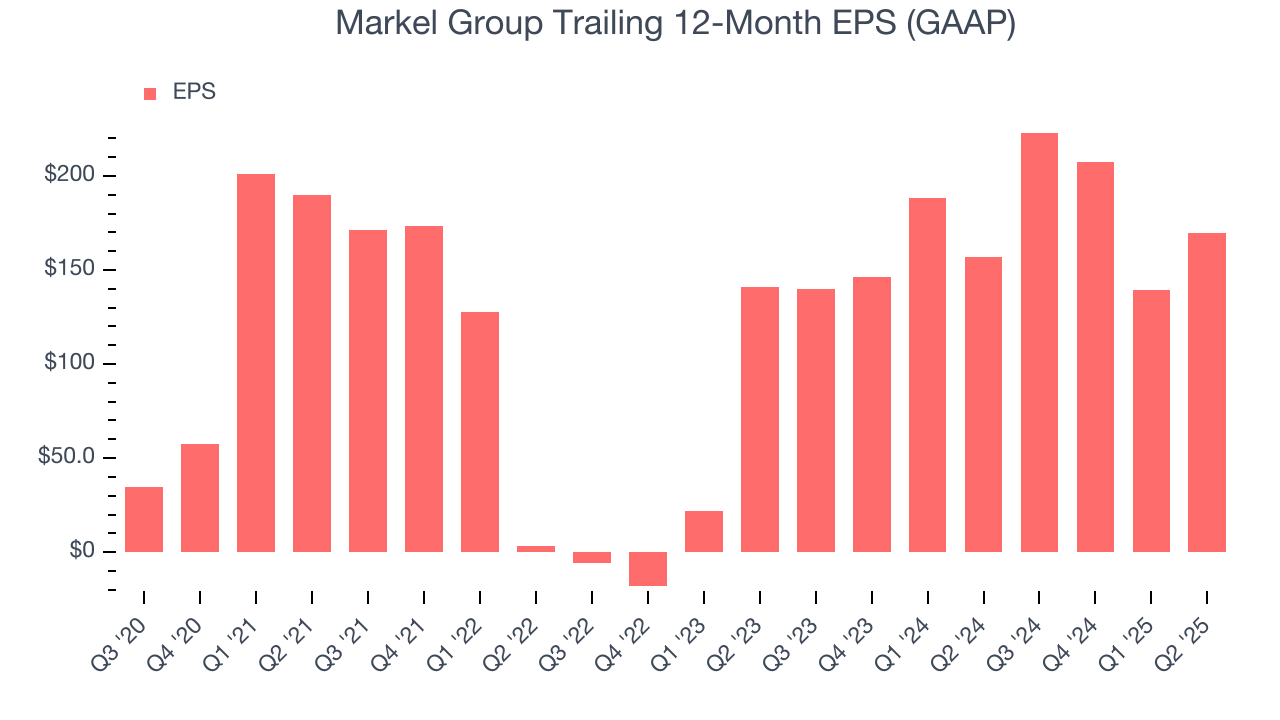
Diving into Markel Group’s quality of earnings can give us a better understanding of its performance. As we mentioned earlier, Markel Group’s combined ratio improved by 6.2 percentage points over the last five years. This was the most relevant factor (aside from the revenue impact) behind its higher earnings; taxes can also affect EPS but don’t tell us as much about a company’s fundamentals.
Like with revenue, we analyze EPS over a more recent period because it can provide insight into an emerging theme or development for the business.
For Markel Group, its two-year annual EPS declines of 14.4% mark a reversal from its (seemingly) healthy five-year trend. We hope Markel Group can return to earnings growth in the future.
9. Book Value Per Share (BVPS)
Insurance companies are balance sheet businesses, collecting premiums upfront and paying out claims over time. The float–premiums collected but not yet paid out–are invested, creating an asset base supported by a liability structure. Book value per share (BVPS) captures this dynamic by measuring these assets (investment portfolio, cash, reinsurance recoverables) less liabilities (claim reserves, debt, future policy benefits). BVPS is essentially the residual value for shareholders.
We therefore consider BVPS very important to track for insurers and a metric that sheds light on business quality. While other (and more commonly known) per-share metrics like EPS can sometimes be lumpy due to reserve releases or one-time items and can be managed or skewed while still following accounting rules, BVPS reflects long-term capital growth and is harder to manipulate.
Markel Group’s BVPS grew at an impressive 11.8% annual clip over the last five years. BVPS growth has also accelerated recently, growing by 18.8% annually over the last two years from $1,013 to $1,431 per share.
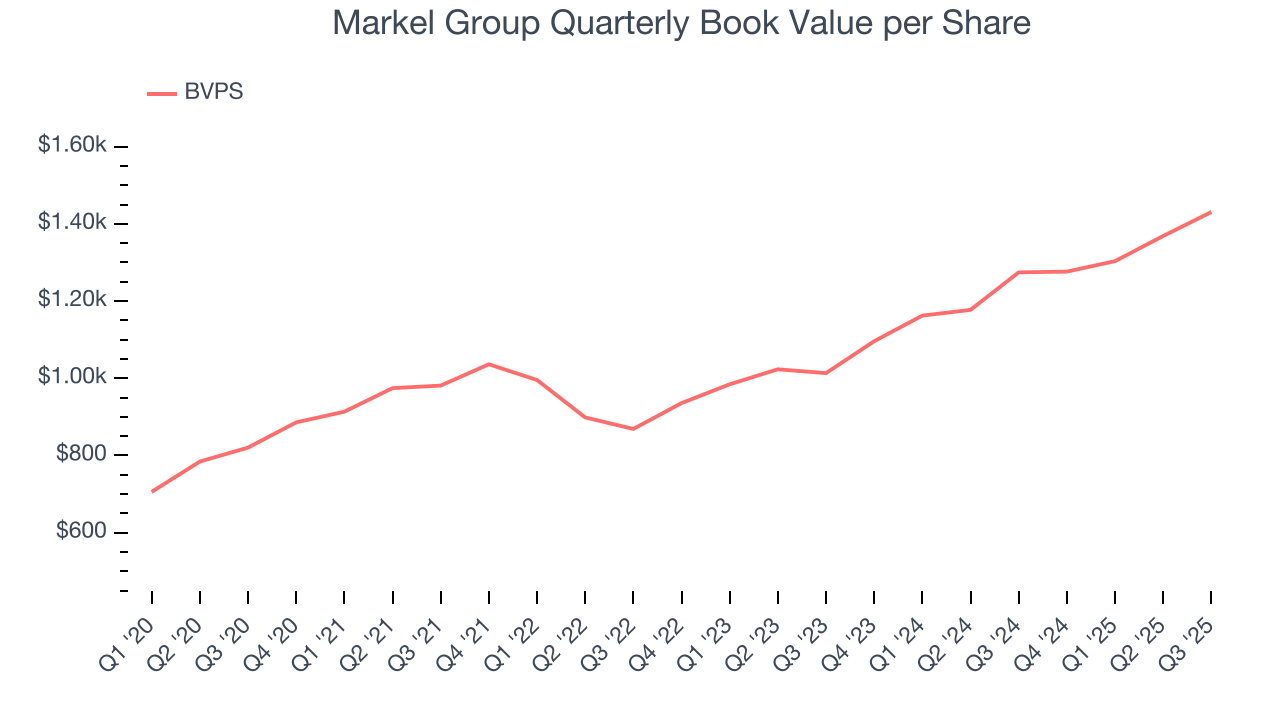
Over the next 12 months, Consensus estimates call for Markel Group’s BVPS to grow by 6.8% to $1,412, paltry growth rate.
10. Balance Sheet Assessment
The debt-to-equity ratio is a widely used measure to assess a company's balance sheet health. A higher ratio means that a business aggressively financed its growth with debt. This can result in higher earnings (if the borrowed funds are invested profitably) but also increases risk.
If debt levels are too high, there could be difficulties in meeting obligations, especially during economic downturns or periods of rising interest rates if the debt has variable-rate payments.
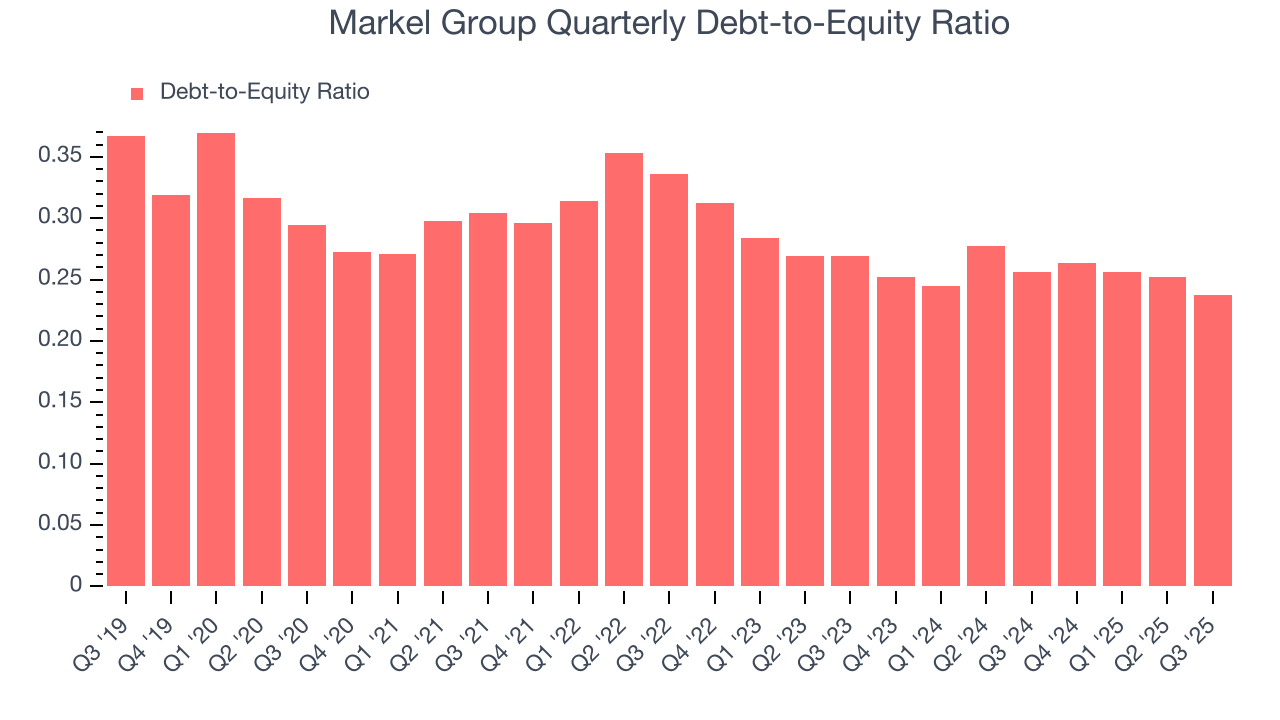
Markel Group currently has $4.28 billion of debt and $18.04 billion of shareholder's equity on its balance sheet, and over the past four quarters, has averaged a debt-to-equity ratio of 0.3×. We think this is safe and raises no red flags. In general, we’re comfortable with any ratio below 1.0× for an insurance business. Anything below 0.5× is a bonus.
11. Return on Equity
Return on equity (ROE) serves as a comprehensive measure of an insurer's performance, showing how efficiently it converts shareholder capital into profits. Strong ROE performance typically translates to better returns for investors through a combination of earnings retention, share repurchases, and dividend distributions.
Over the last five years, Markel Group has averaged an ROE of 12.6%, respectable for a company operating in a sector where the average shakes out around 12.5% and those putting up 20%+ are greatly admired.
12. Key Takeaways from Markel Group’s Q3 Results
We enjoyed seeing Markel Group beat analysts’ net premiums earned expectations this quarter. We were also happy its revenue was in line with Wall Street’s estimates. Overall, we think this was a decent quarter with some key metrics above expectations. The stock traded up 2% to $1,863 immediately after reporting.
13. Is Now The Time To Buy Markel Group?
Updated: January 23, 2026 at 11:34 PM EST
A common mistake we notice when investors are deciding whether to buy a stock or not is that they simply look at the latest earnings results. Business quality and valuation matter more, so we urge you to understand these dynamics as well.
Markel Group isn’t a terrible business, but it doesn’t pass our quality test. Although its revenue growth was impressive over the last five years, it’s expected to deteriorate over the next 12 months and its projected EPS for the next year is lacking.
Markel Group’s P/B ratio based on the next 12 months is 1.4x. Beauty is in the eye of the beholder, but our analysis shows the upside isn’t great compared to the potential downside. We're pretty confident there are more exciting stocks to buy at the moment.
Wall Street analysts have a consensus one-year price target of $2,041 on the company (compared to the current share price of $2,028).