
Markel Group (MKL)
We aren’t fans of Markel Group. Its weak returns on capital indicate management was inefficient with its resources and missed opportunities.― StockStory Analyst Team
1. News
2. Summary
Why Markel Group Is Not Exciting
Often referred to as a "mini Berkshire Hathaway" for its three-engine business model of insurance, investments, and wholly-owned businesses, Markel Group (NYSE:MKL) is a specialty insurance company that underwrites complex risks, manages investment portfolios, and owns a diverse collection of operating businesses.
- Estimated sales decline of 1.1% for the next 12 months implies a challenging demand environment
- Below-average return on equity indicates management struggled to find compelling investment opportunities
- A consolation is that its incremental sales over the last five years have been more profitable as its earnings per share increased by 21.7% annually, topping its revenue gains


Markel Group doesn’t meet our quality standards. There are superior opportunities elsewhere.
Why There Are Better Opportunities Than Markel Group


Markel Group’s stock price of $2,059 implies a valuation ratio of 1.3x forward P/B. This multiple is cheaper than most insurance peers, but we think this is justified.
Our advice is to pay up for elite businesses whose advantages are tailwinds to earnings growth. Don’t get sucked into lower-quality businesses just because they seem like bargains. These mediocre businesses often never achieve a higher multiple as hoped, a phenomenon known as a “value trap”.
3. Markel Group (MKL) Research Report: Q4 CY2025 Update
Specialty insurance company Markel Group (NYSE:MKL) reported Q4 CY2025 results topping the market’s revenue expectations, with sales up 7.6% year on year to $4.01 billion. Its GAAP profit of $48.75 per share was 21.1% above analysts’ consensus estimates.
Markel Group (MKL) Q4 CY2025 Highlights:
- Net Premiums Earned: $2.28 billion vs analyst estimates of $2.17 billion (7.6% year-on-year growth, 5.1% beat)
- Revenue: $4.01 billion vs analyst estimates of $3.87 billion (7.6% year-on-year growth, 3.7% beat)
- Combined Ratio: 92.7% vs analyst estimates of 95.3% (260 basis point beat)
- EPS (GAAP): $48.75 vs analyst estimates of $40.24 (21.1% beat)
- Market Capitalization: $25.71 billion
Company Overview
Often referred to as a "mini Berkshire Hathaway" for its three-engine business model of insurance, investments, and wholly-owned businesses, Markel Group (NYSE:MKL) is a specialty insurance company that underwrites complex risks, manages investment portfolios, and owns a diverse collection of operating businesses.
Markel's insurance operations focus on hard-to-place risks that standard insurers typically avoid. The company writes policies across numerous specialty areas including professional liability, marine and energy, property, workers' compensation, and personal lines for unique assets like classic cars and vintage boats. This specialty focus allows Markel to develop expertise in niche markets where competition is less intense and pricing can be more favorable.
The company operates through three complementary business engines. Its insurance engine includes traditional underwriting operations, program services that provide fronting capabilities for other insurers, and insurance-linked securities that manage third-party capital. The investment engine takes insurance premiums and invests them in both fixed income and equity securities. The third engine, Markel Ventures, owns controlling interests in diverse businesses across manufacturing, healthcare, consumer products, and other sectors.
Markel's global footprint includes operations in the United States, Bermuda, London, and throughout Europe. In the U.S., it writes business in both the excess and surplus lines market (for non-standard risks) and the admitted market. A business might turn to Markel when seeking coverage for unusual liability exposures, specialized property risks, or professional services that mainstream insurers won't accommodate.
The company generates revenue through multiple streams: underwriting profits when claims and expenses are less than premiums collected, investment income and gains from its portfolio, management fees from its insurance-linked securities operations, and operating income from its Markel Ventures businesses.
4. Property & Casualty Insurance
Property & Casualty (P&C) insurers protect individuals and businesses against financial loss from damage to property or from legal liability. This is a cyclical industry, and the sector benefits when there is 'hard market', characterized by strong premium rate increases that outpace loss and cost inflation, resulting in robust underwriting margins. The opposite is true in a 'soft market'. Interest rates also matter, as they determine the yields earned on fixed-income portfolios. On the other hand, P&C insurers face a major secular headwind from the increasing frequency and severity of catastrophe losses due to climate change. Furthermore, the liability side of the business is pressured by 'social inflation'—the trend of rising litigation costs and larger jury awards.
Markel's competitors in the specialty insurance market include Chubb Limited (NYSE:CB), W.R. Berkley Corporation (NYSE:WRB), and American Financial Group (NYSE:AFG). In its investment and business ownership model, it competes with diversified insurance operators like Berkshire Hathaway (NYSE:BRK.A, NYSE:BRK.B).
5. Revenue Growth
Insurance companies generate revenue three ways. The first is the core insurance business itself, represented in the income statement as premiums earned. The second source is investment income from investing the “float” (premiums collected but not yet paid out as claims) in assets such as fixed-income assets and equities. The third is fees from policy administration, annuities, and other value-added services. Luckily, Markel Group’s revenue grew at an impressive 11.2% compounded annual growth rate over the last five years. Its growth beat the average insurance company and shows its offerings resonate with customers.
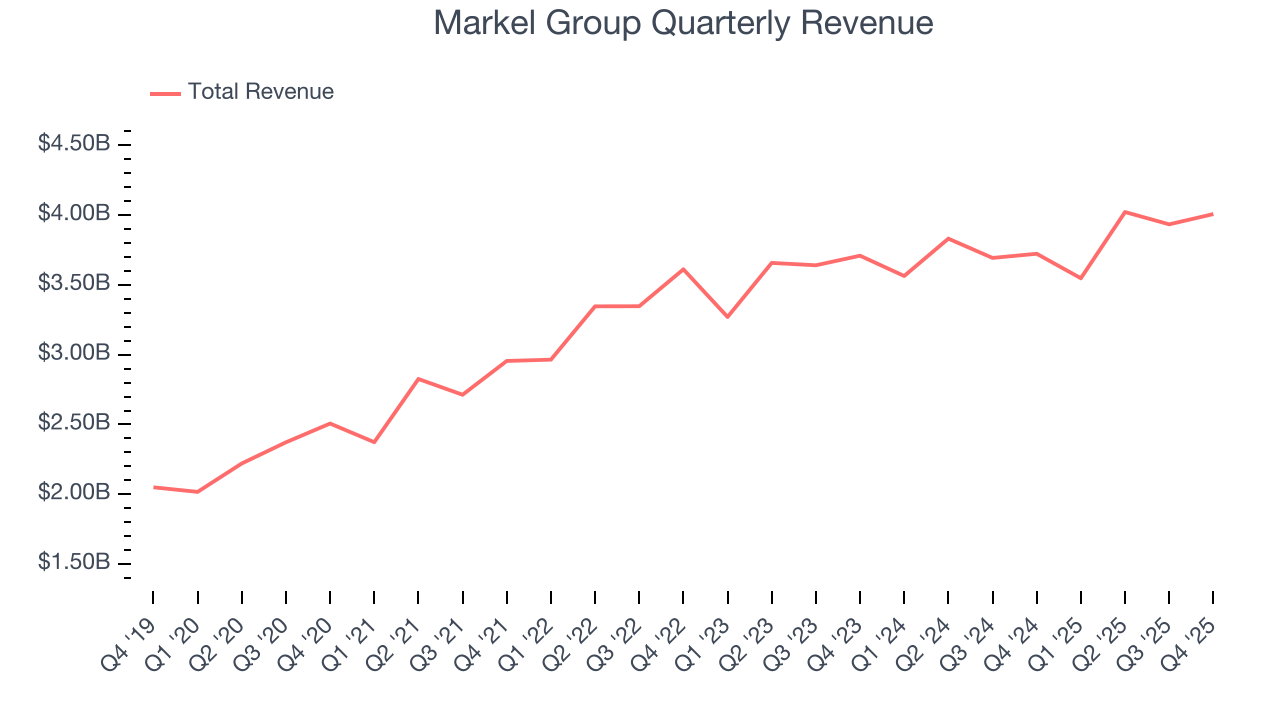
We at StockStory place the most emphasis on long-term growth, but within financials, a half-decade historical view may miss recent interest rate changes, market returns, and industry trends. Markel Group’s recent performance shows its demand has slowed significantly as its annualized revenue growth of 4.2% over the last two years was well below its five-year trend. 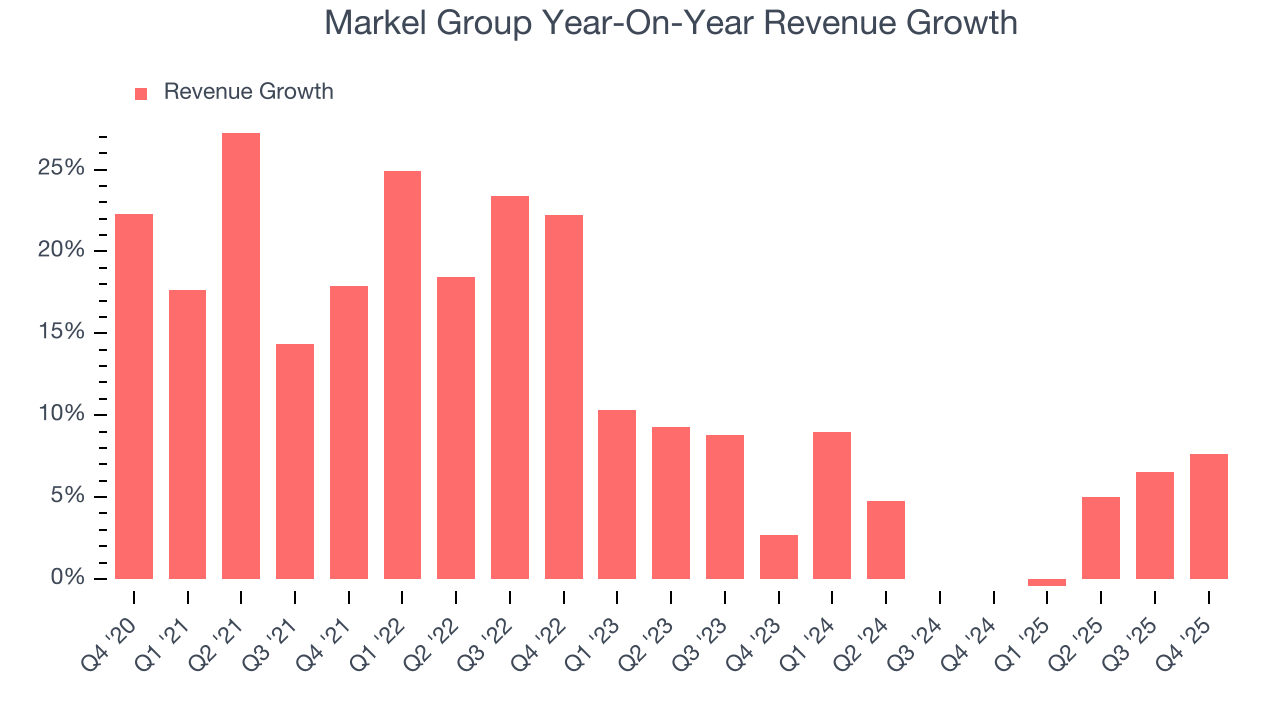 Note: Quarters not shown were determined to be outliers, impacted by outsized investment gains/losses that are not indicative of the recurring fundamentals of the business.
This quarter, Markel Group reported year-on-year revenue growth of 7.6%, and its $4.01 billion of revenue exceeded Wall Street’s estimates by 3.7%.
Net premiums earned made up 57.5% of the company’s total revenue during the last five years, meaning Markel Group’s growth drivers strike a balance between insurance and non-insurance activities.
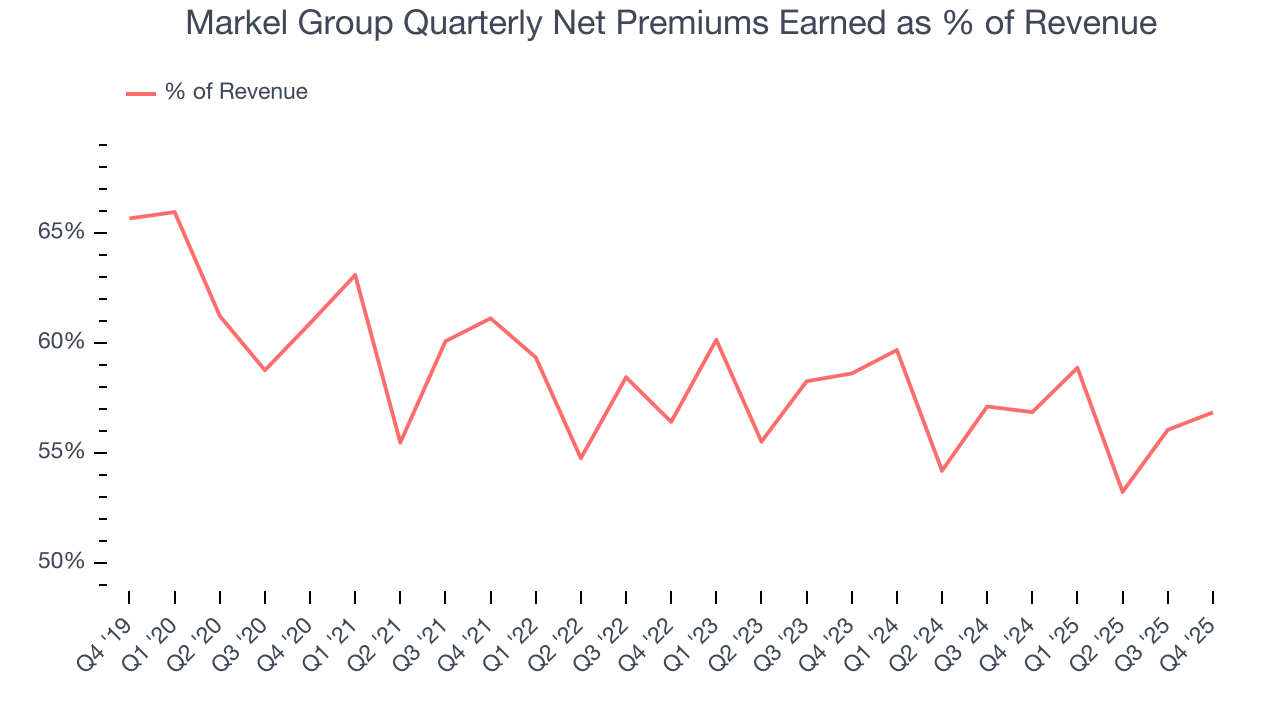
Our experience and research show the market cares primarily about an insurer’s net premiums earned growth as investment and fee income are considered more susceptible to market volatility and economic cycles.
6. Net Premiums Earned
When insurers sell policies, they protect themselves from extremely large losses or an outsized accumulation of losses with reinsurance (insurance for insurance companies). Net premiums earned are:
- Gross premiums - what’s ceded to reinsurers as a risk mitigation and transfer strategy
Markel Group’s net premiums earned has grown at a 9.2% annualized rate over the last five years, slightly better than the broader insurance industry but slower than its total revenue.
When analyzing Markel Group’s net premiums earned over the last two years, we can see that growth decelerated to 2.5% annually. Since two-year net premiums earned grew slower than total revenue over this period, it’s implied that other line items such as investment income grew at a faster rate. While these additional streams certainly contribute to the bottom line, their impact can vary. Some firms have shown greater success and long-term consistency in investing their float compared to peers. However, sharp fluctuations in the fixed income and equity markets can significantly affect short-term performance.
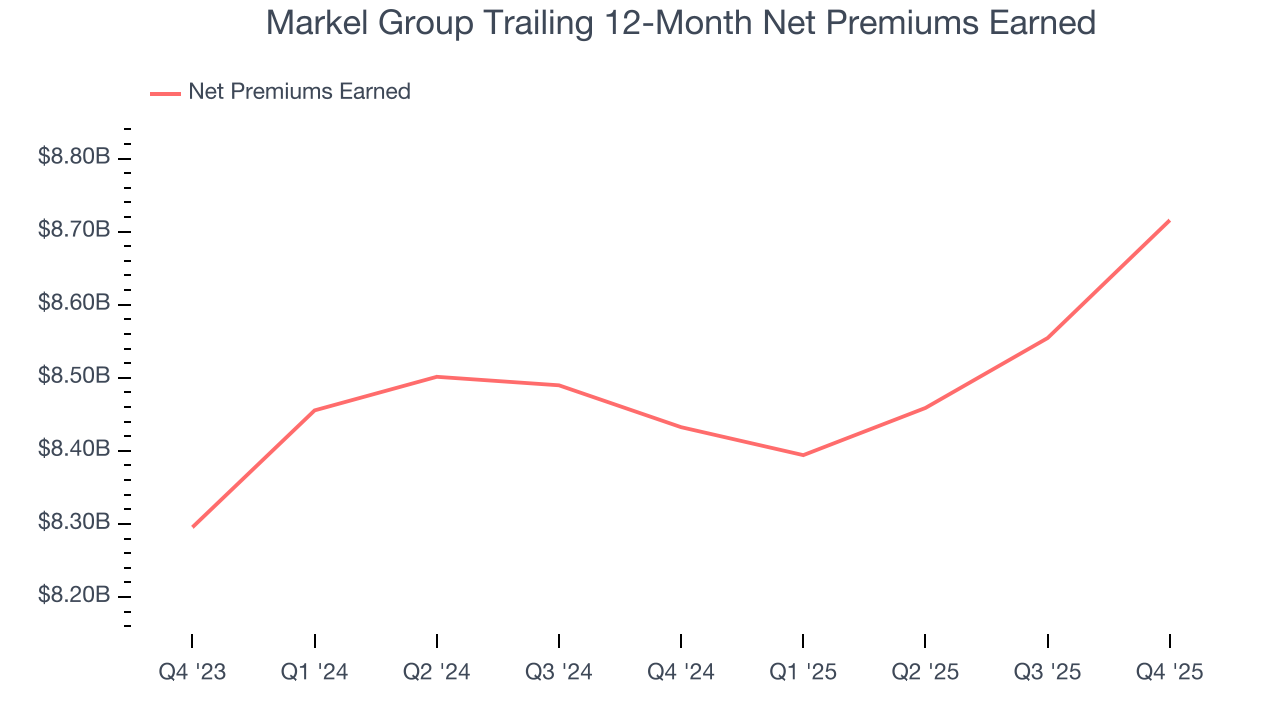
Markel Group’s net premiums earned came in at $2.28 billion this quarter, up 7.6% year on year and topping Wall Street Consensus estimates by 5.1%.
7. Combined Ratio
Revenue growth is one major determinant of business quality, and the efficiency of operations is another. For insurance companies, we look at the combined ratio rather than the operating expenses and margins that define sectors such as consumer, tech, and industrials.
Combined ratio sums operating costs (salaries, commissions, overhead) with what is paid out in claims (losses) and divides this by net premiums earned. Combined ratios under 100% means profits while ones over 100% mean losses on its core operations of selling insurance policies.
Given the calculation, a lower expense ratio is better. Over the last five years, Markel Group’s combined ratio has swelled by 7 percentage points, going from 91.3% to 94.3%. It has also improved by 3.9 percentage points on a two-year basis, showing its expenses have consistently grown at a slower rate than revenue. This typically signals prudent management.
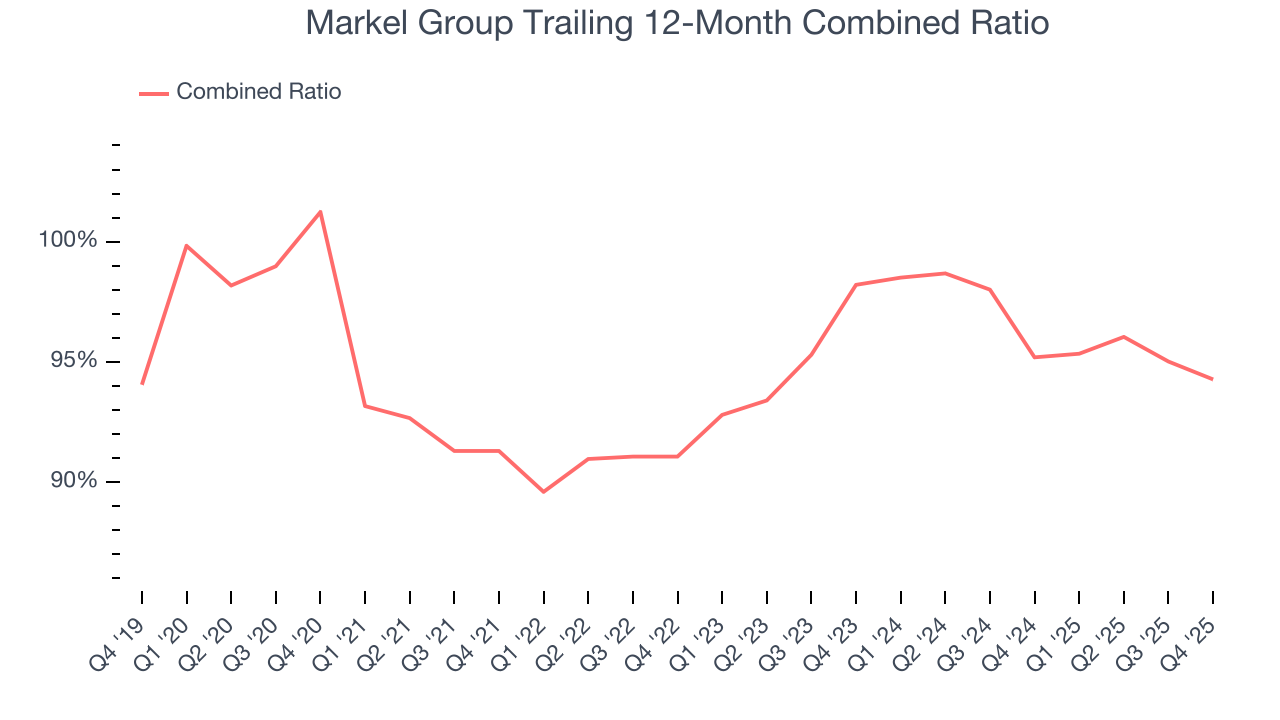
Markel Group’s combined ratio came in at 92.7% this quarter, beating analysts’ expectations by 260 basis points (100 basis points = 1 percentage point). This result was 3 percentage points better than the same quarter last year.
8. Earnings Per Share
Revenue trends explain a company’s historical growth, but the long-term change in earnings per share (EPS) points to the profitability of that growth – for example, a company could inflate its sales through excessive spending on advertising and promotions.
Markel Group’s EPS grew at a spectacular 23.7% compounded annual growth rate over the last five years, higher than its 11.2% annualized revenue growth. However, this alone doesn’t tell us much about its business quality because its combined ratio didn’t improve.
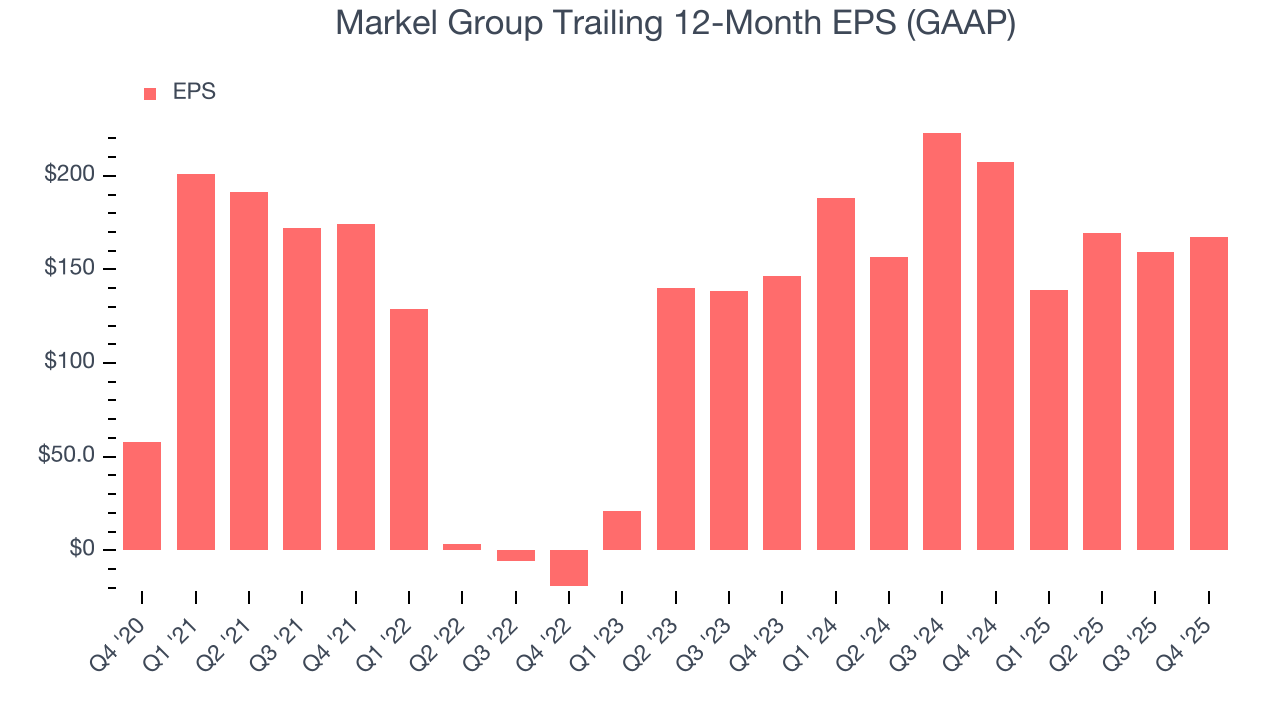
Diving into Markel Group’s quality of earnings can give us a better understanding of its performance. As we mentioned earlier, Markel Group’s combined ratio improved by 7 percentage points over the last five years. On top of that, its share count shrank by 13.7%. These are positive signs for shareholders because improving profitability and share buybacks turbocharge EPS growth relative to revenue growth. 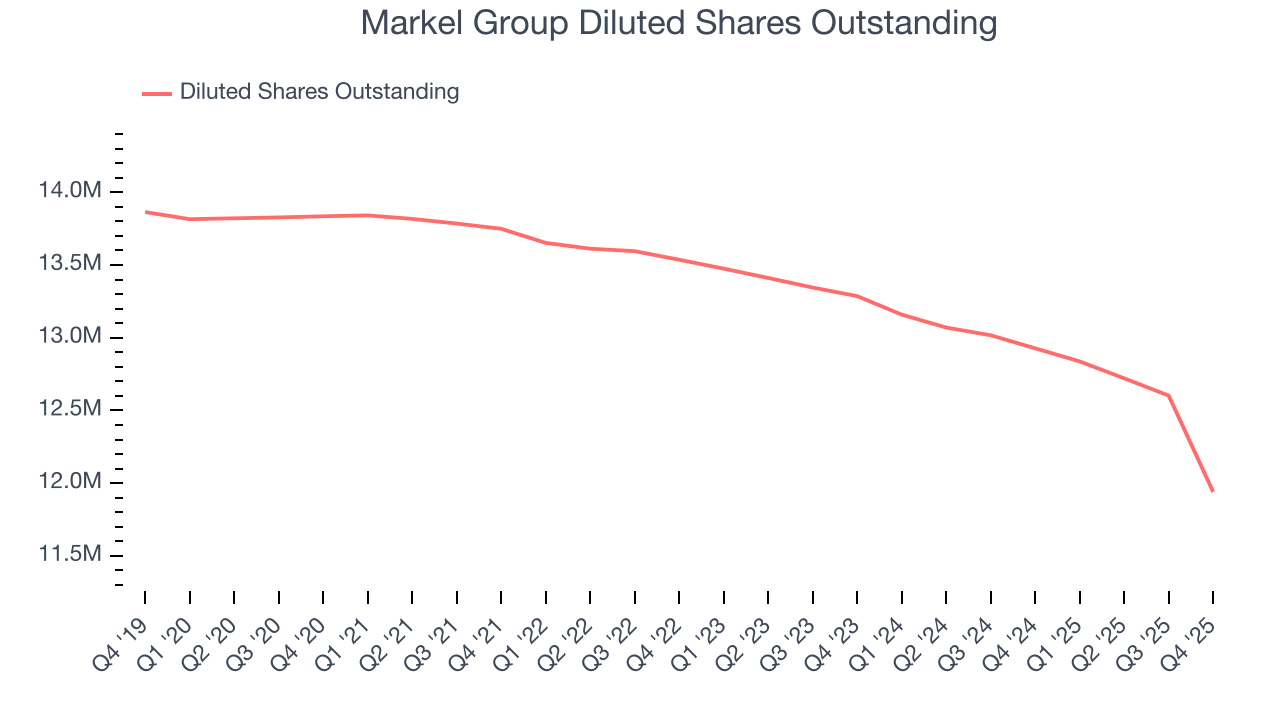
Like with revenue, we analyze EPS over a more recent period because it can provide insight into an emerging theme or development for the business.
For Markel Group, its two-year annual EPS growth of 6.8% was lower than its five-year trend. We hope its growth can accelerate in the future.
In Q4, Markel Group reported EPS of $48.75, up from $41.09 in the same quarter last year. This print easily cleared analysts’ estimates, and shareholders should be content with the results. Over the next 12 months, Wall Street expects Markel Group’s full-year EPS of $167.05 to shrink by 8.1%.
9. Book Value Per Share (BVPS)
Insurance companies are balance sheet businesses, collecting premiums upfront and paying out claims over time. The float – premiums collected but not yet paid out – are invested, creating an asset base supported by a liability structure. Book value captures this dynamic by measuring:
- Assets (investment portfolio, cash, reinsurance recoverables) - liabilities (claim reserves, debt, future policy benefits)
BVPS is essentially the residual value for shareholders.
We therefore consider BVPS very important to track for insurers and a metric that sheds light on business quality. While other (and more commonly known) per-share metrics like EPS can sometimes be lumpy due to reserve releases or one-time items and can be managed or skewed while still following accounting rules, BVPS reflects long-term capital growth and is harder to manipulate.
Markel Group’s BVPS grew at a solid 10% annual clip over the last five years. BVPS growth has also accelerated recently, growing by 14.2% annually over the last two years from $1,096 to $1,429 per share.
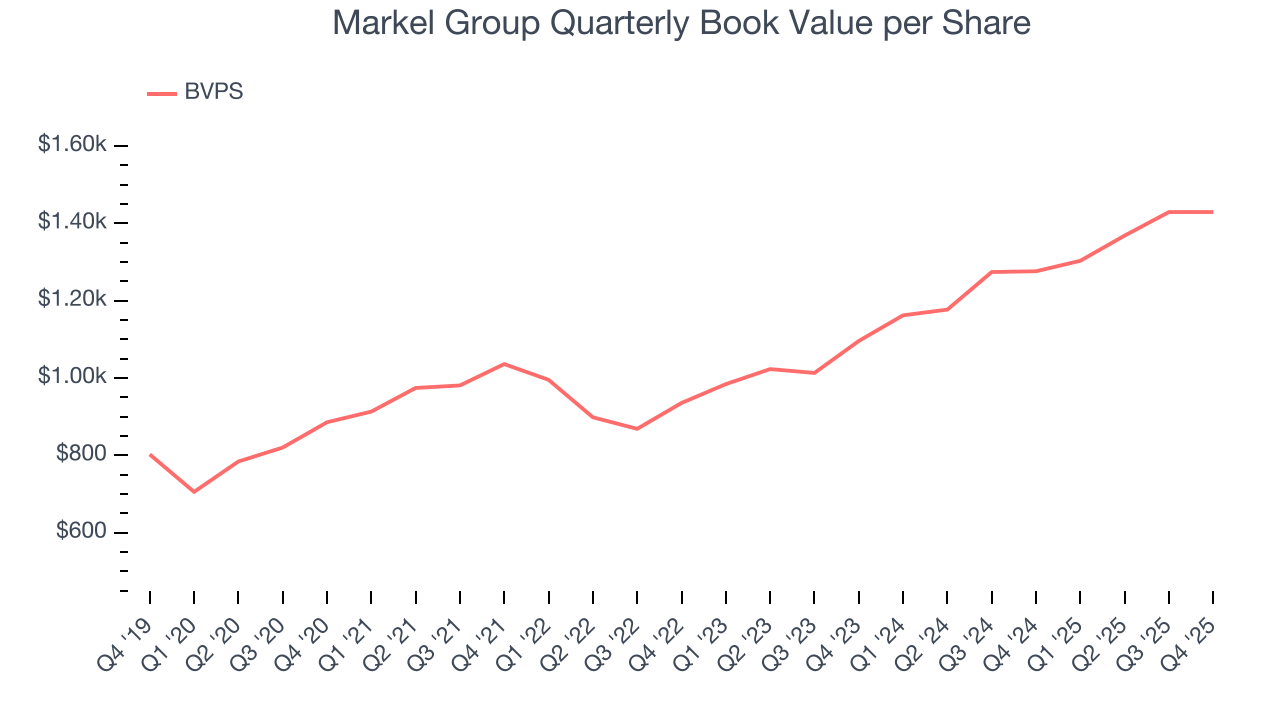
Over the next 12 months, Consensus estimates call for Markel Group’s BVPS to grow by 13.7% to $1,484, solid growth rate.
10. Balance Sheet Assessment
The debt-to-equity ratio is a widely used measure to assess a company's balance sheet health. A higher ratio means that a business aggressively financed its growth with debt. This can result in higher earnings (if the borrowed funds are invested profitably) but also increases risk.
If debt levels are too high, there could be difficulties in meeting obligations, especially during economic downturns or periods of rising interest rates if the debt has variable-rate payments.
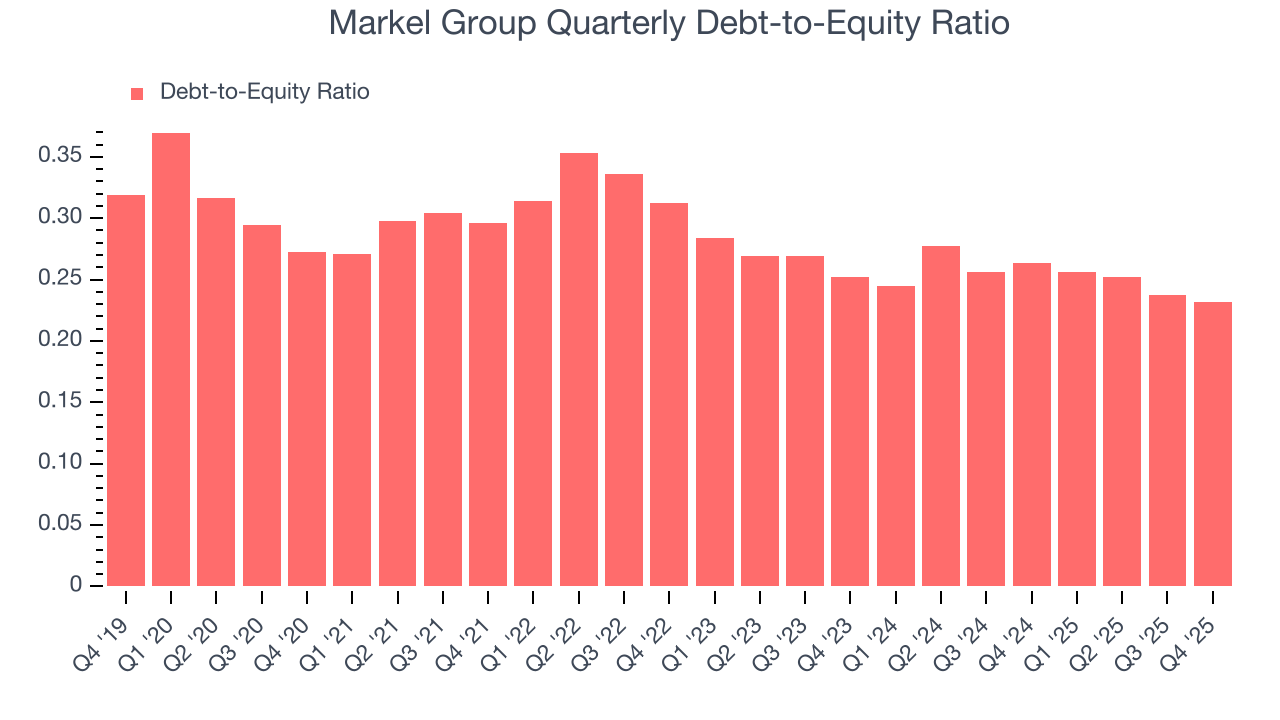
Markel Group currently has $4.30 billion of debt and $18.6 billion of shareholder's equity on its balance sheet, and over the past four quarters, has averaged a debt-to-equity ratio of 0.2×. We think this is safe and raises no red flags. In general, we’re comfortable with any ratio below 1.0× for an insurance business. Anything below 0.5× is a bonus.
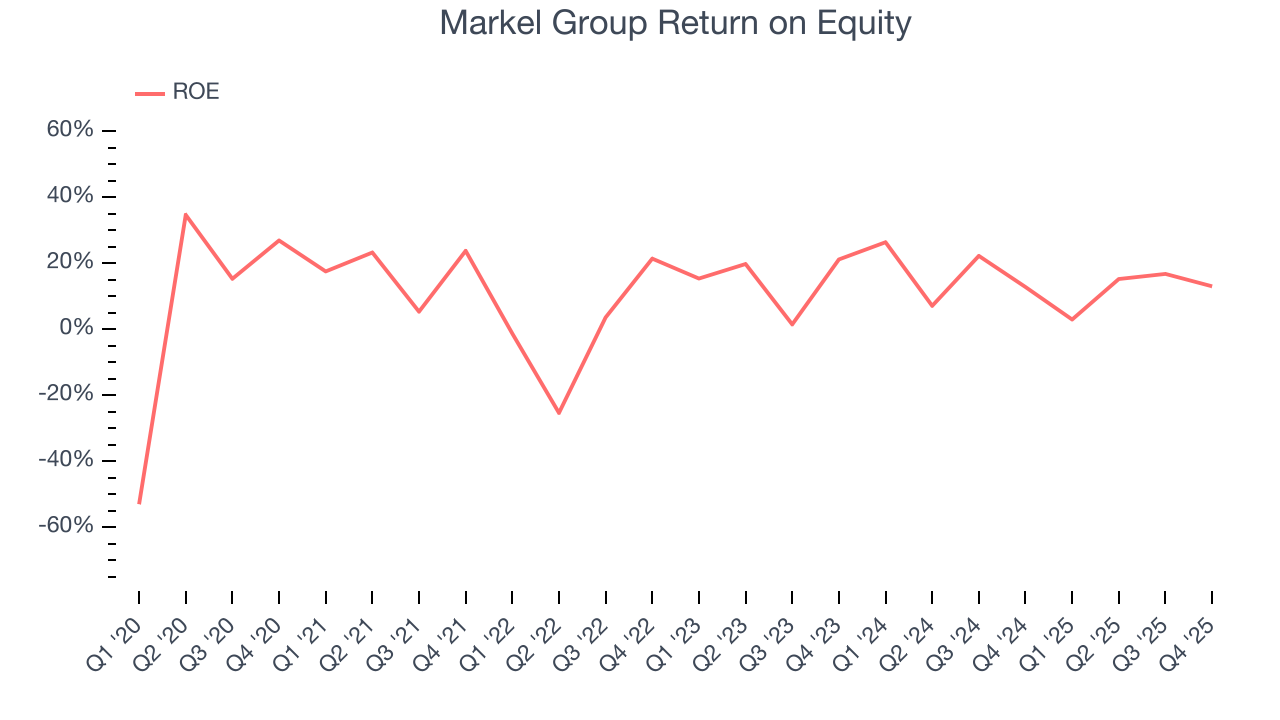
11. Return on Equity
Return on Equity, or ROE, ties everything together and is a vital metric. It tells us how much profit the insurer generates for each dollar of shareholder equity entrusted to management. Over a long period, insurers with higher ROEs tend to compound shareholder wealth faster through retained earnings, buybacks, and dividends.
Over the last five years, Markel Group has averaged an ROE of 12.1%, uninspiring for a company operating in a sector where the average shakes out around 12.5%.
12. Key Takeaways from Markel Group’s Q4 Results
It was good to see Markel Group beat analysts’ EPS expectations this quarter. We were also excited its net premiums earned outperformed Wall Street’s estimates by a wide margin. Zooming out, we think this was a good print with some key areas of upside. The stock remained flat at $2,061 immediately after reporting.
13. Is Now The Time To Buy Markel Group?
Updated: February 5, 2026 at 11:33 PM EST
Before deciding whether to buy Markel Group or pass, we urge investors to consider business quality, valuation, and the latest quarterly results.
There are some bright spots in Markel Group’s fundamentals, but its business quality ultimately falls short. To kick things off, its revenue growth was impressive over the last five years. And while Markel Group’s projected EPS for the next year is lacking, its spectacular EPS growth over the last five years shows its profits are trickling down to shareholders.
Markel Group’s P/B ratio based on the next 12 months is 1.3x. Beauty is in the eye of the beholder, but we don’t really see a big opportunity at the moment. We're pretty confident there are more exciting stocks to buy at the moment.
Wall Street analysts have a consensus one-year price target of $2,039 on the company (compared to the current share price of $2,059).