Marcus & Millichap (MMI)
Marcus & Millichap is up against the odds. Its sales have underperformed and its low returns on capital show it has few growth opportunities.― StockStory Analyst Team
1. News


2. Summary
Why We Think Marcus & Millichap Will Underperform
Founded in 1971, Marcus & Millichap (NYSE:MMI) specializes in commercial real estate investment sales, financing, research, and advisory services.
- Muted 1% annual revenue growth over the last five years shows its demand lagged behind its consumer discretionary peers
- Earnings per share fell by 15.3% annually over the last five years while its revenue grew, showing its incremental sales were much less profitable
- Suboptimal cost structure is highlighted by its history of operating margin losses


Marcus & Millichap doesn’t meet our quality criteria. You should search for better opportunities.
Why There Are Better Opportunities Than Marcus & Millichap


At $25.43 per share, Marcus & Millichap trades at 39x forward P/E. This multiple is higher than that of consumer discretionary peers; it’s also rich for the top-line growth of the company. Not a great combination.
We’d rather invest in similarly-priced but higher-quality companies with more reliable earnings growth.
3. Marcus & Millichap (MMI) Research Report: Q4 CY2025 Update
Real estate brokerage and services firm Marcus & Millichap (NYSE:MMI) announced better-than-expected revenue in Q4 CY2025, with sales up 1.6% year on year to $244 million. Its GAAP profit of $0.34 per share was 58.1% above analysts’ consensus estimates.
Marcus & Millichap (MMI) Q4 CY2025 Highlights:
- Revenue: $244 million vs analyst estimates of $229.5 million (1.6% year-on-year growth, 6.3% beat)
- EPS (GAAP): $0.34 vs analyst estimates of $0.22 (58.1% beat)
- Adjusted EBITDA: $25.01 million vs analyst estimates of $10.9 million (10.3% margin, significant beat)
- Operating Margin: 6.3%, up from 3% in the same quarter last year
- Market Capitalization: $973.1 million
Company Overview
Founded in 1971, Marcus & Millichap (NYSE:MMI) specializes in commercial real estate investment sales, financing, research, and advisory services.
The foundation of Marcus & Millichap's business model is its unique investment brokerage focus. The company primarily concentrates on selling commercial real estate properties to individual and institutional investors. This specialization has allowed Marcus & Millichap to develop expertise in various property types, including multifamily, retail, office, industrial, hospitality, self-storage, and senior housing.
Marcus & Millichap's agents work across geographic boundaries and property types, leveraging the company's proprietary database to match buyers and sellers effectively. This collaborative approach has earned Marcus & Millichap a reputation for executing transactions efficiently and maximizing value for clients.
The company's services extend beyond sales and brokerage. Marcus & Millichap Capital Corporation, a subsidiary, offers clients financing services, including debt and equity financing for a range of property types. The firm also provides advisory services, including market research, property valuation, and consultation for property owners, developers, and investors, ensuring clients are well-informed to make strategic real estate decisions.
4. Consumer Discretionary - Real Estate Services
The Consumer Discretionary sector, by definition, is made up of companies selling non-essential goods and services. When economic conditions deteriorate or tastes shift, consumers can easily cut back or eliminate these purchases. For long-term investors with five-year holding periods, this creates a structural challenge: the sector is inherently hit-driven, with low switching costs and fickle customers. As a result, only a handful of companies can reliably grow demand and compound earnings over long periods, which is why our bar is high and High Quality ratings are rare.
Real estate services companies provide brokerage, property management, appraisal, and advisory services, earning transaction-based commissions and recurring management fees. Tailwinds include long-term housing demand driven by demographic growth, technology platforms that expand market access, and commercial real estate complexity that sustains advisory needs. Headwinds are pronounced: rising interest rates directly suppress transaction volumes by reducing housing affordability and commercial deal activity. Commission-rate compression, driven by discount brokerages and regulatory changes, erodes per-transaction revenue. The industry is highly cyclical, with revenue swings amplified by leverage. PropTech (property technology) disruptors threaten traditional intermediary models.
Marcus & Millichap's primary competitors include CBRE (NYSE:CBRE), Jones Lang LaSalle (NYSE:JLL), Cushman & Wakefield (NYSE:CWK), Colliers International (NASDAQ:CIGI), and Newmark (NASDAQ:NMRK).
5. Revenue Growth
Reviewing a company’s long-term sales performance reveals insights into its quality. Any business can experience short-term success, but top-performing ones enjoy sustained growth for years. Over the last five years, Marcus & Millichap grew its sales at a weak 1% compounded annual growth rate. This was below our standards and is a tough starting point for our analysis.
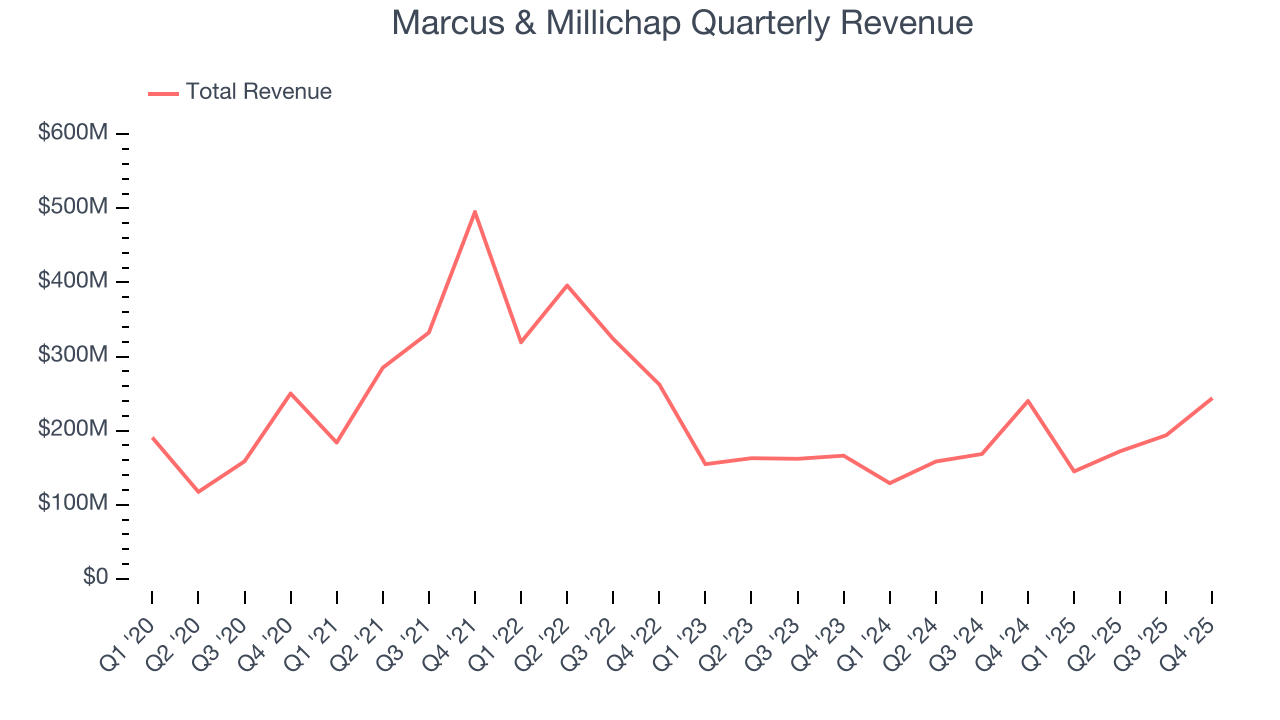
Long-term growth is the most important, but within consumer discretionary, product cycles are short and revenue can be hit-driven due to rapidly changing trends and consumer preferences. Marcus & Millichap’s annualized revenue growth of 8.1% over the last two years is above its five-year trend, which is encouraging. 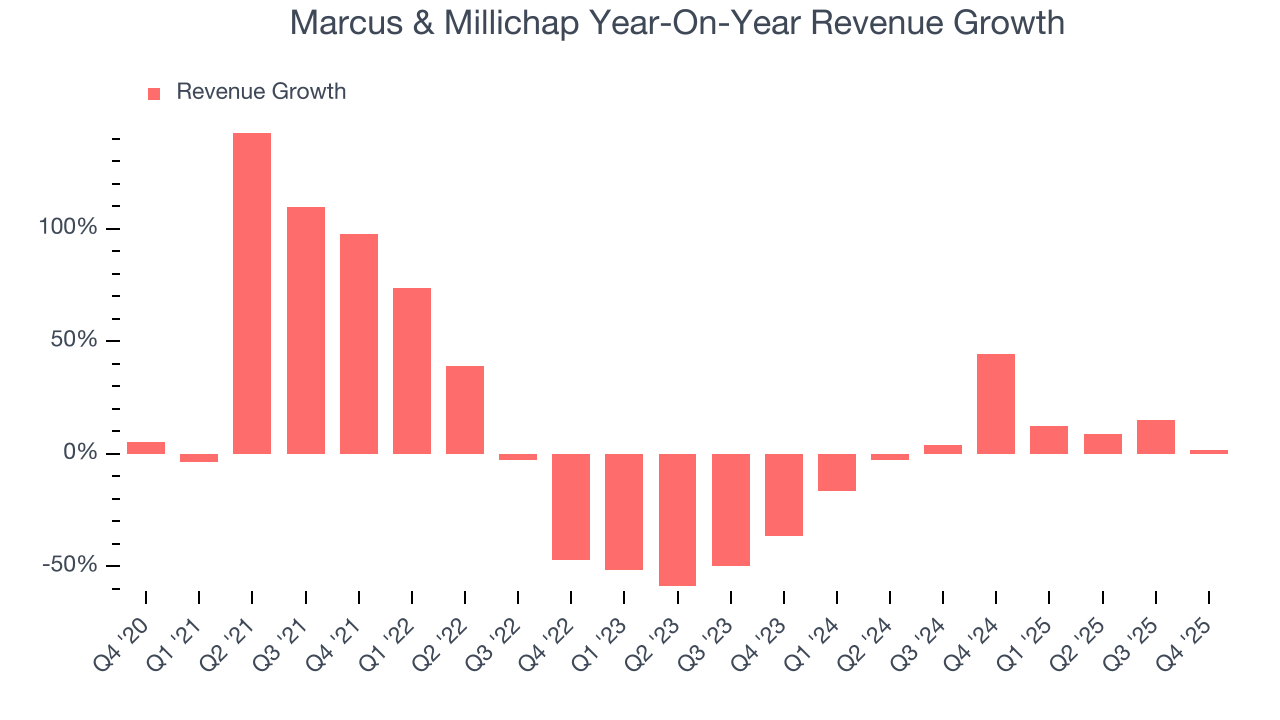
Marcus & Millichap also breaks out the revenue for its most important segments, Brokerage and Financing, which are 84.2% and 13.6% of revenue. Over the last two years, Marcus & Millichap’s Brokerage revenue (commission fees) averaged 8.2% year-on-year growth while its Financing revenue (financing fees) averaged 25.9% growth. 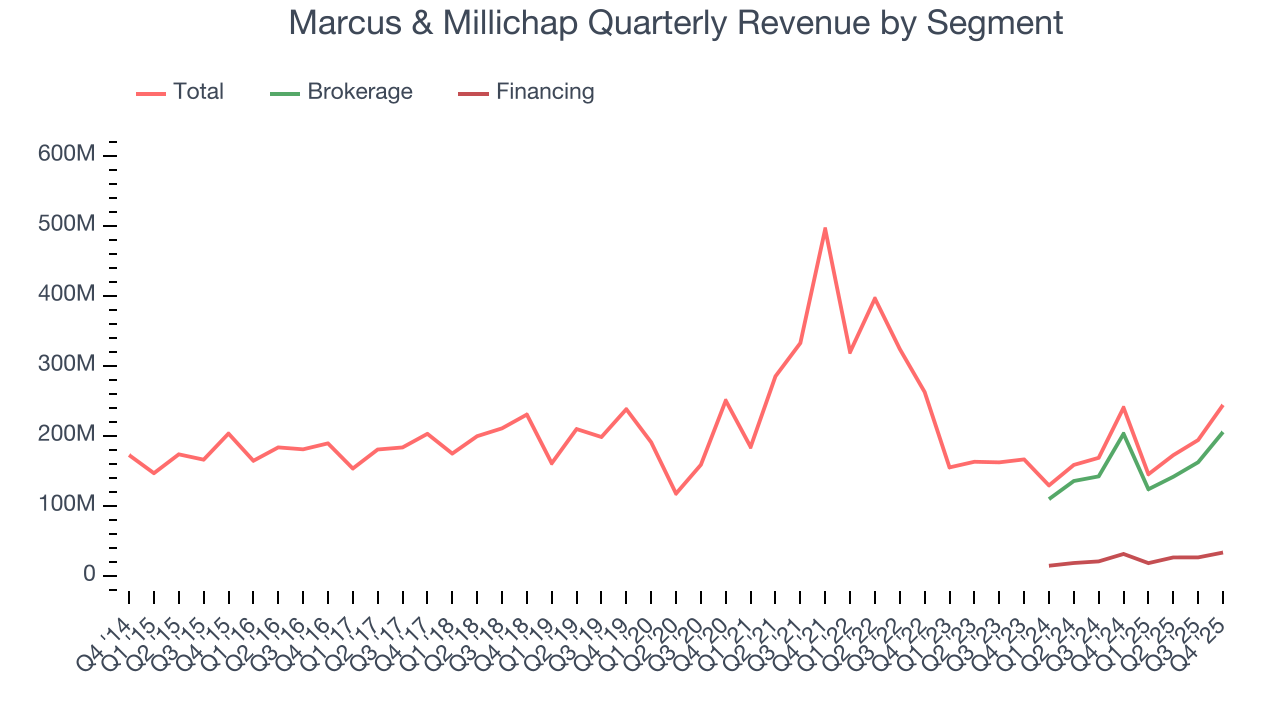
This quarter, Marcus & Millichap reported modest year-on-year revenue growth of 1.6% but beat Wall Street’s estimates by 6.3%.
Looking ahead, sell-side analysts expect revenue to grow 12.6% over the next 12 months, an improvement versus the last two years. This projection is above the sector average and suggests its newer products and services will spur better top-line performance.
6. Operating Margin
Operating margin is an important measure of profitability as it shows the portion of revenue left after accounting for all core expenses – everything from the cost of goods sold to advertising and wages. It’s also useful for comparing profitability across companies with different levels of debt and tax rates because it excludes interest and taxes.
Marcus & Millichap’s operating margin has risen over the last 12 months, but it still averaged negative 3.2% over the last two years. This is due to its large expense base and inefficient cost structure.
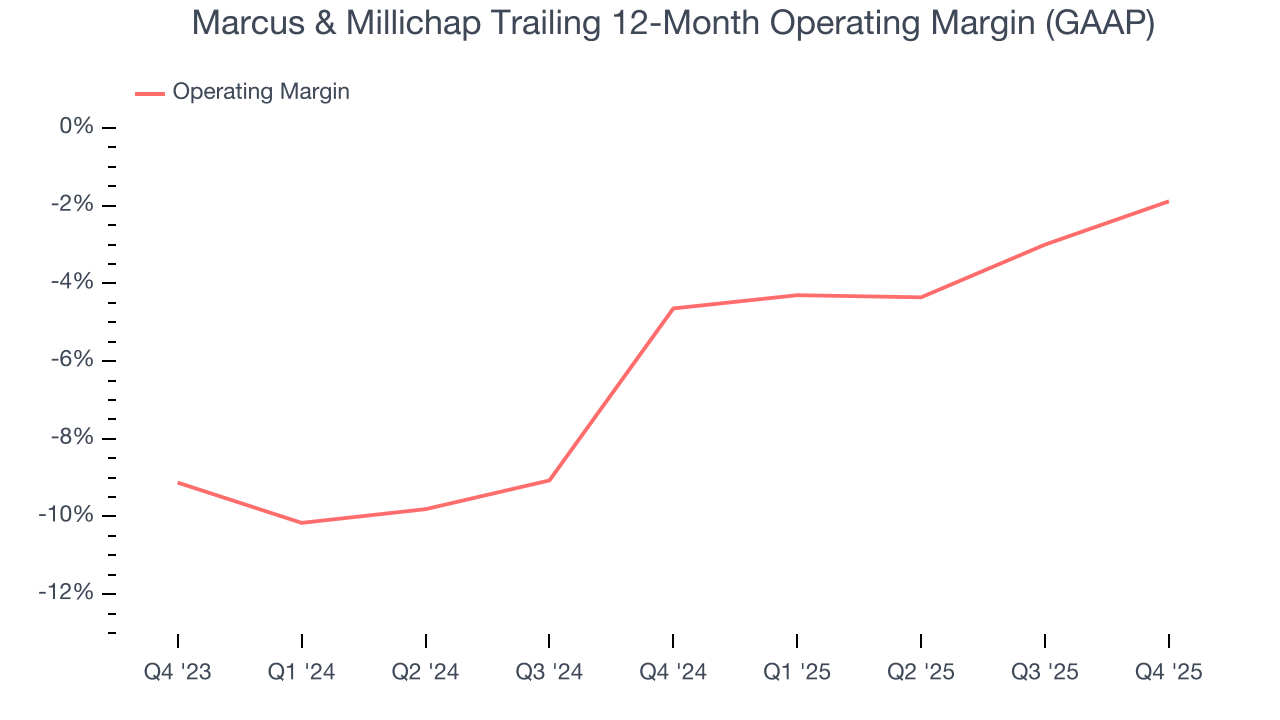
In Q4, Marcus & Millichap generated an operating margin profit margin of 6.3%, up 3.4 percentage points year on year. This increase was a welcome development and shows it was more efficient.
7. Earnings Per Share
Revenue trends explain a company’s historical growth, but the long-term change in earnings per share (EPS) points to the profitability of that growth – for example, a company could inflate its sales through excessive spending on advertising and promotions.
Sadly for Marcus & Millichap, its EPS declined by 15.3% annually over the last five years while its revenue grew by 1%. This tells us the company became less profitable on a per-share basis as it expanded due to non-fundamental factors such as interest expenses and taxes.
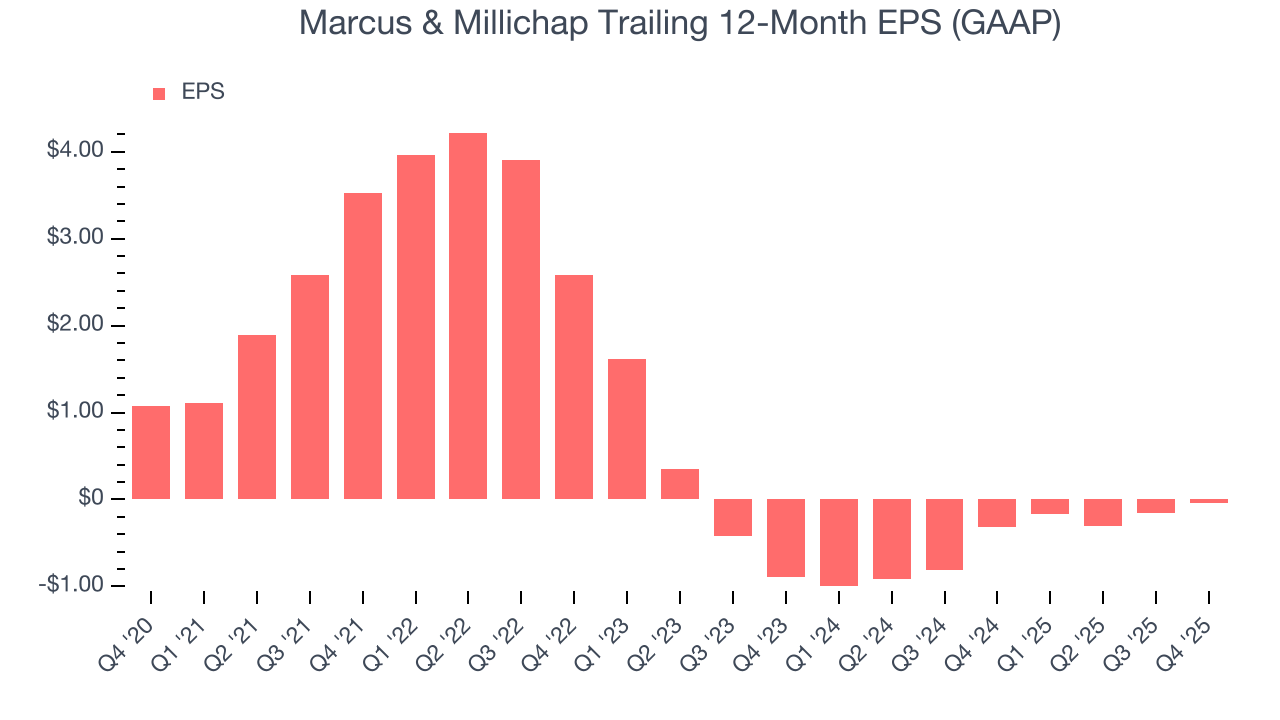
In Q4, Marcus & Millichap reported EPS of $0.34, up from $0.22 in the same quarter last year. This print easily cleared analysts’ estimates, and shareholders should be content with the results. Over the next 12 months, Wall Street is optimistic. Analysts forecast Marcus & Millichap’s full-year EPS of negative $0.04 will flip to positive $0.57.
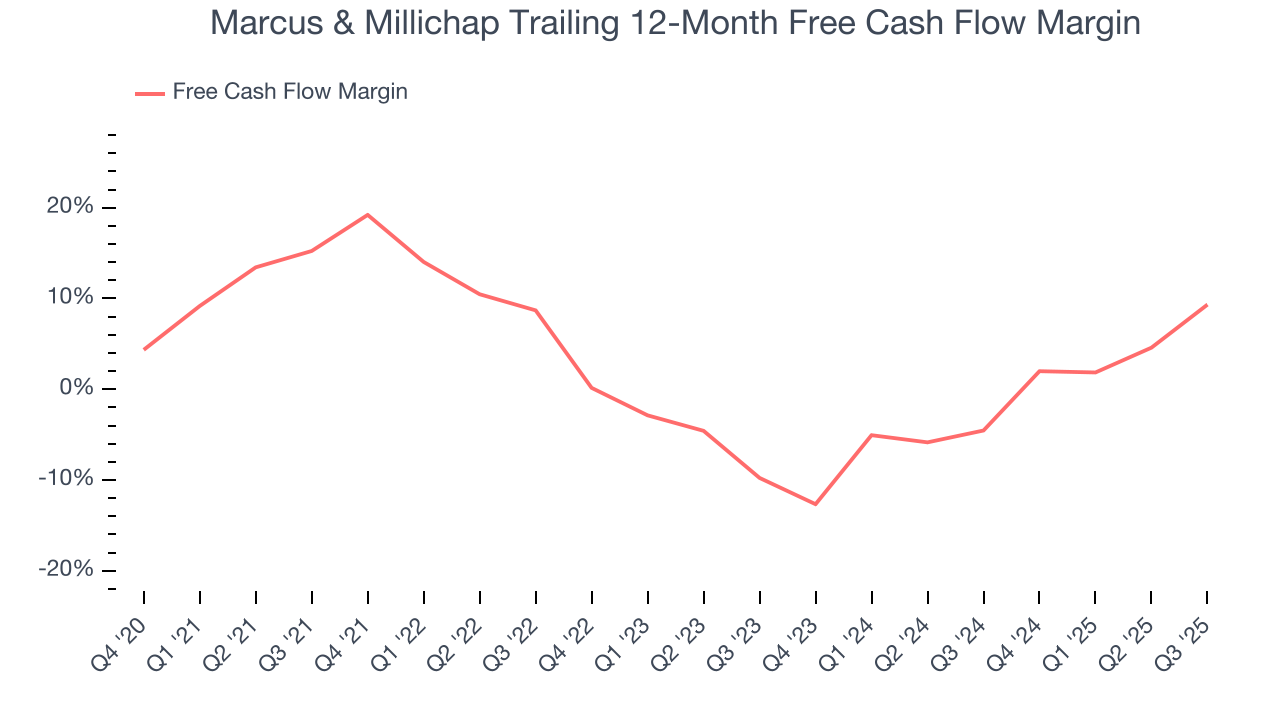
8. Cash Is King
Although earnings are undoubtedly valuable for assessing company performance, we believe cash is king because you can’t use accounting profits to pay the bills.
Marcus & Millichap has shown poor cash profitability over the last two years, giving the company limited opportunities to return capital to shareholders. Its free cash flow margin averaged 2.4%, lousy for a consumer discretionary business.
9. Return on Invested Capital (ROIC)
EPS and free cash flow tell us whether a company was profitable while growing its revenue. But was it capital-efficient? A company’s ROIC explains this by showing how much operating profit it makes compared to the money it has raised (debt and equity).
Marcus & Millichap historically did a mediocre job investing in profitable growth initiatives. Its five-year average ROIC was 16.1%, somewhat low compared to the best consumer discretionary companies that consistently pump out 25%+.
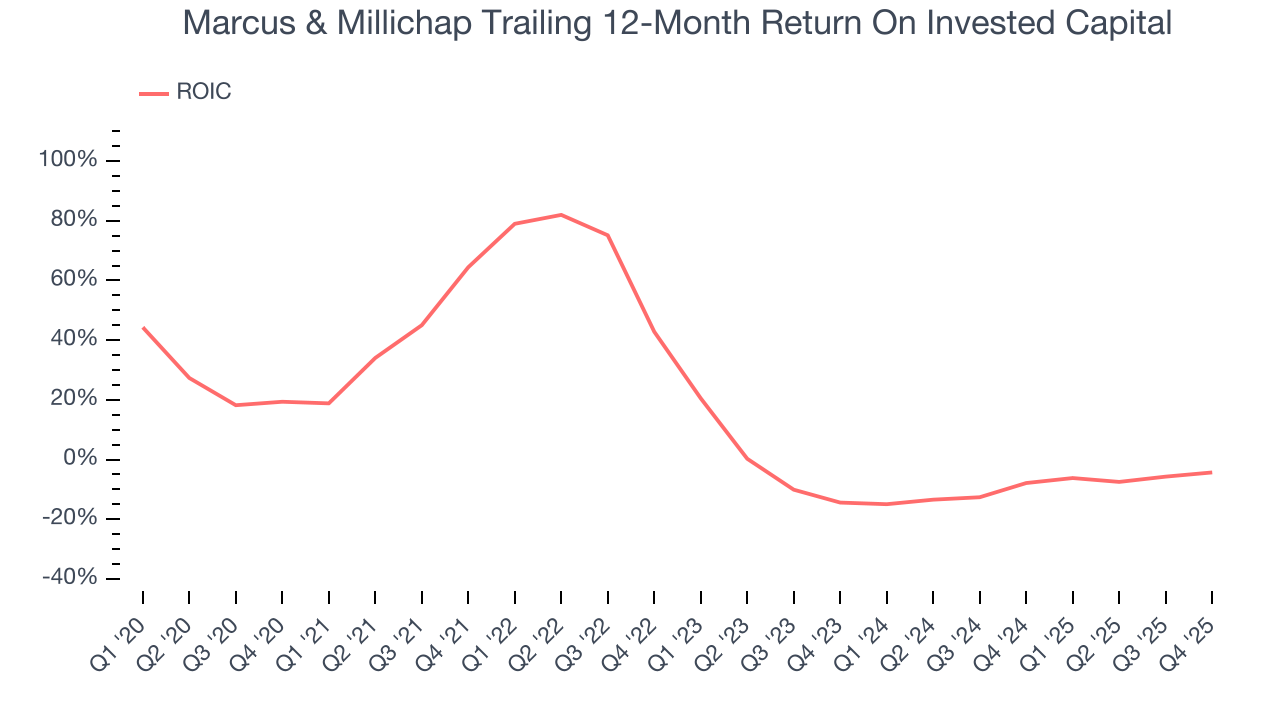
We like to invest in businesses with high returns, but the trend in a company’s ROIC is what often surprises the market and moves the stock price. Unfortunately, Marcus & Millichap’s ROIC has decreased significantly over the last few years. Paired with its already low returns, these declines suggest its profitable growth opportunities are few and far between.
10. Balance Sheet Assessment
Companies with more cash than debt have lower bankruptcy risk.
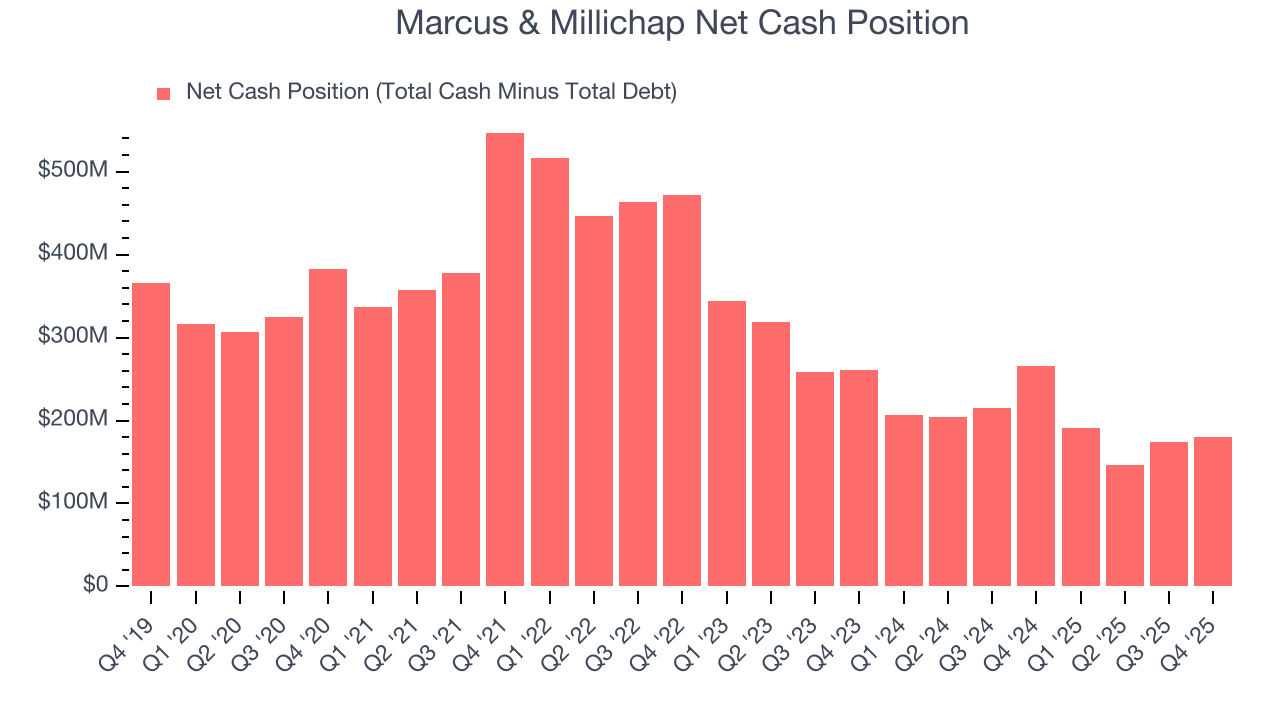
Marcus & Millichap is a well-capitalized company with $258.1 million of cash and $78.26 million of debt on its balance sheet. This $179.9 million net cash position is 17.8% of its market cap and gives it the freedom to borrow money, return capital to shareholders, or invest in growth initiatives. Leverage is not an issue here.
11. Key Takeaways from Marcus & Millichap’s Q4 Results
It was good to see Marcus & Millichap beat analysts’ EPS expectations this quarter. We were also excited its EBITDA outperformed Wall Street’s estimates by a wide margin. Zooming out, we think this was a good print with some key areas of upside. The stock remained flat at $25.01 immediately after reporting.
12. Is Now The Time To Buy Marcus & Millichap?
Updated: March 14, 2026 at 10:06 PM EDT
A common mistake we notice when investors are deciding whether to buy a stock or not is that they simply look at the latest earnings results. Business quality and valuation matter more, so we urge you to understand these dynamics as well.
Marcus & Millichap falls short of our quality standards. While its projected EPS for the next year implies the company’s fundamentals will improve, the downside is its declining EPS over the last five years makes it a less attractive asset to the public markets. On top of that, its relatively low ROIC suggests management has struggled to find compelling investment opportunities.
Marcus & Millichap’s P/E ratio based on the next 12 months is 39x. At this valuation, there’s a lot of good news priced in - you can find more timely opportunities elsewhere.
Wall Street analysts have a consensus one-year price target of $28 on the company (compared to the current share price of $25.43).