
Quanex (NX)
We’re wary of Quanex. Its sales have underperformed and its low returns on capital show it has few growth opportunities.― StockStory Analyst Team
1. News
2. Summary
Why We Think Quanex Will Underperform
Starting in the seamless tube industry, Quanex (NYSE:NX) manufactures building products like window, door, kitchen, and bath cabinet components.
- Forecasted revenue decline of 1% for the upcoming 12 months implies demand will fall off a cliff
- Operating margin falls short of the industry average, and the smaller profit dollars make it harder to react to unexpected market developments
- One positive is that its annual revenue growth of 16.6% over the last five years was superb and indicates its market share increased during this cycle


Quanex doesn’t meet our quality criteria. We’d rather invest in businesses with stronger moats.
Why There Are Better Opportunities Than Quanex


Quanex’s stock price of $18.69 implies a valuation ratio of 6.6x forward P/E. This certainly seems like a cheap stock, but we think there are valid reasons why it trades this way.
Cheap stocks can look like a great deal at first glance, but they can be value traps. They often have less earnings power, meaning there is more reliance on a re-rating to generate good returns - an unlikely scenario for low-quality companies.
3. Quanex (NX) Research Report: Q3 CY2025 Update
Building products company Quanex (NYSE:NX) beat Wall Street’s revenue expectations in Q3 CY2025, but sales were flat year on year at $489.8 million. Its non-GAAP profit of $0.83 per share was 61.2% above analysts’ consensus estimates.
Quanex (NX) Q3 CY2025 Highlights:
- "While the integration of the Tyman business is substantially complete, we still believe there is a path to realizing approximately $45 million in cost synergies over time, above our initial projection of $30 million, which has been fully realized"
- Revenue: $489.8 million vs analyst estimates of $469.3 million (flat year on year, 4.4% beat)
- Adjusted EPS: $0.83 vs analyst estimates of $0.52 (61.2% beat)
- Adjusted EBITDA: $70.92 million vs analyst estimates of $59.39 million (14.5% margin, 19.4% beat)
- Operating Margin: 8.8%, up from 0.6% in the same quarter last year
- Free Cash Flow was $66.61 million, up from -$8.17 million in the same quarter last year
- Market Capitalization: $661.4 million
Company Overview
Starting in the seamless tube industry, Quanex (NYSE:NX) manufactures building products like window, door, kitchen, and bath cabinet components.
The company is an original equipment manufacturer (OEM) for products in the building materials industry. Its customers, which include national and regional residential window, door, and cabinet manufacturers, come to the company to buy the components needed to build their respective products.
For example, Quanex offers products like energy-efficient flexible insulating glass spaces, extruded vinyl profiles, and window and door screens, which are all components needed to manufacture windows and doors. This market is called the fenestration component market, which just means parts for the windows and doors industry. The company also offers non-fenestration products, like solar panel sealants, trim moldings, decking, fencing, and water retention barriers.
The sale of its fenestration products makes up most of the company’s revenue. These products are sold, through direct marketing, to building product manufacturers and suppliers in the construction industry. Its revenue can be divided into four revenue-generating segments, with North American Fenestration sales leading the way, followed by European Fenestration, North American Cabinet Components, and the Unallocated Corporate and Others segment.
4. Home Construction Materials
Traditionally, home construction materials companies have built economic moats with expertise in specialized areas, brand recognition, and strong relationships with contractors. More recently, advances to address labor availability and job site productivity have spurred innovation that is driving incremental demand. However, these companies are at the whim of residential construction volumes, which tend to be cyclical and can be impacted heavily by economic factors such as interest rates. Additionally, the costs of raw materials can be driven by a myriad of worldwide factors and greatly influence the profitability of home construction materials companies.
Competitors of Quanex include JELD-WEN (NYSE:JELD) and private companies Pella and Anderson.
5. Revenue Growth
Reviewing a company’s long-term sales performance reveals insights into its quality. Any business can put up a good quarter or two, but the best consistently grow over the long haul. Thankfully, Quanex’s 16.6% annualized revenue growth over the last five years was incredible. Its growth beat the average industrials company and shows its offerings resonate with customers.
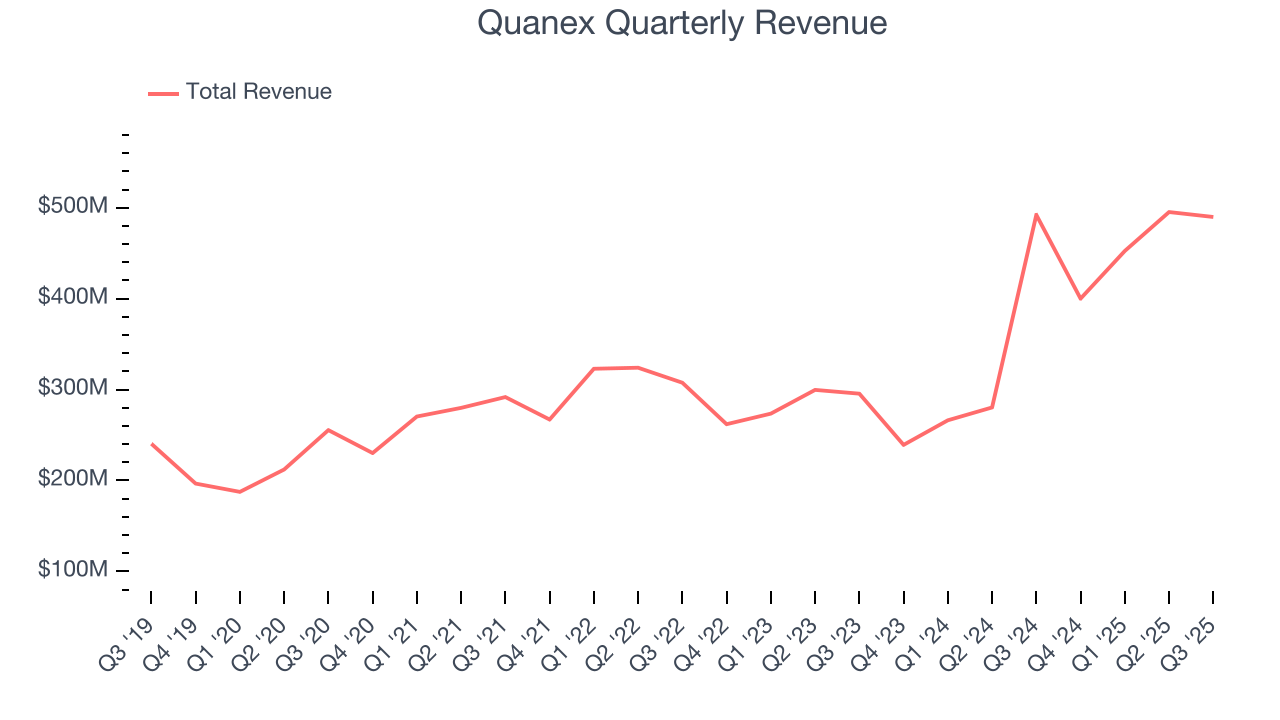
Long-term growth is the most important, but within industrials, a half-decade historical view may miss new industry trends or demand cycles. Quanex’s annualized revenue growth of 27.5% over the last two years is above its five-year trend, suggesting its demand was strong and recently accelerated. 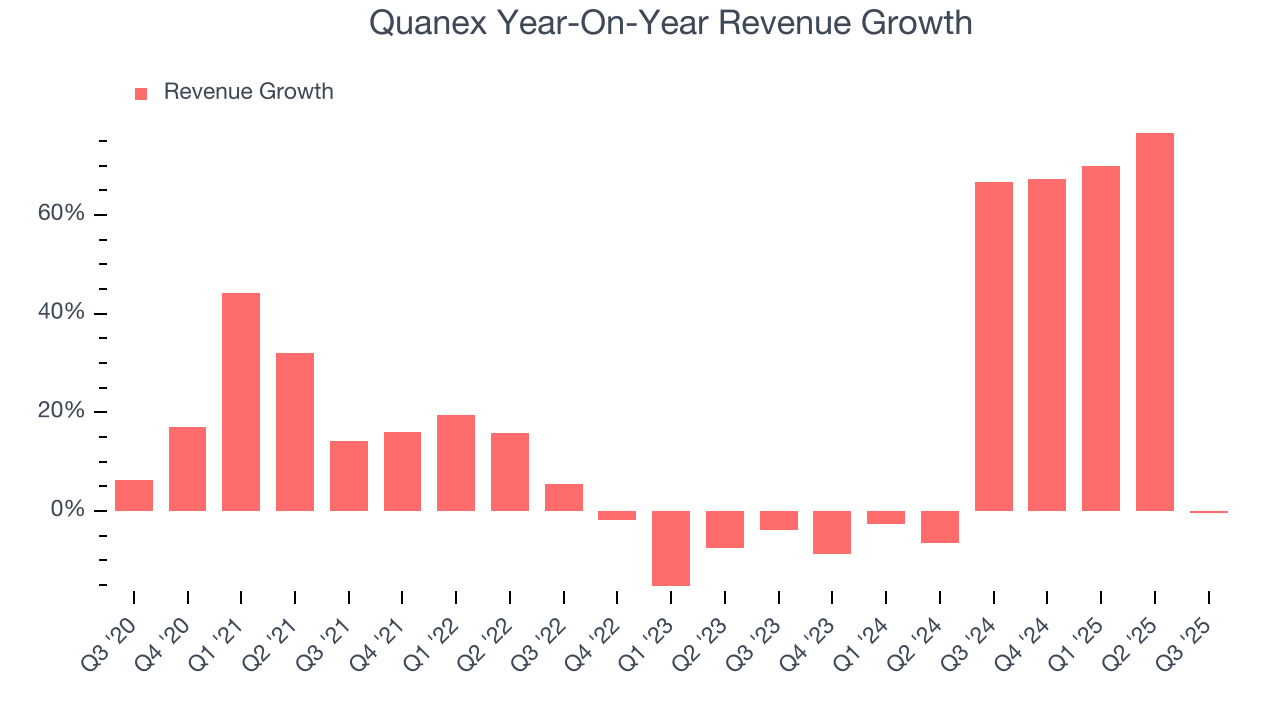
This quarter, Quanex’s $489.8 million of revenue was flat year on year but beat Wall Street’s estimates by 4.4%.
Looking ahead, sell-side analysts expect revenue to decline by 1% over the next 12 months, a deceleration versus the last two years. This projection is underwhelming and implies its products and services will face some demand challenges.
6. Gross Margin & Pricing Power
At StockStory, we prefer high gross margin businesses because they indicate the company has pricing power or differentiated products, giving it a chance to generate higher operating profits.
Quanex has bad unit economics for an industrials company, giving it less room to reinvest and develop new offerings. As you can see below, it averaged a 24.3% gross margin over the last five years. Said differently, Quanex had to pay a chunky $75.66 to its suppliers for every $100 in revenue. 
This quarter, Quanex’s gross profit margin was 28.1%, marking a 4.3 percentage point increase from 23.8% in the same quarter last year. Quanex’s full-year margin has also been trending up over the past 12 months, increasing by 3.2 percentage points. If this move continues, it could suggest better unit economics due to some combination of stable to improving pricing power and input costs (such as raw materials).
7. Operating Margin
Operating margin is an important measure of profitability as it shows the portion of revenue left after accounting for all core expenses – everything from the cost of goods sold to advertising and wages. It’s also useful for comparing profitability across companies with different levels of debt and tax rates because it excludes interest and taxes.
Quanex was profitable over the last five years but held back by its large cost base. Its average operating margin of 2.5% was weak for an industrials business. This result isn’t too surprising given its low gross margin as a starting point.
Looking at the trend in its profitability, Quanex’s operating margin decreased by 18.2 percentage points over the last five years. This raises questions about the company’s expense base because its revenue growth should have given it leverage on its fixed costs, resulting in better economies of scale and profitability. Quanex’s performance was poor no matter how you look at it - it shows that costs were rising and it couldn’t pass them onto its customers.
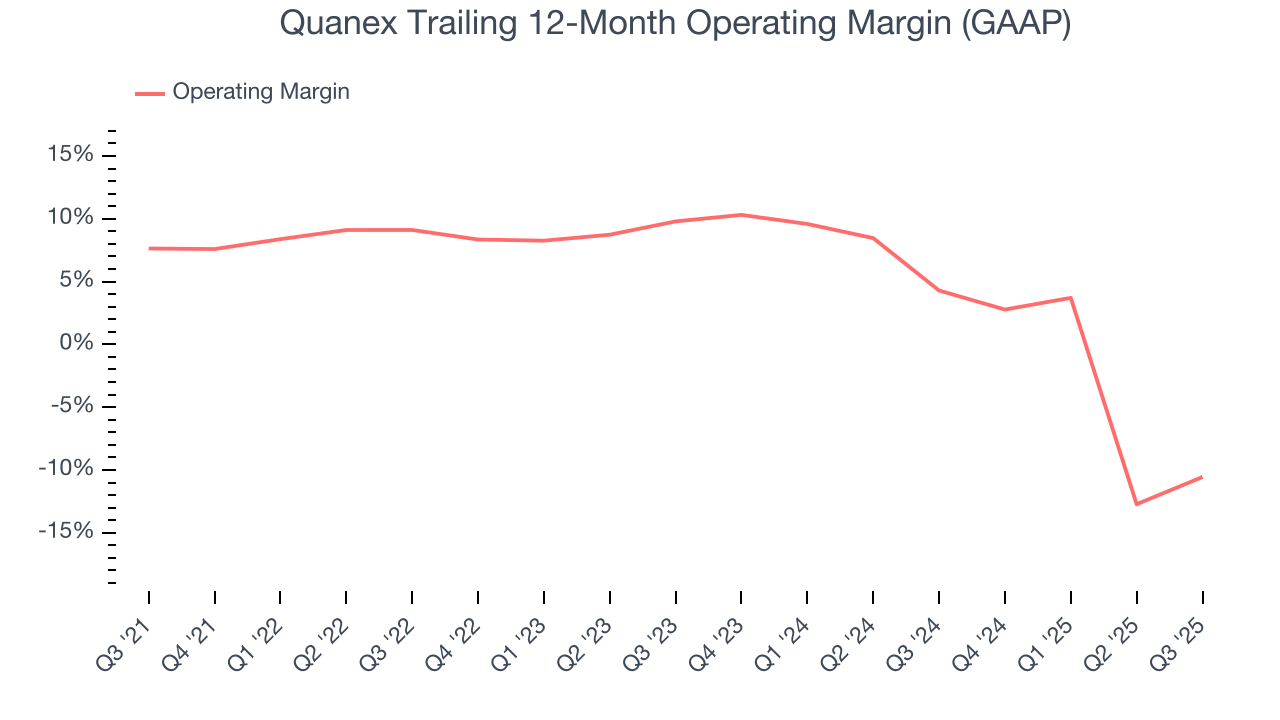
In Q3, Quanex generated an operating margin profit margin of 8.8%, up 8.2 percentage points year on year. The increase was solid, and because its operating margin rose more than its gross margin, we can infer it was more efficient with expenses such as marketing, R&D, and administrative overhead.
8. Earnings Per Share
We track the long-term change in earnings per share (EPS) for the same reason as long-term revenue growth. Compared to revenue, however, EPS highlights whether a company’s growth is profitable.
Quanex’s EPS grew at a remarkable 13.2% compounded annual growth rate over the last five years. However, this performance was lower than its 16.6% annualized revenue growth, telling us the company became less profitable on a per-share basis as it expanded.
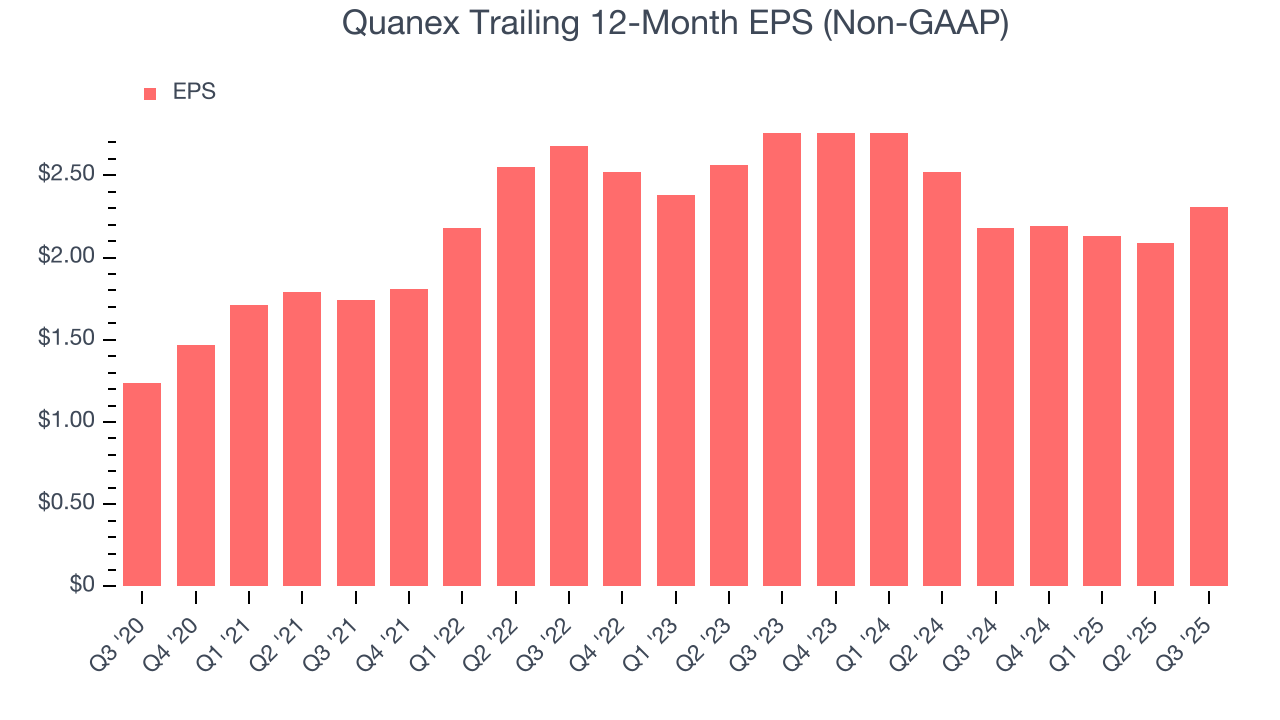
We can take a deeper look into Quanex’s earnings quality to better understand the drivers of its performance. As we mentioned earlier, Quanex’s operating margin expanded this quarter but declined by 18.2 percentage points over the last five years. Its share count also grew by 39%, meaning the company not only became less efficient with its operating expenses but also diluted its shareholders. 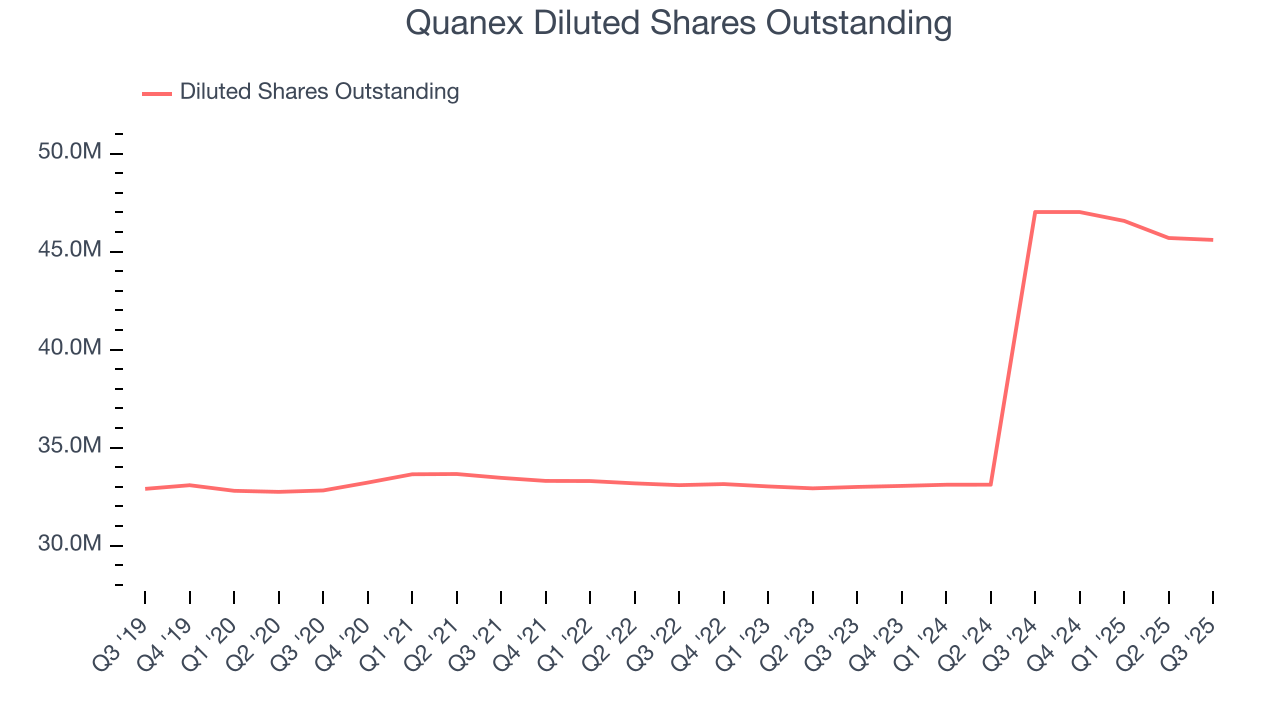
Like with revenue, we analyze EPS over a shorter period to see if we are missing a change in the business.
For Quanex, its two-year annual EPS declines of 8.5% mark a reversal from its (seemingly) healthy five-year trend. We hope Quanex can return to earnings growth in the future.
In Q3, Quanex reported adjusted EPS of $0.83, up from $0.61 in the same quarter last year. This print easily cleared analysts’ estimates, and shareholders should be content with the results. Over the next 12 months, Wall Street expects Quanex’s full-year EPS of $2.31 to shrink by 4.4%.
9. Cash Is King
If you’ve followed StockStory for a while, you know we emphasize free cash flow. Why, you ask? We believe that in the end, cash is king, and you can’t use accounting profits to pay the bills.
Quanex has shown mediocre cash profitability over the last five years, giving the company limited opportunities to return capital to shareholders. Its free cash flow margin averaged 5.9%, subpar for an industrials business.
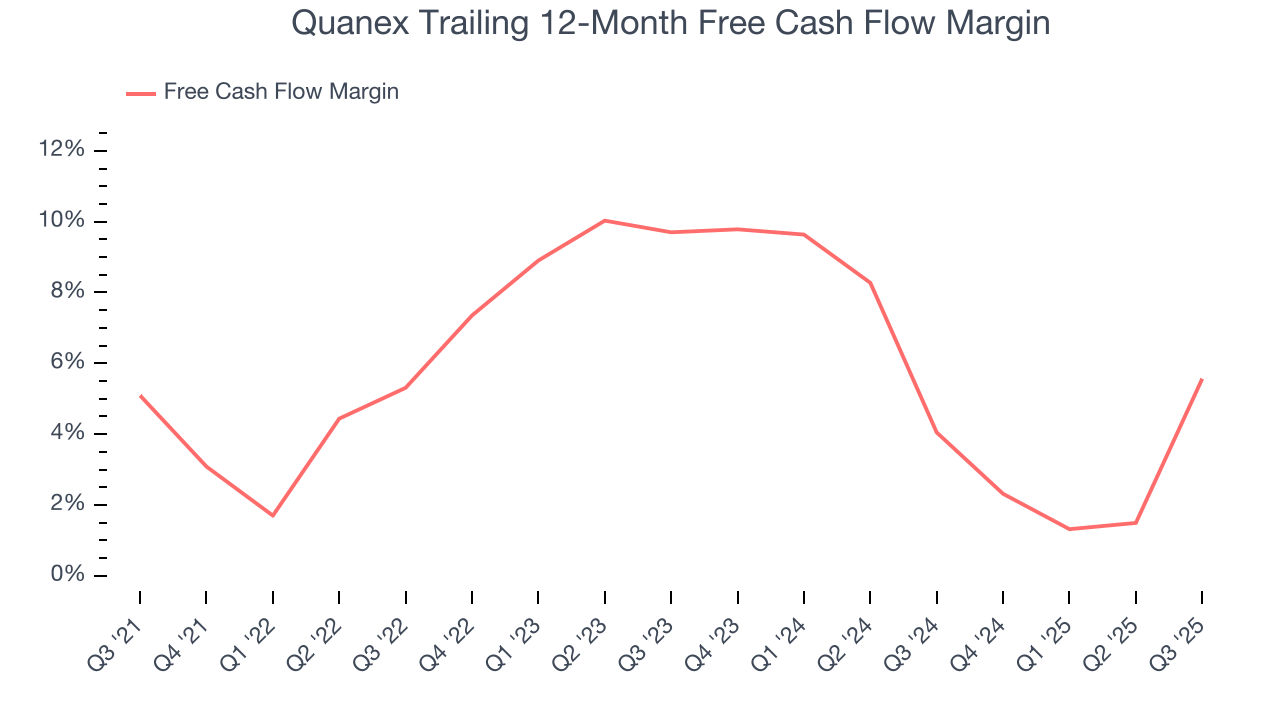
Quanex’s free cash flow clocked in at $66.61 million in Q3, equivalent to a 13.6% margin. Its cash flow turned positive after being negative in the same quarter last year, but we wouldn’t read too much into the short term because investment needs can be seasonal, causing temporary swings. Long-term trends trump fluctuations.
10. Return on Invested Capital (ROIC)
EPS and free cash flow tell us whether a company was profitable while growing its revenue. But was it capital-efficient? Enter ROIC, a metric showing how much operating profit a company generates relative to the money it has raised (debt and equity).
Quanex historically did a mediocre job investing in profitable growth initiatives. Its five-year average ROIC was 8.5%, somewhat low compared to the best industrials companies that consistently pump out 20%+.
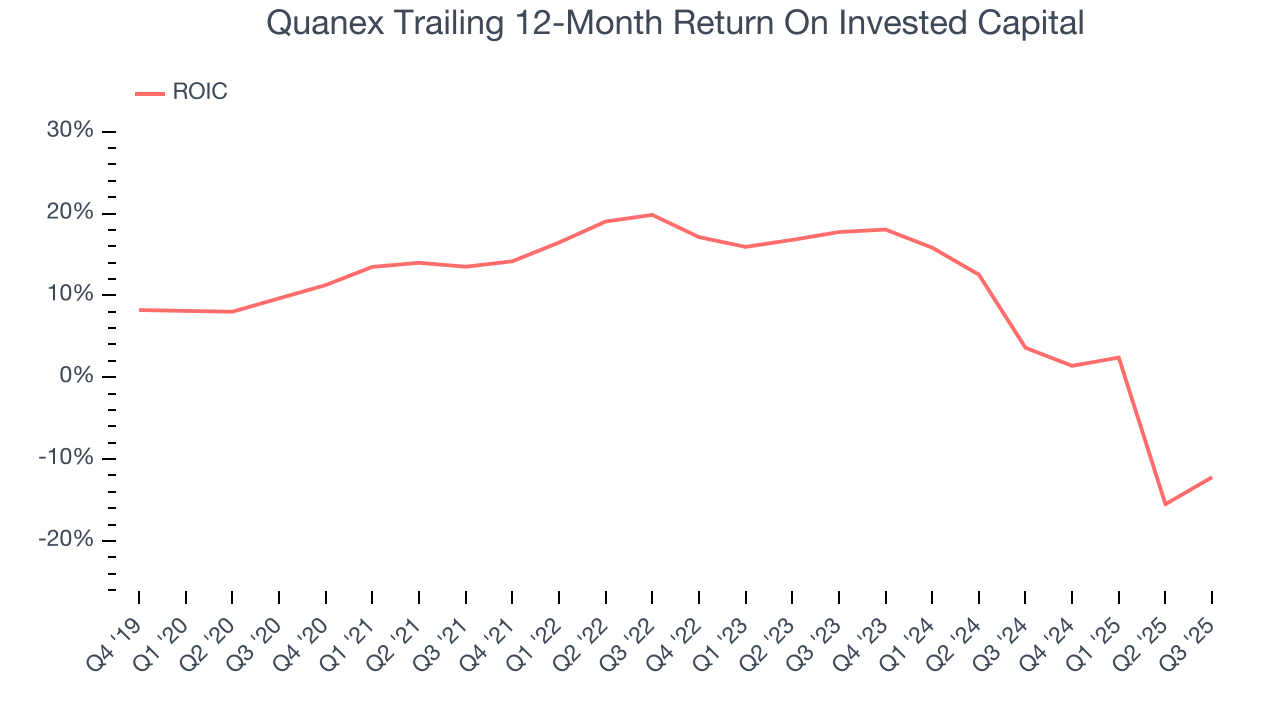
We like to invest in businesses with high returns, but the trend in a company’s ROIC is what often surprises the market and moves the stock price. Over the last few years, Quanex’s ROIC has unfortunately decreased significantly. Paired with its already low returns, these declines suggest its profitable growth opportunities are few and far between.
11. Balance Sheet Assessment
Quanex reported $78.12 million of cash and $853.7 million of debt on its balance sheet in the most recent quarter. As investors in high-quality companies, we primarily focus on two things: 1) that a company’s debt level isn’t too high and 2) that its interest payments are not excessively burdening the business.
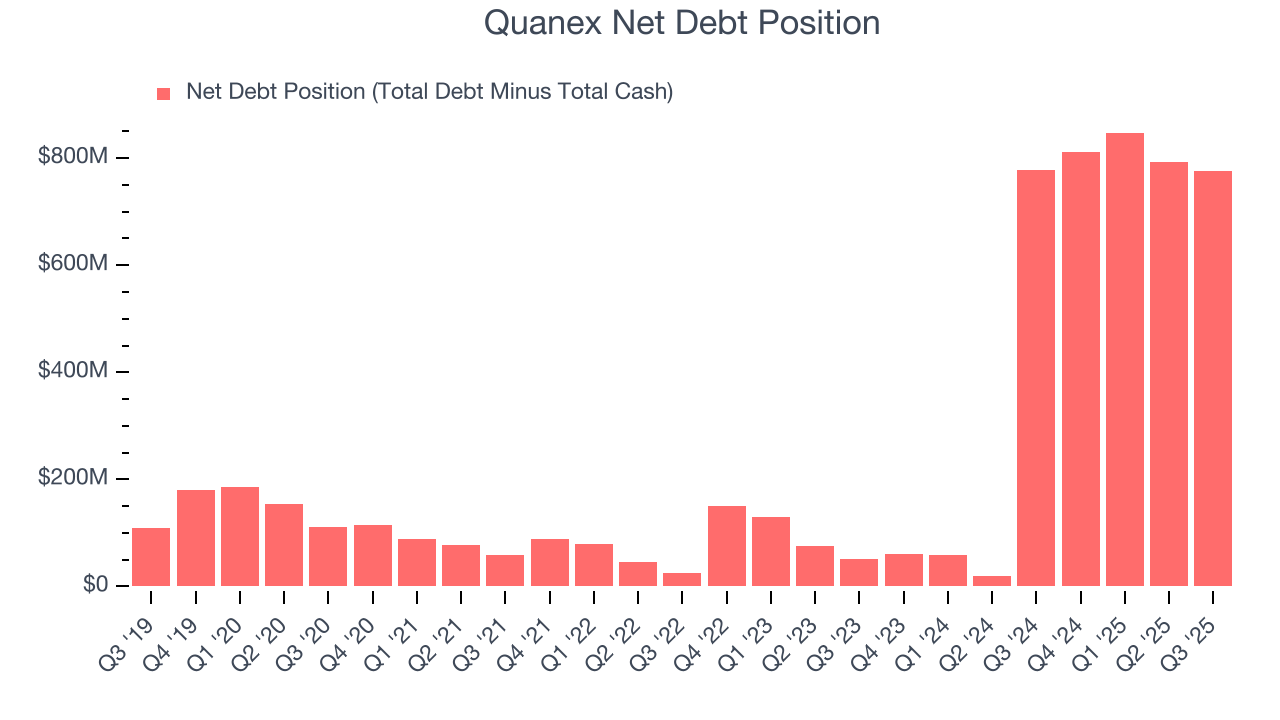
With $241.7 million of EBITDA over the last 12 months, we view Quanex’s 3.2× net-debt-to-EBITDA ratio as safe. We also see its $27.2 million of annual interest expenses as appropriate. The company’s profits give it plenty of breathing room, allowing it to continue investing in growth initiatives.
12. Key Takeaways from Quanex’s Q3 Results
It was good to see Quanex beat analysts’ EPS expectations this quarter. We were also excited its EBITDA outperformed Wall Street’s estimates by a wide margin. The company also added that "While the integration of the Tyman business is substantially complete, we still believe there is a path to realizing approximately $45 million in cost synergies over time, above our initial projection of $30 million, which has been fully realized." Zooming out, we think this was a good print with some key areas of upside. The stock traded up 24.4% to $18.75 immediately after reporting.
13. Is Now The Time To Buy Quanex?
Updated: December 11, 2025 at 10:13 PM EST
Are you wondering whether to buy Quanex or pass? We urge investors to not only consider the latest earnings results but also longer-term business quality and valuation as well.
Quanex isn’t a terrible business, but it doesn’t pass our quality test. Although its revenue growth was exceptional over the last five years, it’s expected to deteriorate over the next 12 months and its diminishing returns show management's prior bets haven't worked out. And while the company’s remarkable EPS growth over the last five years shows its profits are trickling down to shareholders, the downside is its projected EPS for the next year is lacking.
Quanex’s P/E ratio based on the next 12 months is 6.6x. While this valuation is optically cheap, the potential downside is big given its shaky fundamentals. We're pretty confident there are more exciting stocks to buy at the moment.
Wall Street analysts have a consensus one-year price target of $28 on the company (compared to the current share price of $18.69).
Although the price target is bullish, readers should exercise caution because analysts tend to be overly optimistic. The firms they work for, often big banks, have relationships with companies that extend into fundraising, M&A advisory, and other rewarding business lines. As a result, they typically hesitate to say bad things for fear they will lose out. We at StockStory do not suffer from such conflicts of interest, so we’ll always tell it like it is.