
PulteGroup (PHM)
We’re skeptical of PulteGroup. Its poor sales growth and falling returns on capital suggest its growth opportunities are shrinking.― StockStory Analyst Team
1. News


2. Summary
Why We Think PulteGroup Will Underperform
Having delivered over 850,000 homes since its founding in 1950, PulteGroup (NYSE:PHM) is one of America's largest homebuilders, constructing single-family homes, townhouses, and condominiums for first-time, move-up, and active adult buyers across 46 markets in 25 states.
- Estimated sales decline of 4.8% for the next 12 months implies a challenging demand environment
- Backlog has dropped by 18.9% on average over the past two years, suggesting it’s losing orders as competition picks up
- A consolation is that its disciplined cost controls and effective management have materialized in a strong operating margin


PulteGroup fails to meet our quality criteria. We’ve identified better opportunities elsewhere.
Why There Are Better Opportunities Than PulteGroup


PulteGroup is trading at $121.86 per share, or 12x forward P/E. PulteGroup’s valuation may seem like a bargain, especially when stacked up against other industrials companies. We remind you that you often get what you pay for, though.
We’d rather pay up for companies with elite fundamentals than get a bargain on weak ones. Cheap stocks can be value traps, and as their performance deteriorates, they will stay cheap or get even cheaper.
3. PulteGroup (PHM) Research Report: Q4 CY2025 Update
Homebuilding company PulteGroup (NYSE:PHM) reported Q4 CY2025 results exceeding the market’s revenue expectations, but sales fell by 6.3% year on year to $4.61 billion. Its GAAP profit of $2.56 per share was 9.5% below analysts’ consensus estimates.
PulteGroup (PHM) Q4 CY2025 Highlights:
- Revenue: $4.61 billion vs analyst estimates of $4.35 billion (6.3% year-on-year decline, 6% beat)
- EPS (GAAP): $2.56 vs analyst expectations of $2.83 (9.5% miss)
- Operating Margin: 14.2%, down from 23.5% in the same quarter last year
- Free Cash Flow Margin: 16%, up from 11% in the same quarter last year
- Backlog: $5.27 billion at quarter end, down 18.9% year on year
- Market Capitalization: $24.03 billion
Company Overview
Having delivered over 850,000 homes since its founding in 1950, PulteGroup (NYSE:PHM) is one of America's largest homebuilders, constructing single-family homes, townhouses, and condominiums for first-time, move-up, and active adult buyers across 46 markets in 25 states.
PulteGroup operates through several brands including Centex, Pulte Homes, Del Webb, DiVosta Homes, John Wieland Homes and Neighborhoods, and American West, allowing it to target specific homebuyer demographics. The company's process begins with thorough market research to understand customer preferences, followed by land acquisition, development, and construction. Their built-to-order model allows customers to select customized options and upgrades, though they also maintain an inventory of move-in ready homes to compete with existing housing stock.
The company's customer segments include first-time buyers (typically seeking smaller, higher-density, more affordable homes), move-up buyers (prioritizing location and amenities), and active adults (often in age-restricted communities with extensive recreational facilities). Del Webb communities, targeted at the 55+ demographic, feature amenities like athletic facilities and recreational centers that promote an active lifestyle.
Beyond homebuilding, PulteGroup offers financial services through its subsidiary Pulte Mortgage, which provides loan origination, and through other subsidiaries offering title insurance and homeowners insurance agency services. This vertical integration allows the company to control more of the home buying process and align construction timing with customers' financing needs.
4. Home Builders
Traditionally, homebuilders have built competitive advantages with economies of scale that lead to advantaged purchasing and brand recognition among consumers. Aesthetic trends have always been important in the space, but more recently, energy efficiency and conservation are driving innovation. However, these companies are still at the whim of the macro, specifically interest rates that heavily impact new and existing home sales. In fact, homebuilders are one of the most cyclical subsectors within industrials.
PulteGroup competes with other major U.S. homebuilders including D.R. Horton (NYSE:DHI), Lennar Corporation (NYSE:LEN), NVR (NYSE:NVR), and Toll Brothers (NYSE:TOL), as well as numerous regional and local builders across its markets.
5. Revenue Growth
A company’s long-term sales performance can indicate its overall quality. Any business can put up a good quarter or two, but many enduring ones grow for years. Luckily, PulteGroup’s sales grew at a solid 9.8% compounded annual growth rate over the last five years. Its growth beat the average industrials company and shows its offerings resonate with customers.
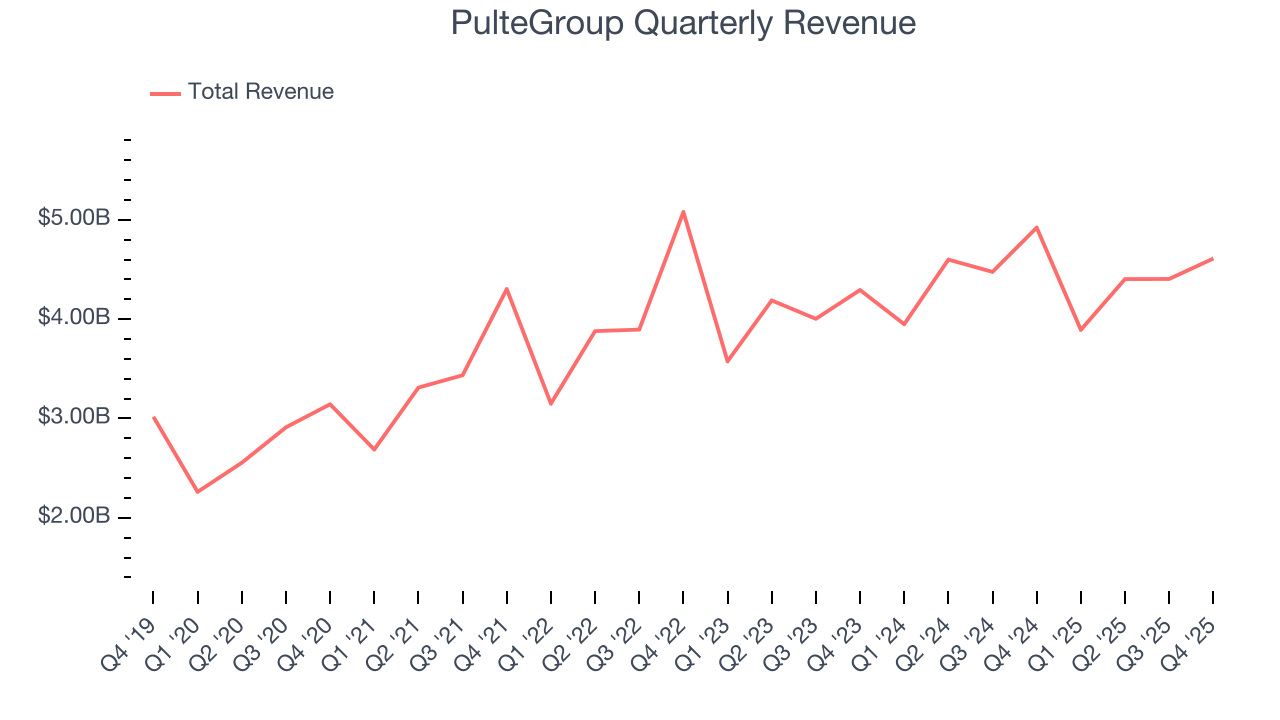
Long-term growth is the most important, but within industrials, a half-decade historical view may miss new industry trends or demand cycles. PulteGroup’s recent performance shows its demand has slowed as its annualized revenue growth of 3.8% over the last two years was below its five-year trend. 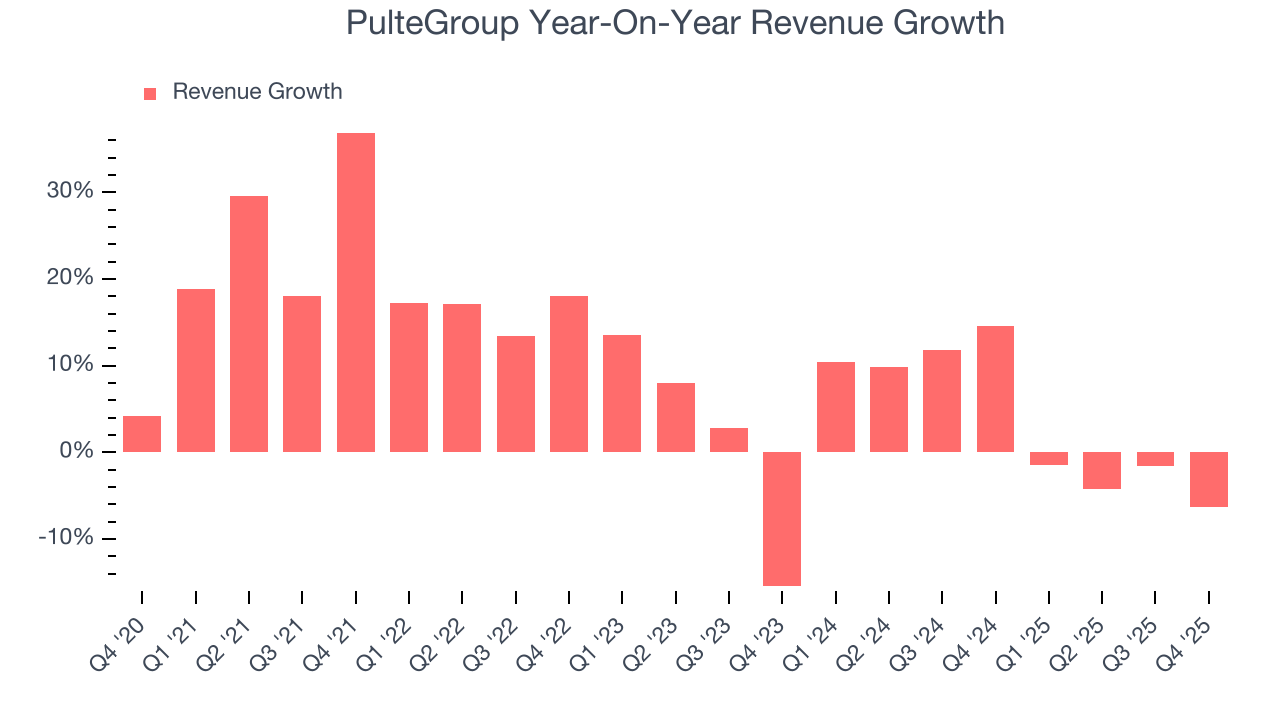
We can better understand the company’s revenue dynamics by analyzing its backlog, or the value of its outstanding orders that have not yet been executed or delivered. PulteGroup’s backlog reached $5.27 billion in the latest quarter and averaged 10% year-on-year declines over the last two years. Because this number is lower than its revenue growth, we can see the company hasn’t secured enough new orders to maintain its growth rate in the future. 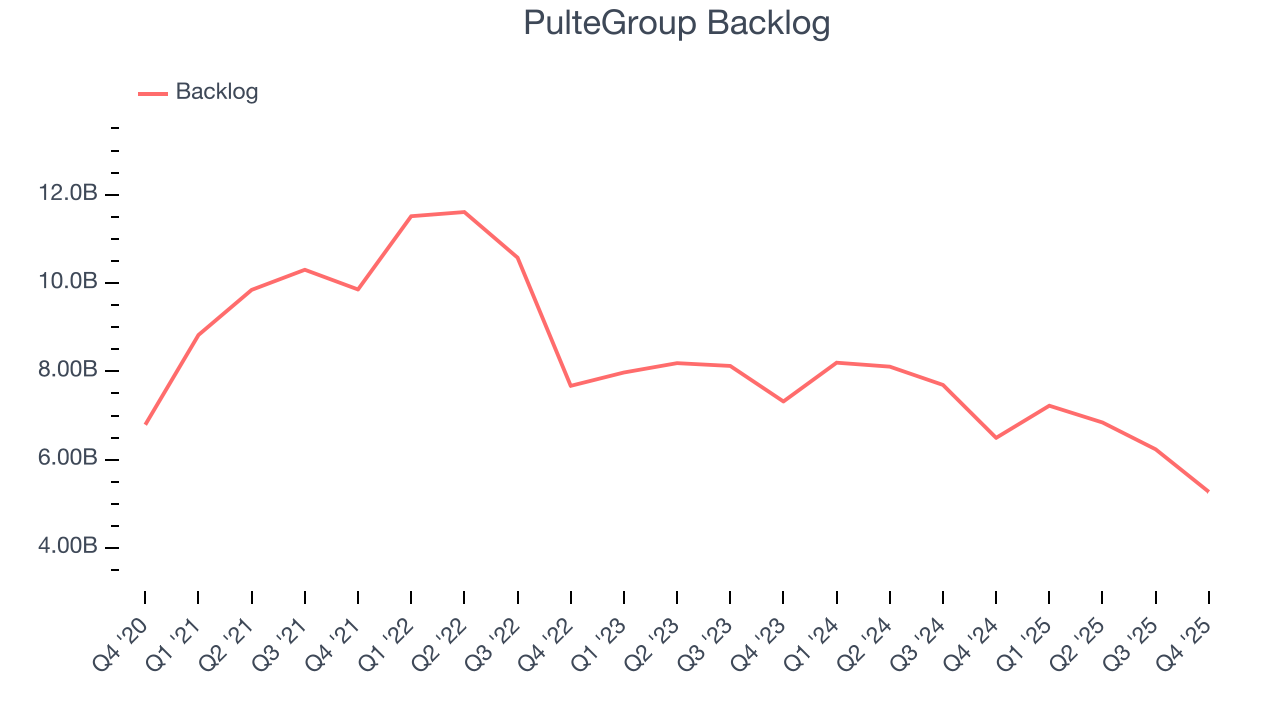
This quarter, PulteGroup’s revenue fell by 6.3% year on year to $4.61 billion but beat Wall Street’s estimates by 6%.
Looking ahead, sell-side analysts expect revenue to decline by 4.6% over the next 12 months, a deceleration versus the last two years. This projection is underwhelming and implies its products and services will face some demand challenges.
6. Gross Margin & Pricing Power
PulteGroup’s gross margin is slightly below the average industrials company, giving it less room to invest in areas such as research and development. As you can see below, it averaged a 28.4% gross margin over the last five years. Said differently, PulteGroup had to pay a chunky $71.63 to its suppliers for every $100 in revenue. 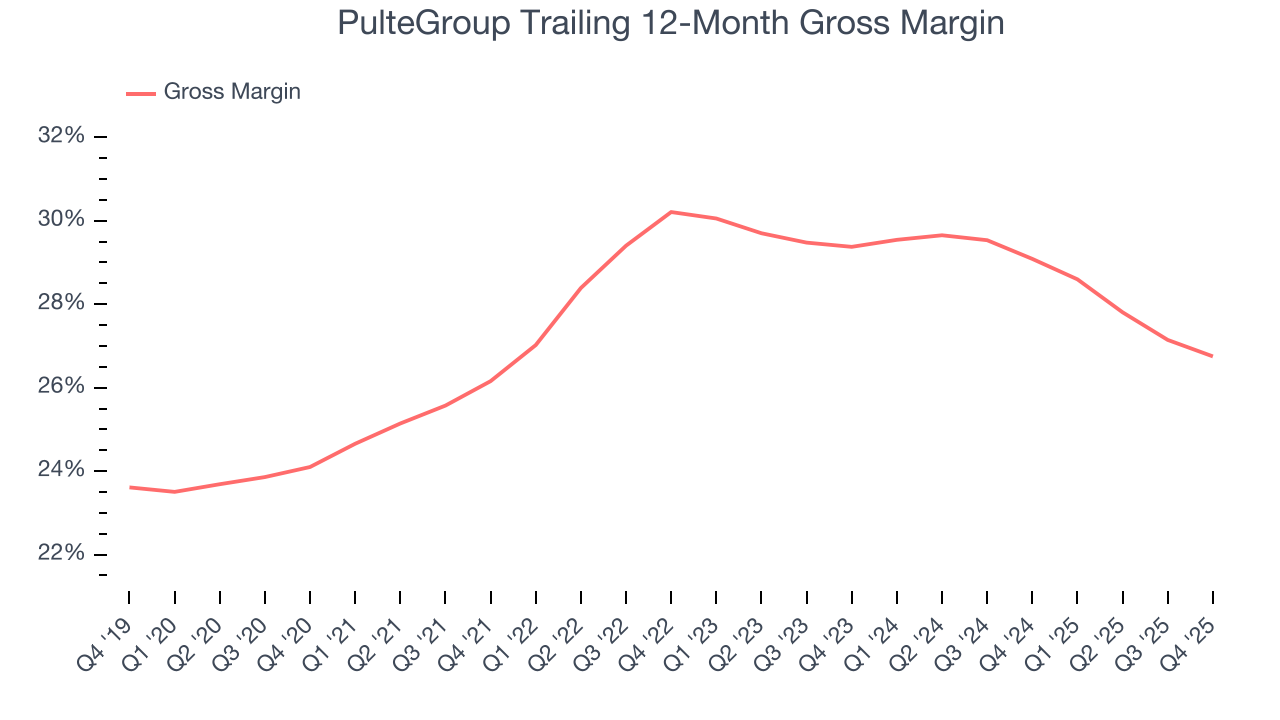
This quarter, PulteGroup’s gross profit margin was 26%, marking a 1.5 percentage point decrease from 27.5% in the same quarter last year. PulteGroup’s full-year margin has also been trending down over the past 12 months, decreasing by 2.3 percentage points. If this move continues, it could suggest a more competitive environment with some pressure to lower prices and higher input costs (such as raw materials and manufacturing expenses).
7. Operating Margin
PulteGroup has been a well-oiled machine over the last five years. It demonstrated elite profitability for an industrials business, boasting an average operating margin of 20%. This result was particularly impressive because of its low gross margin, which is mostly a factor of what it sells and takes huge shifts to move meaningfully. Companies have more control over their operating margins, and it’s a show of well-managed operations if they’re high when gross margins are low.
Looking at the trend in its profitability, PulteGroup’s operating margin decreased by 2 percentage points over the last five years. This raises questions about the company’s expense base because its revenue growth should have given it leverage on its fixed costs, resulting in better economies of scale and profitability.
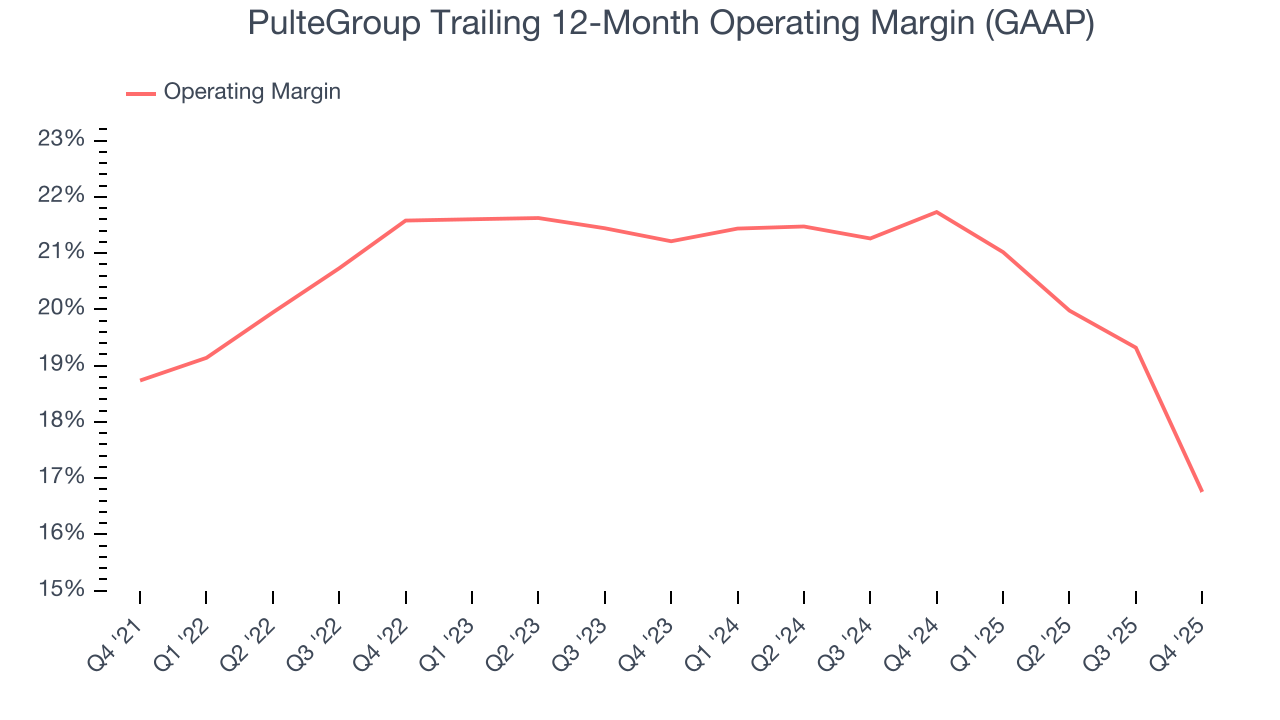
In Q4, PulteGroup generated an operating margin profit margin of 14.2%, down 9.3 percentage points year on year. Since PulteGroup’s operating margin decreased more than its gross margin, we can assume it was less efficient because expenses such as marketing, R&D, and administrative overhead increased.
8. Earnings Per Share
Revenue trends explain a company’s historical growth, but the long-term change in earnings per share (EPS) points to the profitability of that growth – for example, a company could inflate its sales through excessive spending on advertising and promotions.
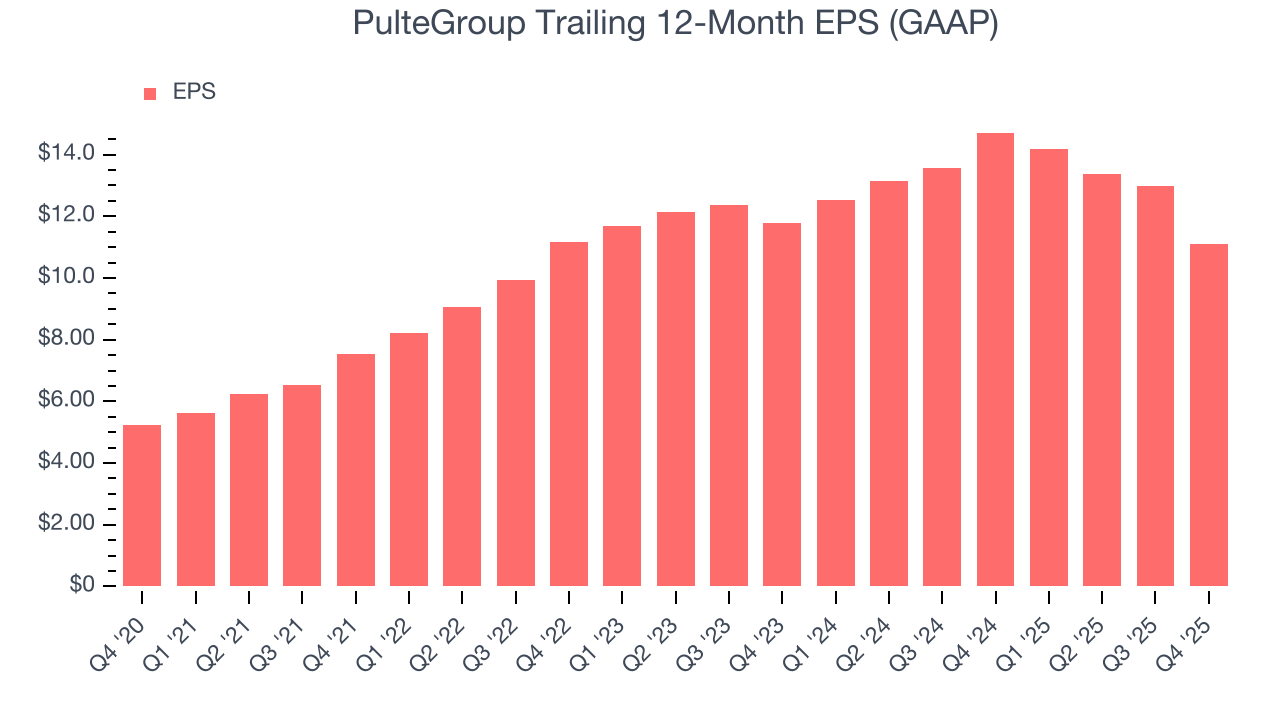
PulteGroup’s EPS grew at a spectacular 16.3% compounded annual growth rate over the last five years, higher than its 9.8% annualized revenue growth. However, this alone doesn’t tell us much about its business quality because its operating margin didn’t improve.
We can take a deeper look into PulteGroup’s earnings quality to better understand the drivers of its performance. A five-year view shows that PulteGroup has repurchased its stock, shrinking its share count by 27%. This tells us its EPS outperformed its revenue not because of increased operational efficiency but financial engineering, as buybacks boost per share earnings. 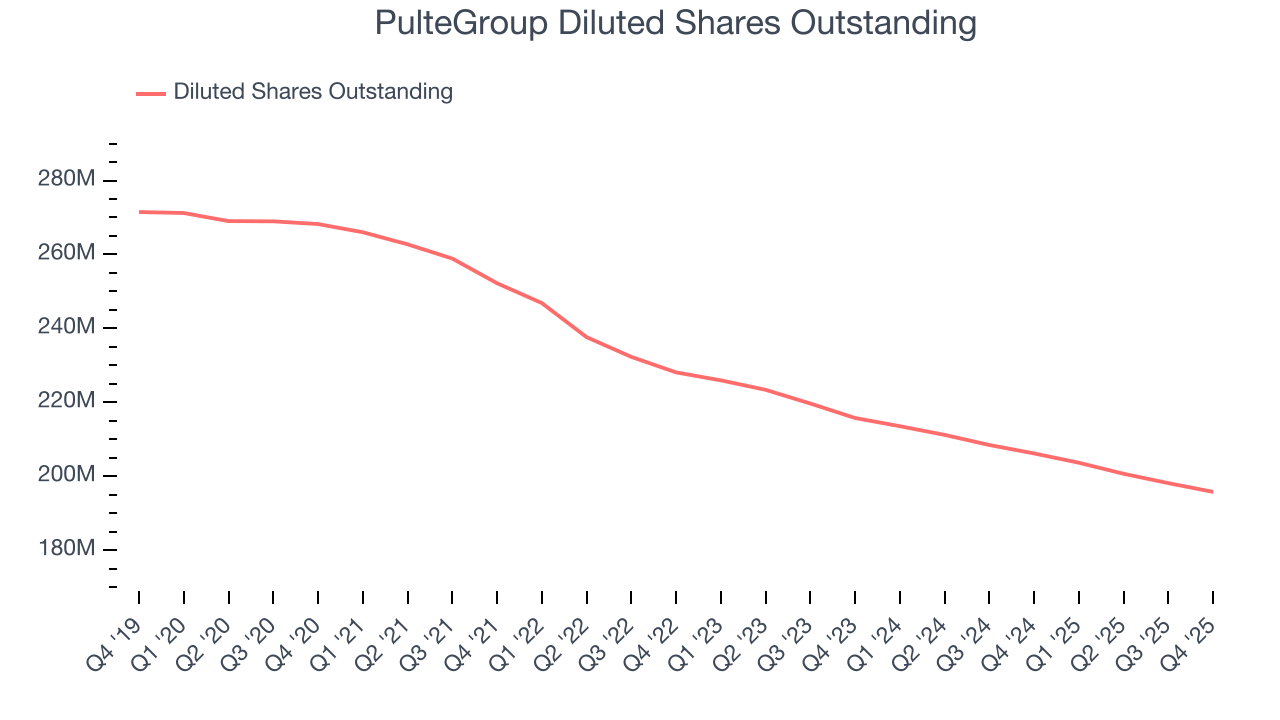
Like with revenue, we analyze EPS over a more recent period because it can provide insight into an emerging theme or development for the business.
For PulteGroup, its two-year annual EPS declines of 2.9% mark a reversal from its (seemingly) healthy five-year trend. We hope PulteGroup can return to earnings growth in the future.
In Q4, PulteGroup reported EPS of $2.56, down from $4.43 in the same quarter last year. This print missed analysts’ estimates, but we care more about long-term EPS growth than short-term movements. Over the next 12 months, Wall Street expects PulteGroup’s full-year EPS of $11.12 to shrink by 4.6%.
9. Cash Is King
Free cash flow isn't a prominently featured metric in company financials and earnings releases, but we think it's telling because it accounts for all operating and capital expenses, making it tough to manipulate. Cash is king.
PulteGroup has shown impressive cash profitability, enabling it to ride out cyclical downturns more easily while maintaining its investments in new and existing offerings. The company’s free cash flow margin averaged 8.5% over the last five years, better than the broader industrials sector.
Taking a step back, we can see that PulteGroup’s margin expanded by 3.3 percentage points during that time. This shows the company is heading in the right direction, and we can see it became a less capital-intensive business because its free cash flow profitability rose while its operating profitability fell.
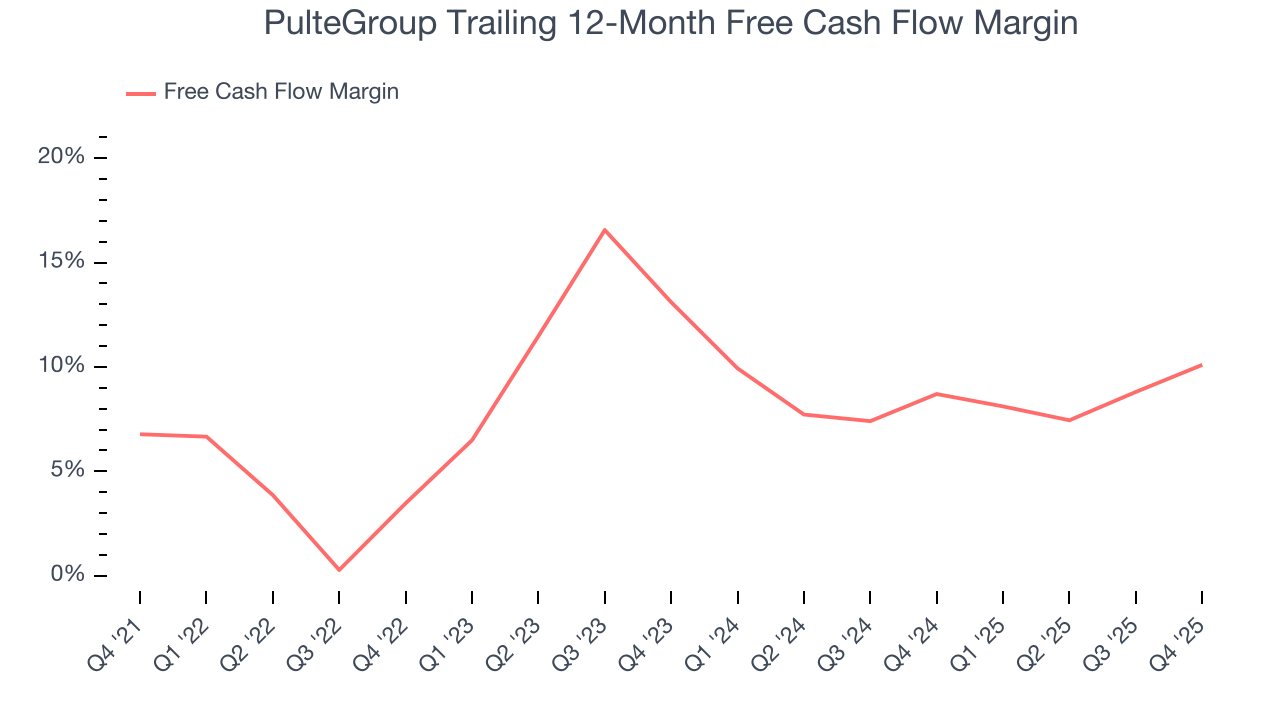
PulteGroup’s free cash flow clocked in at $739.8 million in Q4, equivalent to a 16% margin. This result was good as its margin was 5 percentage points higher than in the same quarter last year, building on its favorable historical trend.
10. Return on Invested Capital (ROIC)
EPS and free cash flow tell us whether a company was profitable while growing its revenue. But was it capital-efficient? Enter ROIC, a metric showing how much operating profit a company generates relative to the money it has raised (debt and equity).
Although PulteGroup hasn’t been the highest-quality company lately, it found a few growth initiatives in the past that worked out wonderfully. Its five-year average ROIC was 25.2%, splendid for an industrials business.
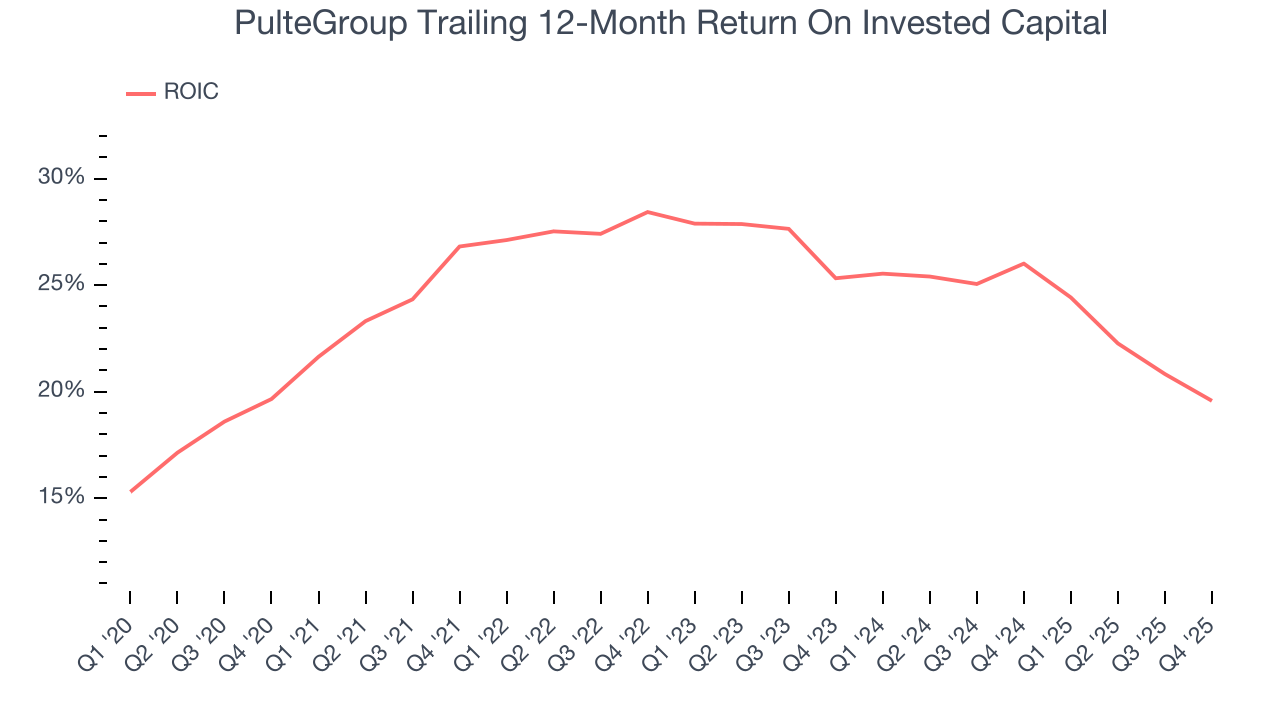
We like to invest in businesses with high returns, but the trend in a company’s ROIC is what often surprises the market and moves the stock price. Unfortunately, PulteGroup’s ROIC averaged 4.8 percentage point decreases over the last few years. We like what management has done in the past, but its declining returns are perhaps a symptom of fewer profitable growth opportunities.
11. Balance Sheet Assessment
PulteGroup reported $2.01 billion of cash and $2.16 billion of debt on its balance sheet in the most recent quarter. As investors in high-quality companies, we primarily focus on two things: 1) that a company’s debt level isn’t too high and 2) that its interest payments are not excessively burdening the business.
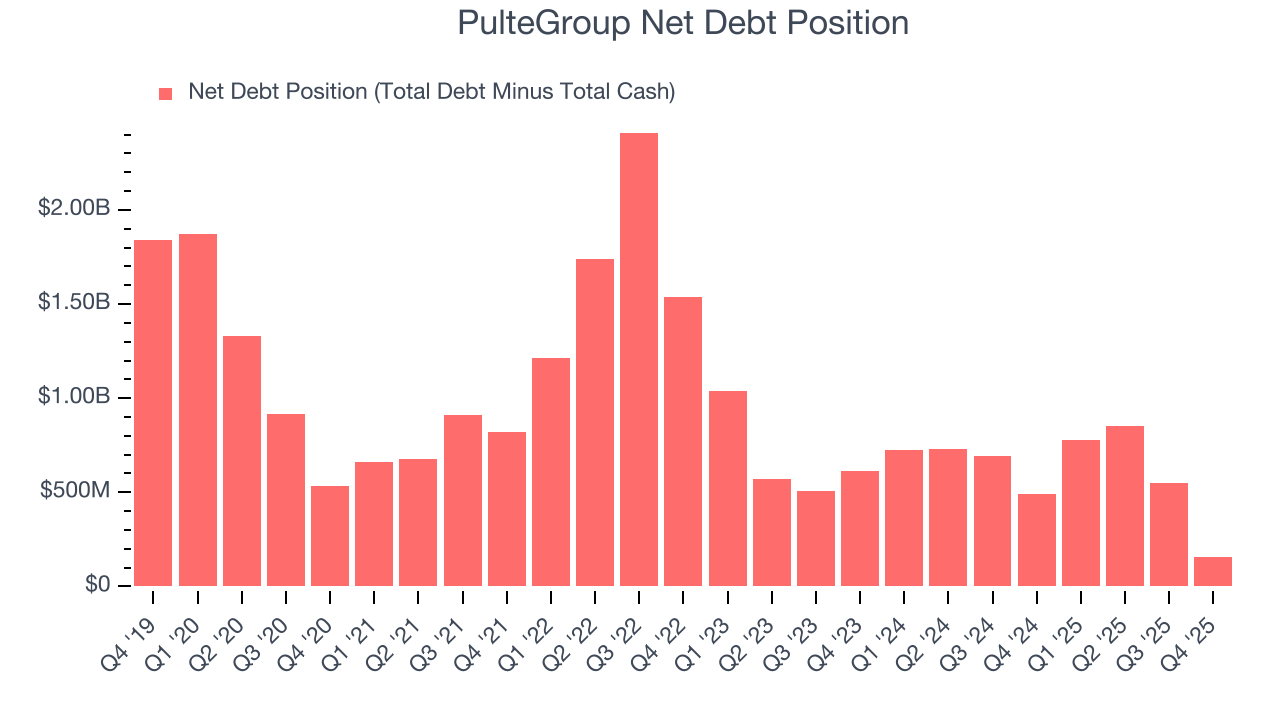
With $3.09 billion of EBITDA over the last 12 months, we view PulteGroup’s 0.1× net-debt-to-EBITDA ratio as safe. We also see its $27.2 million of annual interest expenses as appropriate. The company’s profits give it plenty of breathing room, allowing it to continue investing in growth initiatives.
12. Key Takeaways from PulteGroup’s Q4 Results
We were impressed by how significantly PulteGroup blew past analysts’ revenue expectations this quarter. On the other hand, its EPS missed and its backlog fell slightly short of Wall Street’s estimates. Overall, this was a softer quarter. The stock remained flat at $123.50 immediately after reporting.
13. Is Now The Time To Buy PulteGroup?
Updated: March 18, 2026 at 1:01 AM EDT
When considering an investment in PulteGroup, investors should account for its valuation and business qualities as well as what’s happened in the latest quarter.
PulteGroup’s business quality ultimately falls short of our standards. Although its revenue growth was solid over the last five years, it’s expected to deteriorate over the next 12 months and its diminishing returns show management's prior bets haven't worked out. And while the company’s impressive operating margins show it has a highly efficient business model, the downside is its projected EPS for the next year is lacking.
PulteGroup’s P/E ratio based on the next 12 months is 12x. While this valuation is reasonable, we don’t really see a big opportunity at the moment. We're fairly confident there are better stocks to buy right now.
Wall Street analysts have a consensus one-year price target of $143.43 on the company (compared to the current share price of $121.86).
Although the price target is bullish, readers should exercise caution because analysts tend to be overly optimistic. The firms they work for, often big banks, have relationships with companies that extend into fundraising, M&A advisory, and other rewarding business lines. As a result, they typically hesitate to say bad things for fear they will lose out. We at StockStory do not suffer from such conflicts of interest, so we’ll always tell it like it is.