
Prudential (PRU)
Prudential is up against the odds. Not only are its sales cratering but also its low returns on capital suggest it struggles to generate profits.― StockStory Analyst Team
1. News


2. Summary
Why We Think Prudential Will Underperform
Recognized by its iconic Rock of Gibraltar logo symbolizing strength and stability since 1896, Prudential Financial (NYSE:PRU) provides life insurance, annuities, retirement solutions, investment management, and other financial services to individual and institutional customers globally.
- Products and services are facing end-market challenges during this cycle, as seen in its flat sales over the last five years
- Insurance policy sales contracted this cycle as net premiums earned decreased by 3.1% annually over the last five years


Prudential’s quality isn’t great. There’s a wealth of better opportunities.
Why There Are Better Opportunities Than Prudential


Prudential is trading at $108.44 per share, or 1.2x forward P/B. This multiple is lower than most insurance companies, but for good reason.
We’d rather pay up for companies with elite fundamentals than get a bargain on weak ones. Cheap stocks can be value traps, and as their performance deteriorates, they will stay cheap or get even cheaper.
3. Prudential (PRU) Research Report: Q3 CY2025 Update
Financial services giant Prudential Financial (NYSE:PRU) reported Q3 CY2025 results topping the market’s revenue expectations, but sales fell by 16.7% year on year to $16.24 billion. Its non-GAAP profit of $4.26 per share was 14.5% above analysts’ consensus estimates.
Prudential (PRU) Q3 CY2025 Highlights:
- Net Premiums Earned: $8.69 billion vs analyst estimates of $6.73 billion (38.6% year-on-year decline, 29.2% beat)
- Revenue: $16.24 billion vs analyst estimates of $14.19 billion (16.7% year-on-year decline, 14.4% beat)
- Pre-tax Profit: $1.78 billion (11% margin, 202% year-on-year growth)
- Adjusted EPS: $4.26 vs analyst estimates of $3.72 (14.5% beat)
- Book Value per Share: $90.69 vs analyst estimates of $98.89 (6.1% year-on-year growth, 8.3% miss)
- Market Capitalization: $35.7 billion
Company Overview
Recognized by its iconic Rock of Gibraltar logo symbolizing strength and stability since 1896, Prudential Financial (NYSE:PRU) provides life insurance, annuities, retirement solutions, investment management, and other financial services to individual and institutional customers globally.
Prudential operates through several key business segments that serve different markets and customer needs. Its PGIM division is a major global investment manager offering solutions across public fixed income, public equity, real estate, private credit, and other asset classes to institutional and retail clients. The U.S. Businesses segment includes Retirement Strategies, which provides both institutional retirement products like pension risk transfer solutions and individual annuities; Group Insurance, offering life, disability, and absence management services to employers; and Individual Life, which sells various life insurance products to protect families and businesses.
The company's International Businesses segment operates primarily in Japan, with additional presence in Brazil, Mexico, and other countries through joint ventures and strategic investments. This segment sells life insurance, retirement products, and investment solutions through proprietary distribution channels like Life Planners and Life Consultants, as well as through banks and independent agencies.
Prudential generates revenue through insurance premiums, investment income, asset management fees, and spreads between what it earns on investments and what it credits to policyholders. For example, a corporate client might purchase a pension risk transfer solution where Prudential assumes all investment and longevity risks for the company's retirees in exchange for a premium, while an individual might buy a variable annuity that provides both investment opportunities and guaranteed lifetime income.
The company's business model benefits from long-term demographic trends, including aging populations seeking retirement security and growing wealth in international markets. Prudential's operations are subject to comprehensive regulation by state insurance departments in the U.S. and by financial regulators in international markets where it operates.
4. Life Insurance
Life insurance companies collect premiums from policyholders in exchange for providing a future death benefit or retirement income stream. Interest rates matter for the sector (and make it cyclical), with higher rates allowing insurers to reinvest their fixed-income portfolios at more attractive yields and vice versa. Additionally, favorable demographic shifts, such as an aging population, are driving strong demand for retirement products while AI and data analytics offer significant opportunities to improve underwriting accuracy and operational efficiency. Conversely, the industry faces headwinds from persistent competition from agile insurtechs that threaten traditional distribution models.
Prudential Financial's competitors include other large diversified financial services companies such as MetLife (NYSE:MET), Lincoln National (NYSE:LNC), and Principal Financial Group (NASDAQ:PFG) in the U.S. market. In the asset management space, PGIM competes with firms like BlackRock (NYSE:BLK) and T. Rowe Price (NASDAQ:TROW), while internationally, Prudential faces competition from AIA Group in Asia and local providers in each market.
5. Revenue Growth
Insurers earn revenue three ways. The core insurance business itself, often called underwriting and represented in the income statement as premiums earned, is one way. Investment income from investing the “float” (premiums collected upfront not yet paid out as claims) in assets such as fixed-income assets and equities is the second way. Fees from various sources such as policy administration, annuities, or other value-added services is the third. Unfortunately, Prudential struggled to consistently increase demand as its $56.17 billion of revenue for the trailing 12 months was close to its revenue five years ago. This was below our standards and is a sign of poor business quality.
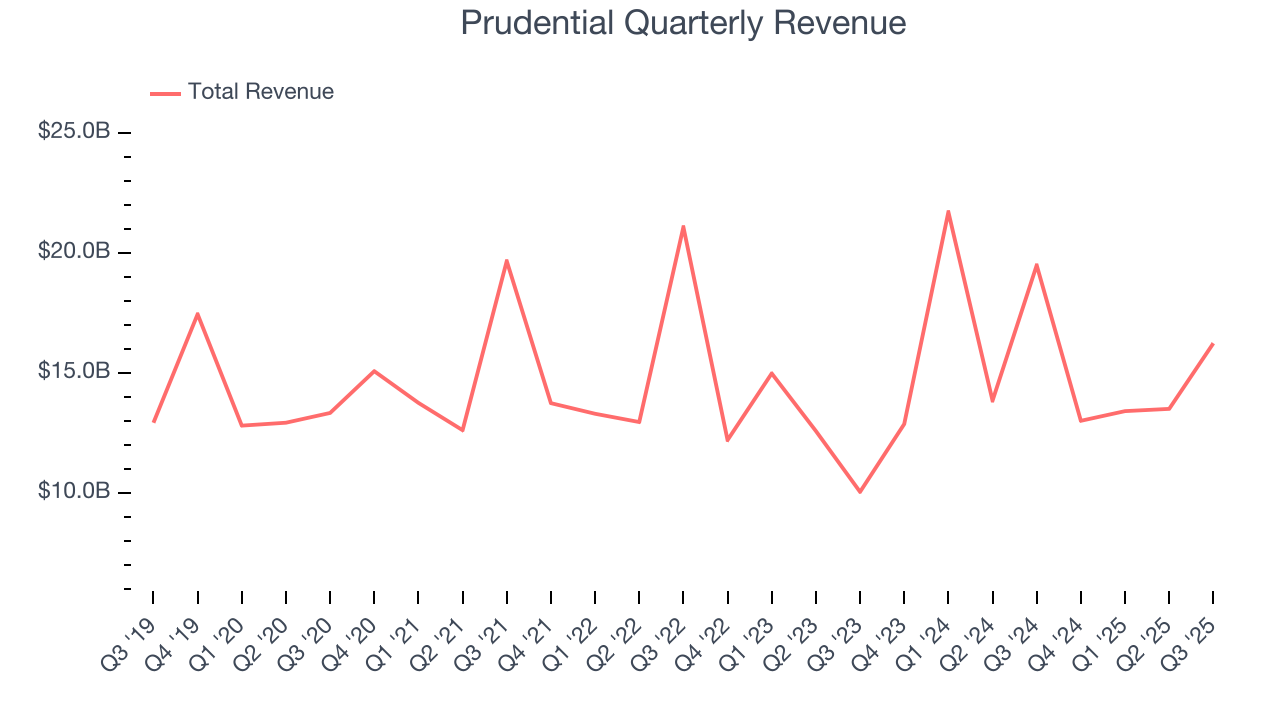
Long-term growth is the most important, but within financials, a half-decade historical view may miss recent interest rate changes and market returns. Prudential’s annualized revenue growth of 6.2% over the last two years is above its five-year trend, but we were still disappointed by the results. 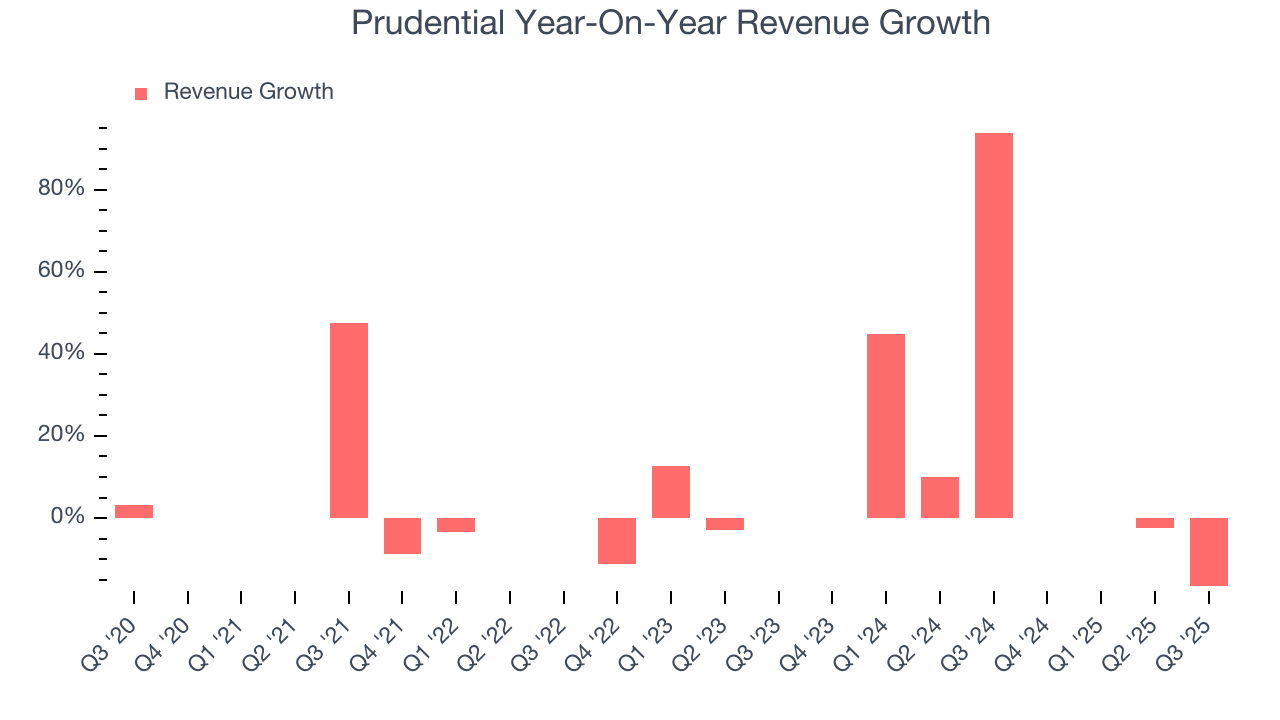 Note: Quarters not shown were determined to be outliers, impacted by outsized investment gains/losses that are not indicative of the recurring fundamentals of the business.
This quarter, Prudential’s revenue fell by 16.7% year on year to $16.24 billion but beat Wall Street’s estimates by 14.4%.
Net premiums earned made up 66.2% of the company’s total revenue during the last five years, meaning insurance operations are Prudential’s largest source of revenue.
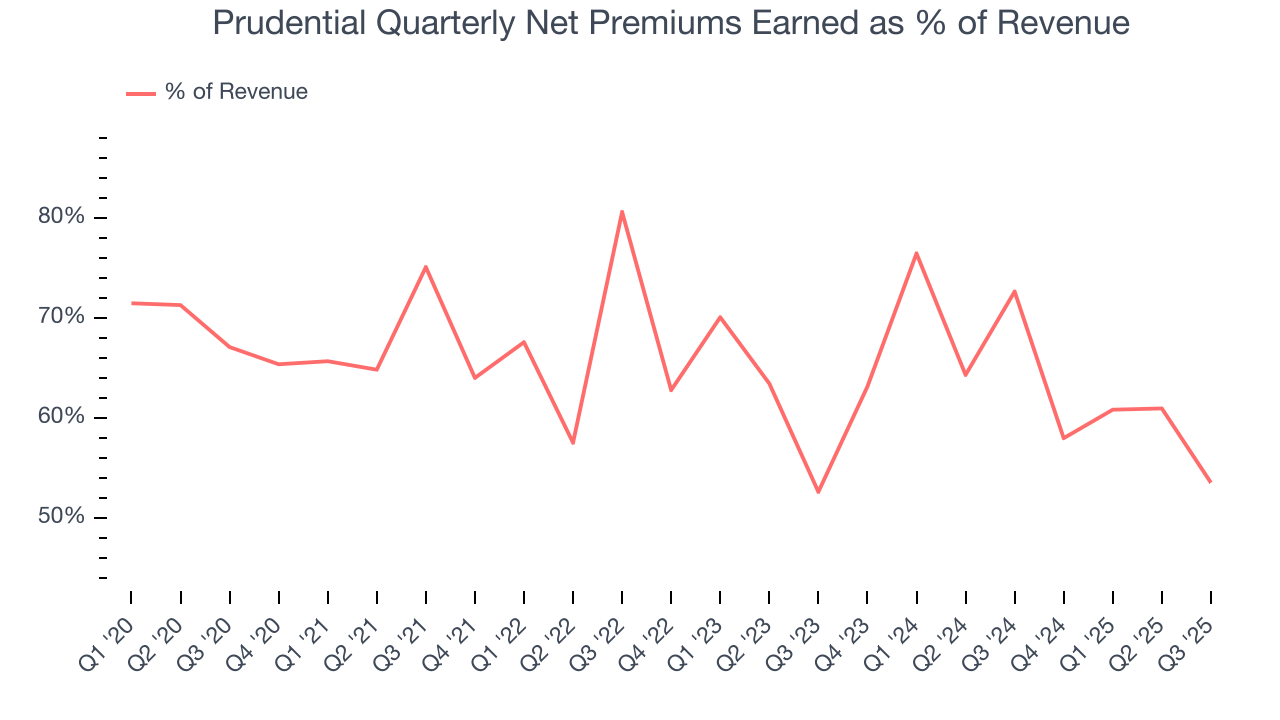
Net premiums earned commands greater market attention due to its reliability and consistency, whereas investment and fee income are often seen as more volatile revenue streams that fluctuate with market conditions.
6. Net Premiums Earned
When insurers sell policies, they protect themselves from extremely large losses or an outsized accumulation of losses with reinsurance (insurance for insurance companies). Net premiums earned are therefore gross premiums less what’s ceded to reinsurers as a risk mitigation and transfer strategy.
Prudential’s net premiums earned has declined by 1.7% annually over the last five years, much worse than the broader insurance industry. This shows that policy underwriting underperformed its other business lines.
When analyzing Prudential’s net premiums earned over the last two years, we can see that growth accelerated to 1.9% annually. Since two-year net premiums earned grew slower than total revenue over this period, it’s implied that other line items such as investment income grew at a faster rate. These additional streams do play a key role in the bottom line, but their impact can vary. While some firms have excelled in consistently investing their float, sudden shifts in the fixed income and equity markets can heavily sway short-term performance.
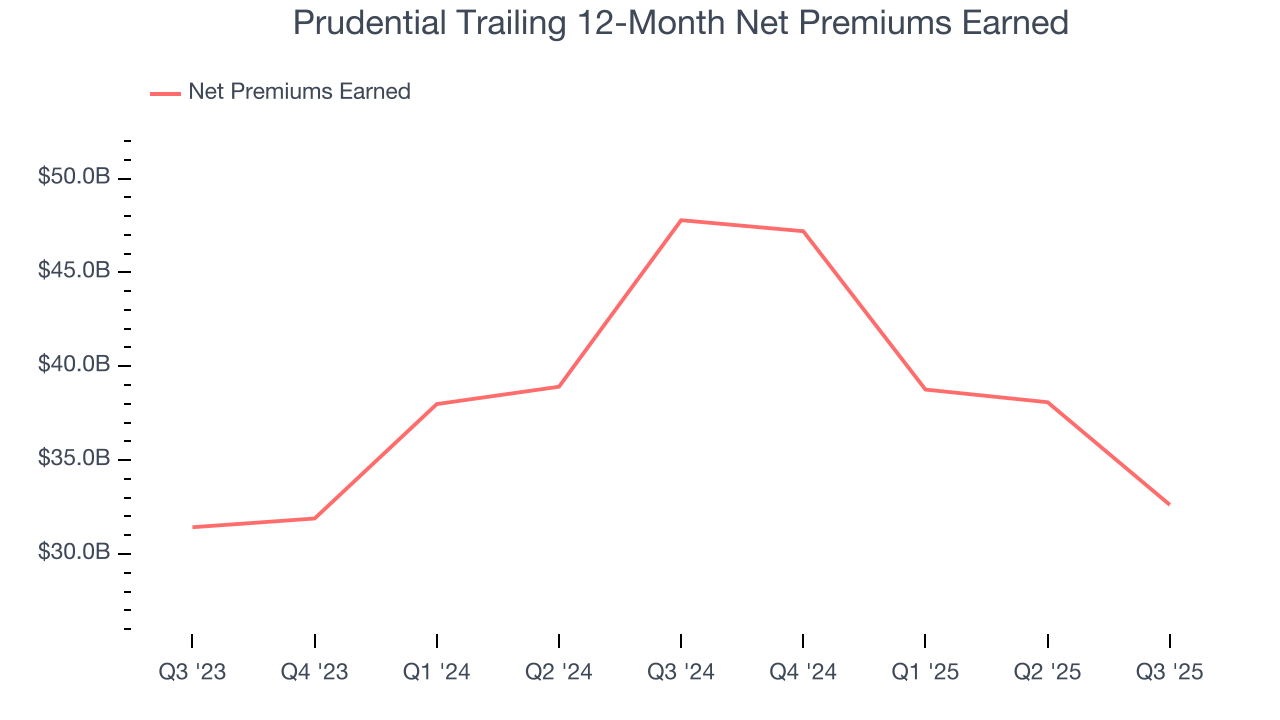
Prudential’s net premiums earned came in at $8.69 billion this quarter, down 38.6% year on year. But this was still enough to top Wall Street Consensus estimates by 29.2%.
7. Pre-Tax Profit Margin
Revenue growth is one major determinant of business quality, and the efficiency of operations is another. For insurance companies, we look at pre-tax profit rather than the operating margin that defines sectors such as consumer, tech, and industrials.
The economics of insurers are driven by their balance sheets, where assets (investing the float + premiums receivable) and liabilities (claims to pay) define the fundamentals. Interest income and expense should therefore be factored into the definition of profit but taxes - which are largely out of a company’s control - should not.
Over the last four years, Prudential’s pre-tax profit margin has risen by 8.7 percentage points, going from 14.7% to 6%. Luckily, it seems the company has recently taken steps to address its expense base as its pre-tax profit margin expanded by 3.2 percentage points on a two-year basis.
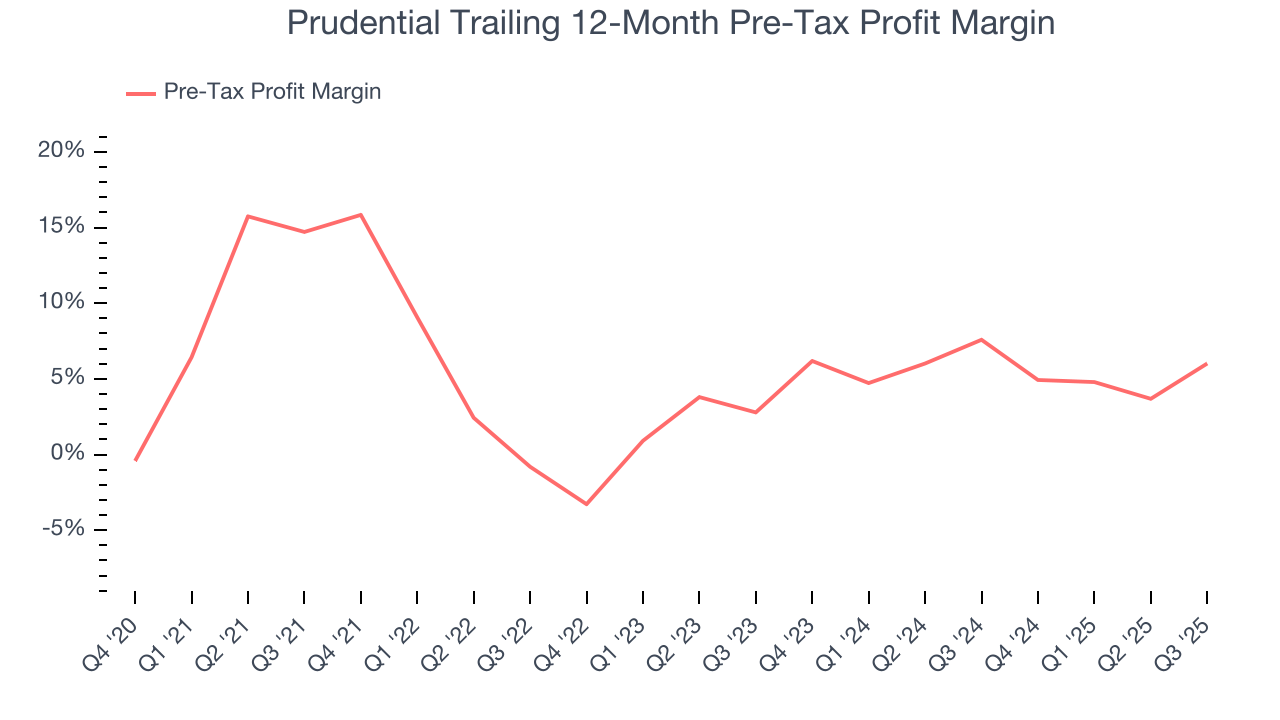
Prudential’s pre-tax profit margin came in at 11% this quarter. This result was 7.9 percentage points better than the same quarter last year.
8. Earnings Per Share
We track the long-term change in earnings per share (EPS) for the same reason as long-term revenue growth. Compared to revenue, however, EPS highlights whether a company’s growth is profitable.
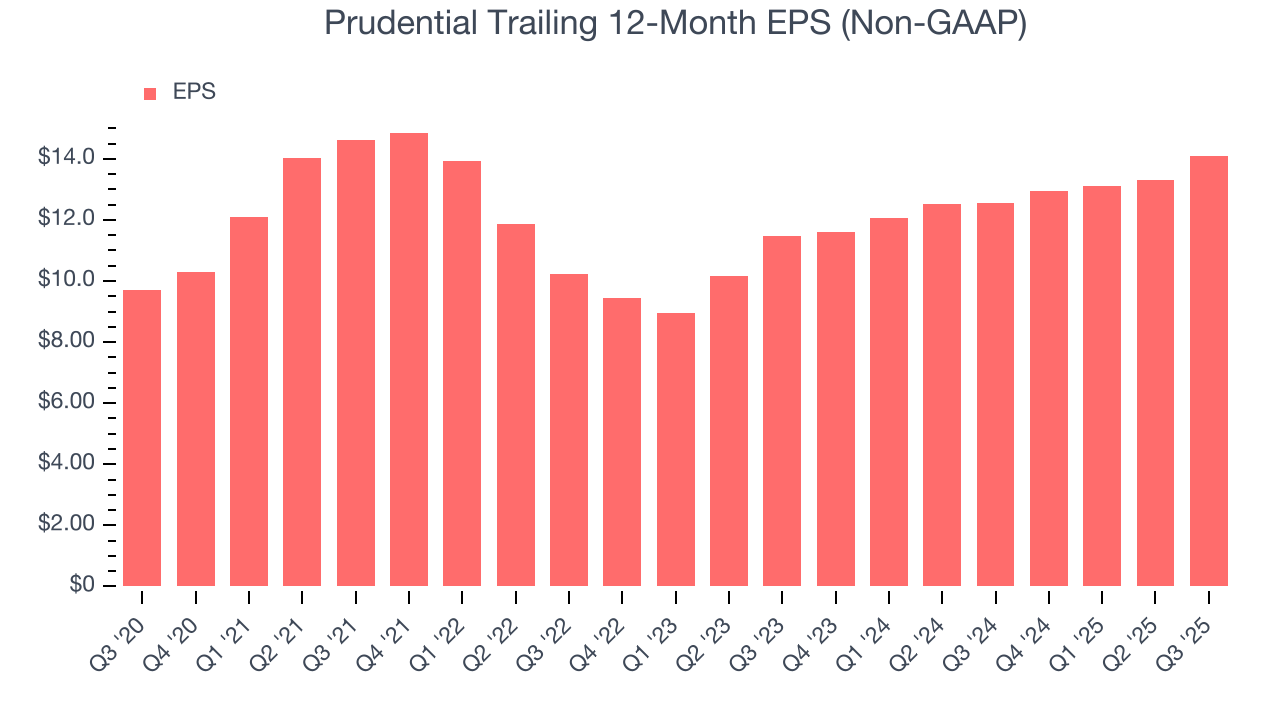
Prudential’s EPS grew at an unimpressive 7.7% compounded annual growth rate over the last five years. This performance was better than its flat revenue but doesn’t tell us much about its business quality because its pre-tax profit margin didn’t improve.
Like with revenue, we analyze EPS over a more recent period because it can provide insight into an emerging theme or development for the business.
For Prudential, its two-year annual EPS growth of 10.9% was higher than its five-year trend. Accelerating earnings growth is almost always an encouraging data point.
In Q3, Prudential reported adjusted EPS of $4.26, up from $3.48 in the same quarter last year. This print easily cleared analysts’ estimates, and shareholders should be content with the results. Over the next 12 months, Wall Street expects Prudential’s full-year EPS of $14.09 to grow 3.1%.
9. Book Value Per Share (BVPS)
Insurance companies are balance sheet businesses, collecting premiums upfront and paying out claims over time. The float–premiums collected but not yet paid out–are invested, creating an asset base supported by a liability structure. Book value per share (BVPS) captures this dynamic by measuring these assets (investment portfolio, cash, reinsurance recoverables) less liabilities (claim reserves, debt, future policy benefits). BVPS is essentially the residual value for shareholders.
We therefore consider BVPS very important to track for insurers and a metric that sheds light on business quality because it reflects long-term capital growth and is harder to manipulate than more commonly-used metrics like EPS.
Prudential’s BVPS declined at a 11.5% annual clip over the last five years. However, BVPS growth has accelerated recently, growing by 12.7% annually over the last two years from $71.44 to $90.69 per share.
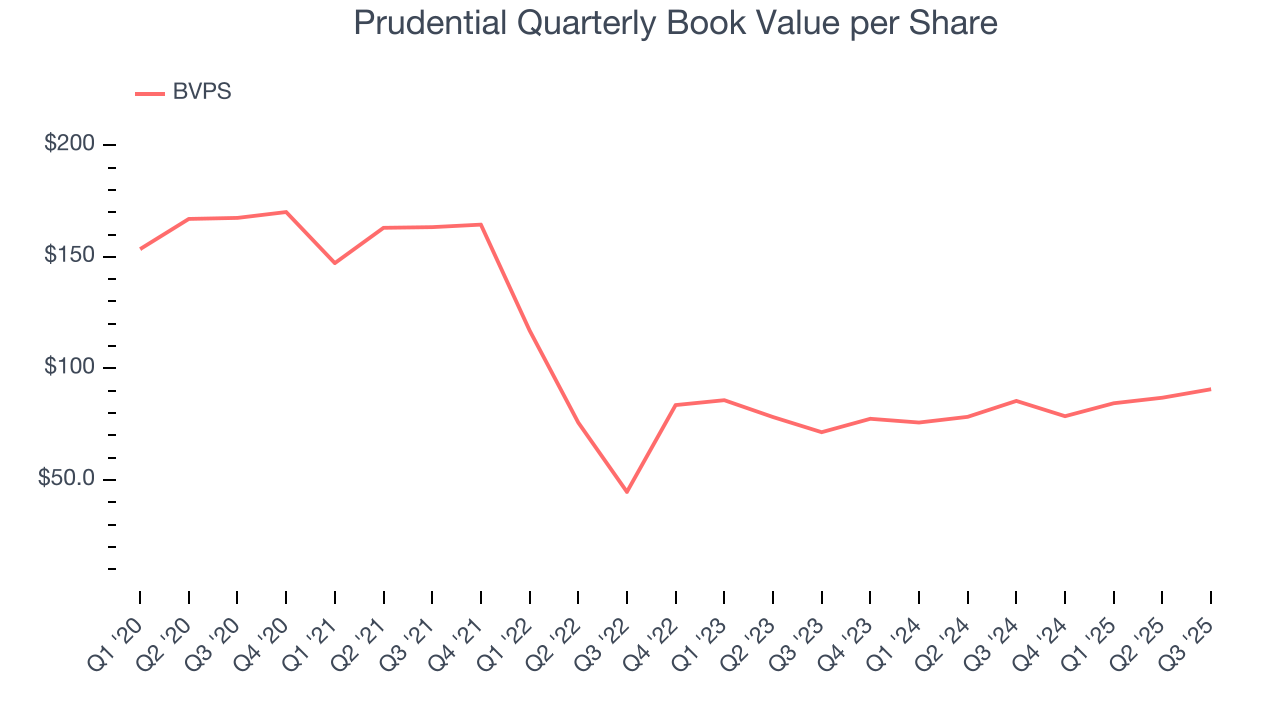
Over the next 12 months, Consensus estimates call for Prudential’s BVPS to grow by 16.6% to $98.89, top-notch growth rate.
10. Balance Sheet Risk
The debt-to-equity ratio is a widely used measure to assess a company's balance sheet health. A higher ratio means that a business aggressively financed its growth with debt. This can result in higher earnings (if the borrowed funds are invested profitably) but also increases risk.
If debt levels are too high, there could be difficulties in meeting obligations, especially during economic downturns or periods of rising interest rates if the debt has variable-rate payments.
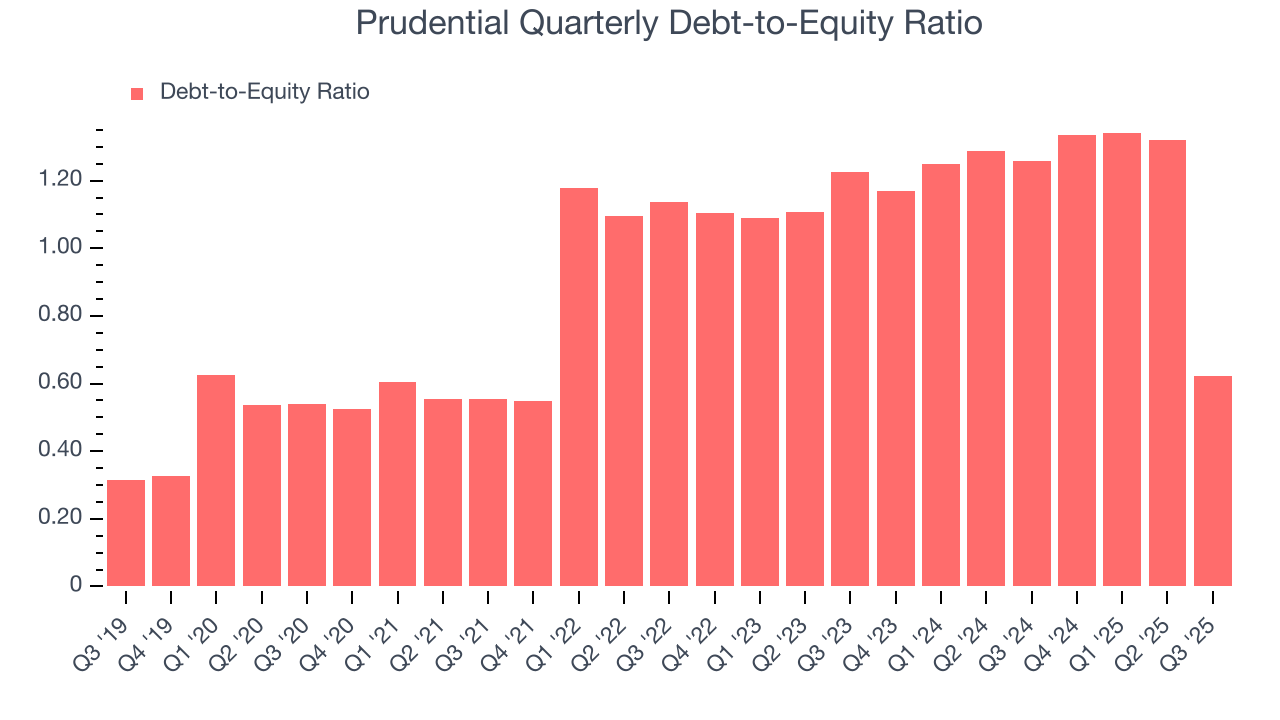
Prudential currently has $20.18 billion of debt and $32.46 billion of shareholder's equity on its balance sheet, and over the past four quarters, has averaged a debt-to-equity ratio of 1.2×. We think this is dangerous - for an insurance business, anything above 1.0× raises red flags.
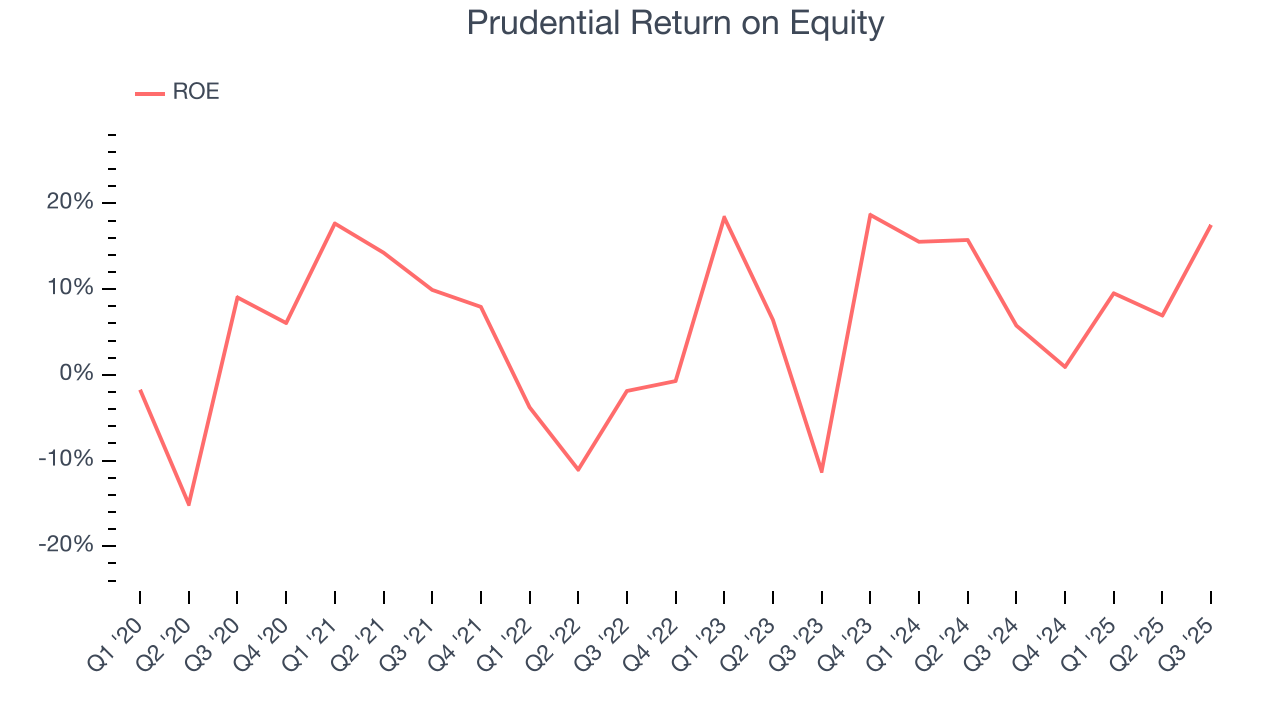
11. Return on Equity
Return on equity, or ROE, represents the ultimate measure of an insurer's effectiveness, quantifying how well it transforms shareholder investments into profits. Over the long term, insurance companies with robust ROE metrics typically deliver superior shareholder returns through a balanced approach to capital management.
Over the last five years, Prudential has averaged an ROE of 7.1%, uninspiring for a company operating in a sector where the average shakes out around 12.5%.
12. Key Takeaways from Prudential’s Q3 Results
We were impressed by how significantly Prudential blew past analysts’ net premiums earned expectations this quarter. We were also excited its revenue outperformed Wall Street’s estimates by a wide margin. On the other hand, its book value per share missed. Overall, this print had some key positives. The stock traded up 1.5% to $102.75 immediately after reporting.
13. Is Now The Time To Buy Prudential?
Updated: January 24, 2026 at 11:06 PM EST
Before investing in or passing on Prudential, we urge you to understand the company’s business quality (or lack thereof), valuation, and the latest quarterly results - in that order.
We cheer for all companies serving everyday consumers, but in the case of Prudential, we’ll be cheering from the sidelines. For starters, its revenue growth was weak over the last five years. And while its estimated BVPS growth for the next 12 months is great, the downside is its BVPS has declined over the last five years. On top of that, its net premiums earned has declined over the last five years.
Prudential’s P/B ratio based on the next 12 months is 1.2x. This valuation tells us it’s a bit of a market darling with a lot of good news priced in - we think there are better stocks to buy right now.
Wall Street analysts have a consensus one-year price target of $119.36 on the company (compared to the current share price of $108.44).