
RBC Bearings (RBC)
RBC Bearings is a great business. Its ability to balance growth and profitability while maintaining a bright outlook makes it a gem.― StockStory Analyst Team
1. News


2. Summary
Why We Like RBC Bearings
With a Guinness World Record for engineering the largest spherical plain bearing, RBC Bearings (NYSE:RBC) is a manufacturer of bearings and related components for the aerospace & defense, industrial, and transportation industries.
- Market share has increased this cycle as its 21% annual revenue growth over the last five years was exceptional
- Earnings growth has trumped its peers over the last five years as its EPS has compounded at 19.7% annually
- Disciplined cost controls and effective management have materialized in a strong operating margin, and it turbocharged its profits by achieving some fixed cost leverage


RBC Bearings is a standout company. There are plenty of reasons to like the stock.
Is Now The Time To Buy RBC Bearings?


RBC Bearings is trading at $504.57 per share, or 40.4x forward P/E. The lofty multiple means expectations are high for this company over the next six to twelve months.
Are you a fan of the company and believe in the bull case? If so, you can own a smaller position, as high-quality companies tend to outperform the market over a long-term period regardless of entry price.
3. RBC Bearings (RBC) Research Report: Q4 CY2025 Update
Bearings manufacturer RBC Bearings (NYSE:RBC) met Wall Street’s revenue expectations in Q4 CY2025, with sales up 17% year on year to $461.6 million. On the other hand, next quarter’s revenue guidance of $500 million was less impressive, coming in 1.6% below analysts’ estimates. Its non-GAAP profit of $3.04 per share was 6.2% above analysts’ consensus estimates.
RBC Bearings (RBC) Q4 CY2025 Highlights:
- Revenue: $461.6 million vs analyst estimates of $460.3 million (17% year-on-year growth, in line)
- Adjusted EPS: $3.04 vs analyst estimates of $2.86 (6.2% beat)
- Adjusted EBITDA: $149.6 million vs analyst estimates of $143.6 million (32.4% margin, 4.2% beat)
- Revenue Guidance for Q1 CY2026 is $500 million at the midpoint, below analyst estimates of $508 million
- Operating Margin: 22.3%, in line with the same quarter last year
- Free Cash Flow Margin: 21.5%, up from 18.7% in the same quarter last year
- Market Capitalization: $16.27 billion
Company Overview
With a Guinness World Record for engineering the largest spherical plain bearing, RBC Bearings (NYSE:RBC) is a manufacturer of bearings and related components for the aerospace & defense, industrial, and transportation industries.
Its origins can be traced back to 1919, and the company has grown and evolved over time through organic growth as well as acquisitions. Acquisitions such as ABB’s Dodge division have substantially increased scale, product depth, and reach in the market.
Its product lineup includes a diverse range of bearings (mechanical components that reduce friction between moving parts) along with associated components like bearing housings, seals, and lubrication systems. These bearings and components play essential roles in machinery and equipment by facilitating efficient movement, reducing friction, and supporting heavy loads. The company’s products contribute to various mechanical systems in the aerospace, defense, industrial, and transportation industries.
RBC Bearings utilizes multiple channels to sell its products. In addition to direct sales through its sales representatives and distribution network, RBC Bearings also leverages e-commerce platforms to cater to customers' needs. Furthermore, the company actively participates in industry trade shows, exhibitions, and conferences to showcase its products. Contracts with original equipment manufacturers (OEMs) and government entities may involve long-term agreements, recurring purchases, or one-time transactions, depending on the needs of the OEMs and the nature of the products.
4. Engineered Components and Systems
Engineered components and systems companies possess technical know-how in sometimes narrow areas such as metal forming or intelligent robotics. Lately, automation and connected equipment collecting analyzable data have been trending, creating new demand. On the other hand, like the broader industrials sector, engineered components and systems companies are at the whim of economic cycles. Consumer spending and interest rates, for example, can greatly impact the industrial production that drives demand for these companies’ offerings.
Competitors offering similar products include Timken (NYSE:TKR), NN (NASDAQ:NNBR), Kadant (NYSE:KAI), and Kaydon (NYSE:KDN).
5. Revenue Growth
Examining a company’s long-term performance can provide clues about its quality. Any business can have short-term success, but a top-tier one grows for years. Thankfully, RBC Bearings’s 23.1% annualized revenue growth over the last five years was incredible. Its growth surpassed the average industrials company and shows its offerings resonate with customers, a great starting point for our analysis.
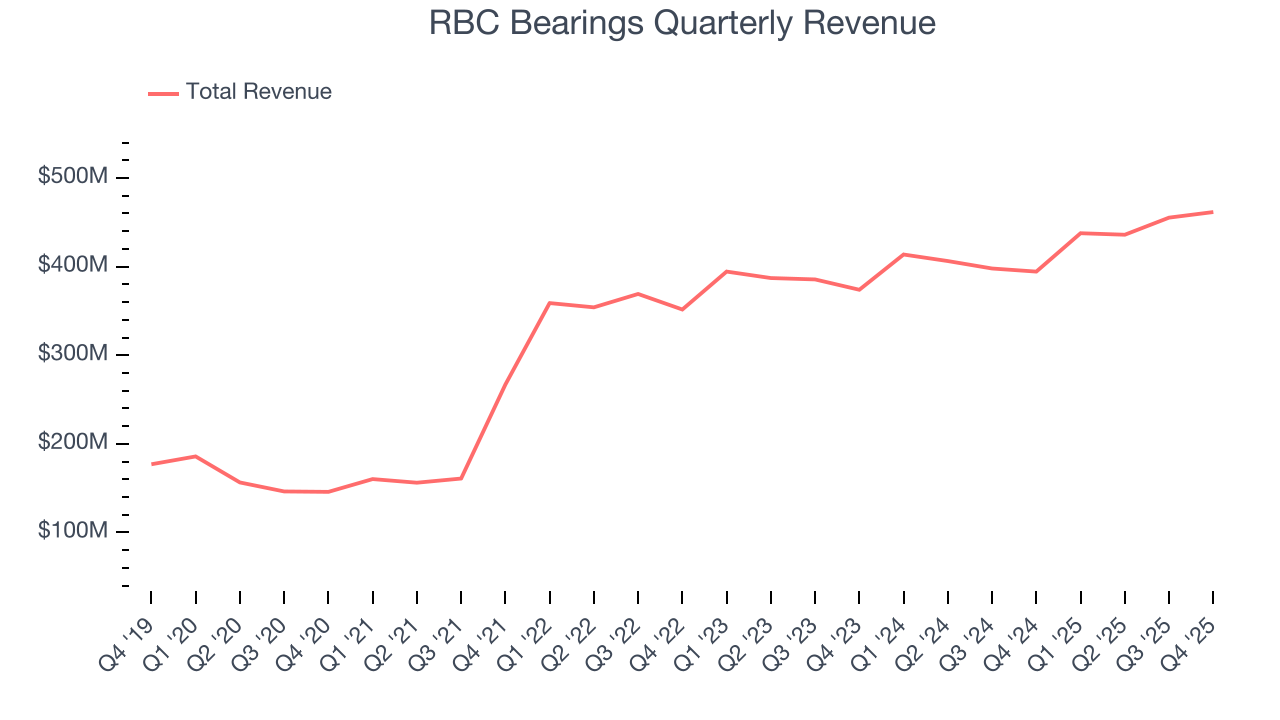
Long-term growth is the most important, but within industrials, a half-decade historical view may miss new industry trends or demand cycles. RBC Bearings’s annualized revenue growth of 7.8% over the last two years is below its five-year trend, but we still think the results were respectable. 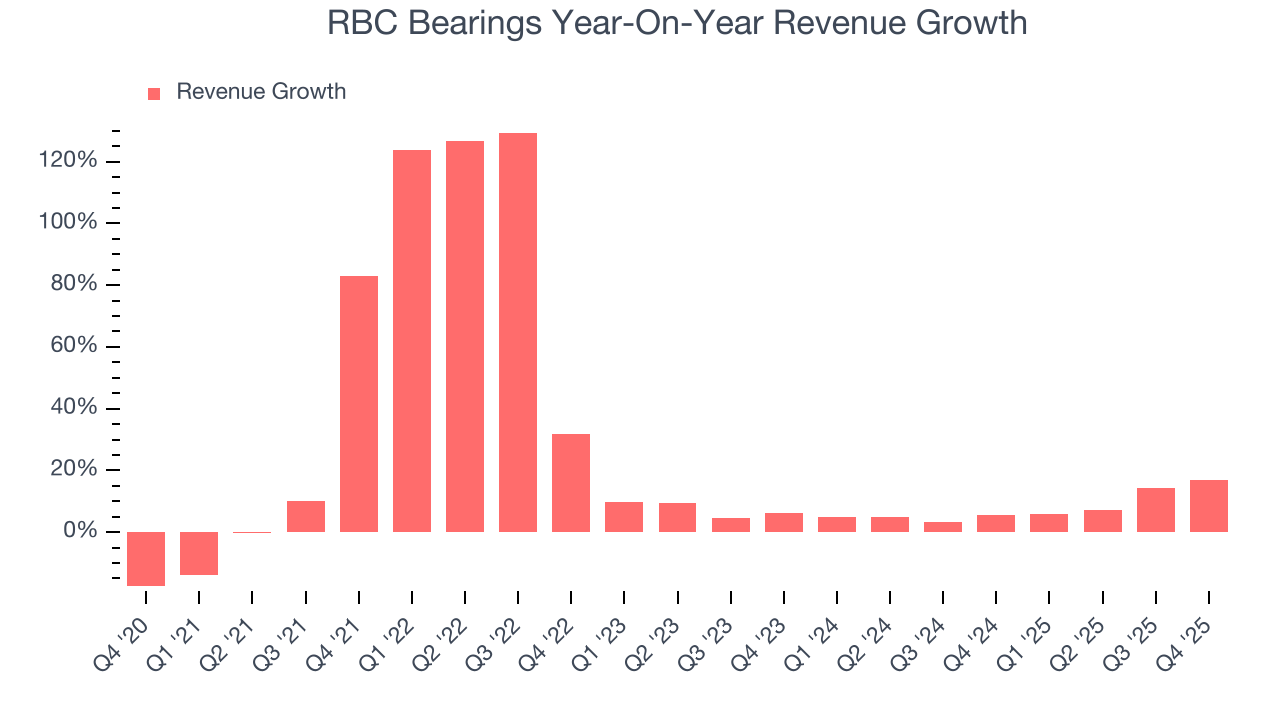
RBC Bearings also breaks out the revenue for its most important segments, Diversified Industrials and Aerospace and Defense, which are 43.9% and 56.1% of revenue. Over the last two years, RBC Bearings’s Diversified Industrials revenue (general industrial equipment) averaged 1.6% year-on-year declines. On the other hand, its Aerospace and Defense revenue (aircraft equipment, radar, missiles) averaged 25.6% growth. 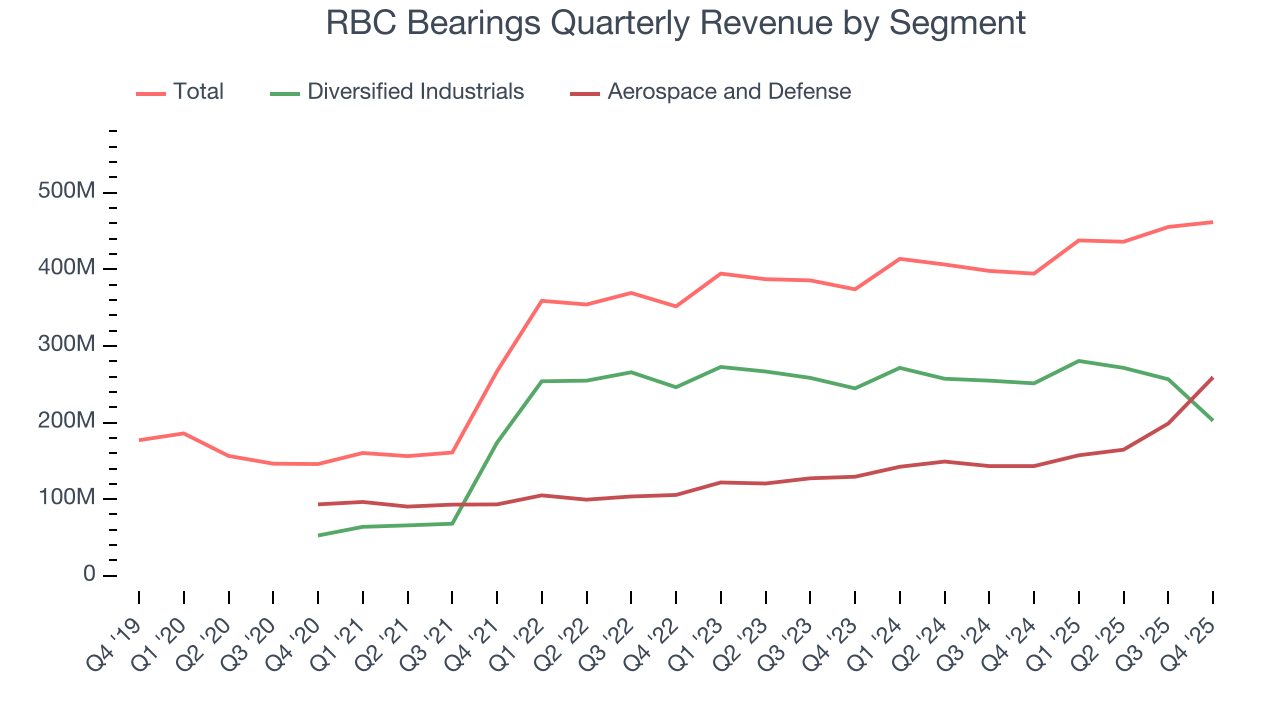
This quarter, RBC Bearings’s year-on-year revenue growth was 17%, and its $461.6 million of revenue was in line with Wall Street’s estimates. Company management is currently guiding for a 14.2% year-on-year increase in sales next quarter.
Looking further ahead, sell-side analysts expect revenue to grow 12.8% over the next 12 months, an improvement versus the last two years. This projection is admirable and implies its newer products and services will catalyze better top-line performance.
6. Gross Margin & Pricing Power
All else equal, we prefer higher gross margins because they usually indicate that a company sells more differentiated products and commands stronger pricing power.
RBC Bearings has best-in-class unit economics for an industrials company, enabling it to invest in areas such as research and development. Its margin also signals it sells differentiated products, not commodities. As you can see below, it averaged an elite 42.5% gross margin over the last five years. That means RBC Bearings only paid its suppliers $57.53 for every $100 in revenue. 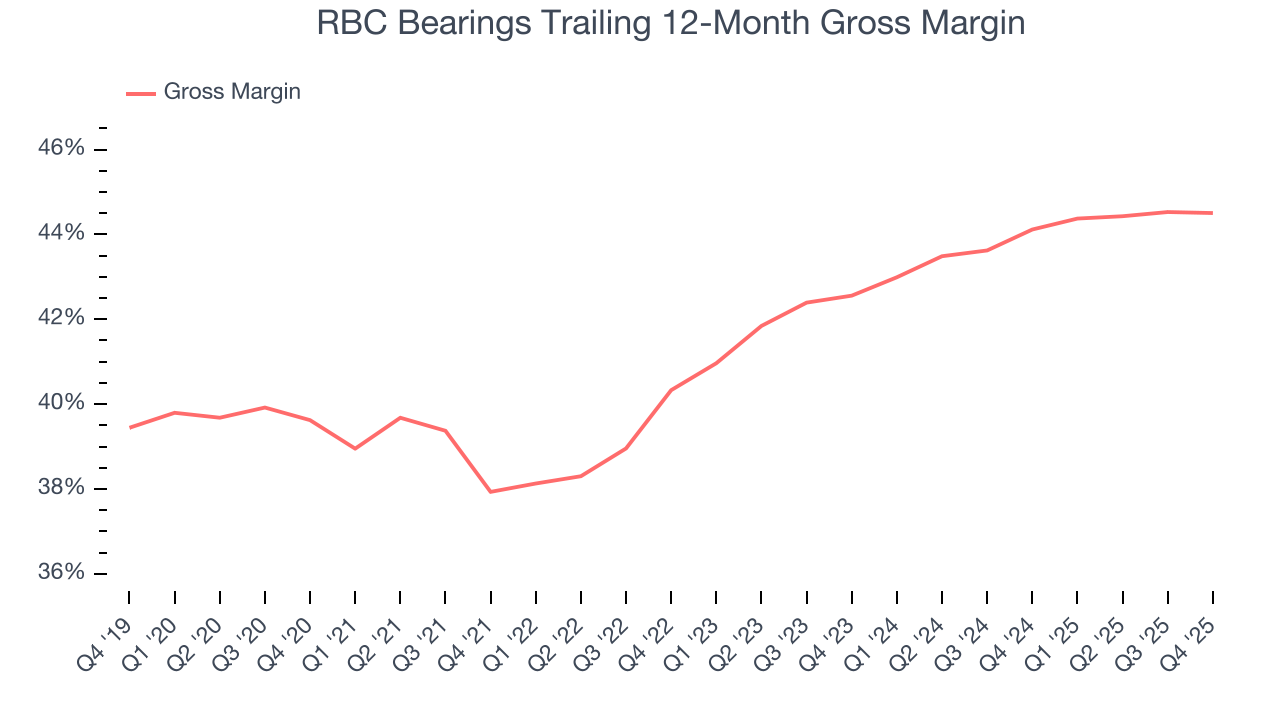
RBC Bearings’s gross profit margin came in at 44.3% this quarter, in line with the same quarter last year. On a wider time horizon, the company’s full-year margin has remained steady over the past four quarters, suggesting its input costs (such as raw materials and manufacturing expenses) have been stable and it isn’t under pressure to lower prices.
7. Operating Margin
RBC Bearings has been a well-oiled machine over the last five years. It demonstrated elite profitability for an industrials business, boasting an average operating margin of 20.5%. This result isn’t surprising as its high gross margin gives it a favorable starting point.
Analyzing the trend in its profitability, RBC Bearings’s operating margin rose by 10.2 percentage points over the last five years, as its sales growth gave it immense operating leverage.
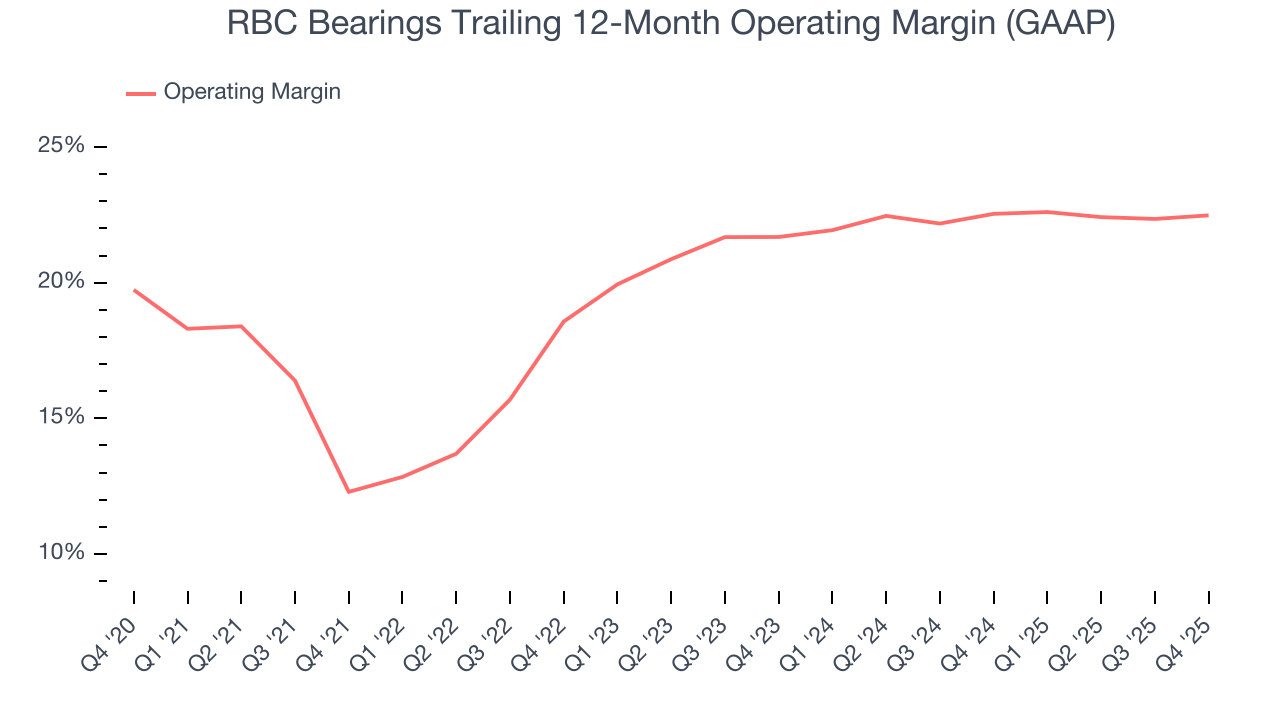
This quarter, RBC Bearings generated an operating margin profit margin of 22.3%, in line with the same quarter last year. This indicates the company’s cost structure has recently been stable.
8. Earnings Per Share
We track the long-term change in earnings per share (EPS) for the same reason as long-term revenue growth. Compared to revenue, however, EPS highlights whether a company’s growth is profitable.
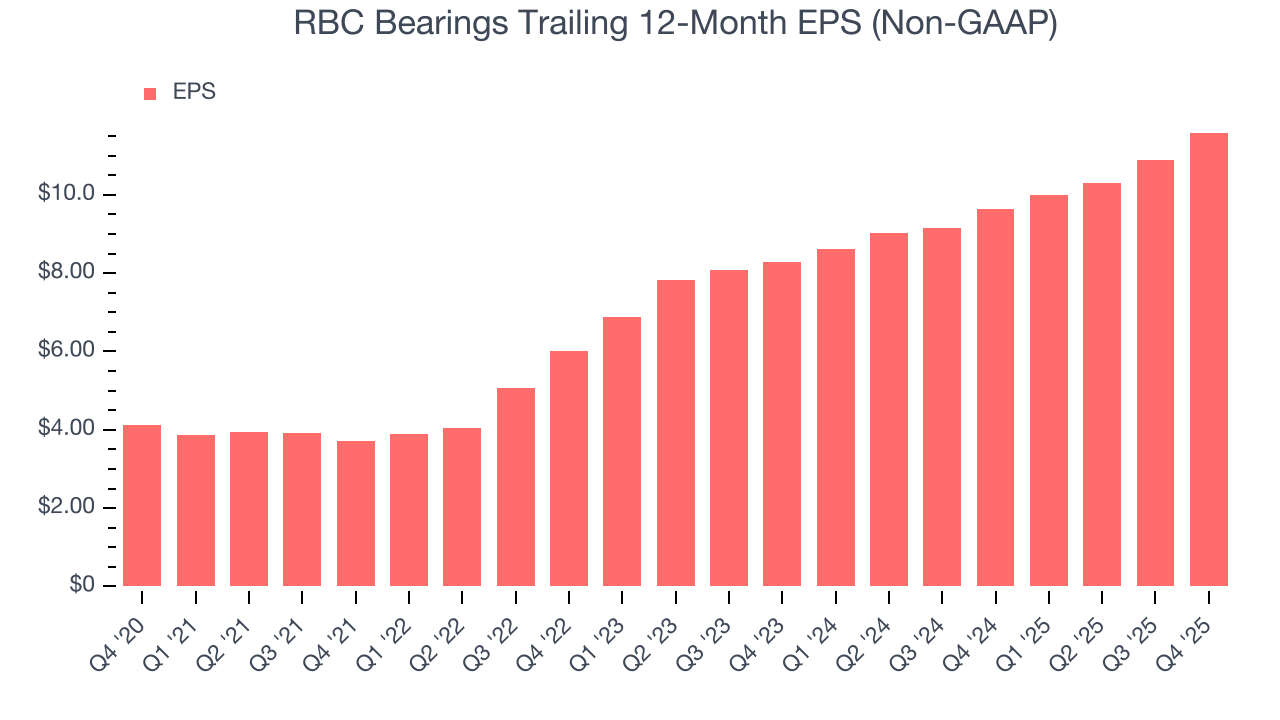
RBC Bearings’s astounding 23% annual EPS growth over the last five years aligns with its revenue performance. This tells us its incremental sales were profitable.
Like with revenue, we analyze EPS over a shorter period to see if we are missing a change in the business.
RBC Bearings’s two-year annual EPS growth of 18.3% was fantastic and topped its 7.8% two-year revenue growth.
Diving into the nuances of RBC Bearings’s earnings can give us a better understanding of its performance. While we mentioned earlier that RBC Bearings’s operating margin was flat this quarter, a two-year view shows its margin has expanded. This was the most relevant factor (aside from the revenue impact) behind its higher earnings; interest expenses and taxes can also affect EPS but don’t tell us as much about a company’s fundamentals.
In Q4, RBC Bearings reported adjusted EPS of $3.04, up from $2.34 in the same quarter last year. This print beat analysts’ estimates by 6.2%. Over the next 12 months, Wall Street expects RBC Bearings’s full-year EPS of $11.59 to grow 14.1%.
9. Cash Is King
Free cash flow isn't a prominently featured metric in company financials and earnings releases, but we think it's telling because it accounts for all operating and capital expenses, making it tough to manipulate. Cash is king.
RBC Bearings has shown terrific cash profitability, putting it in an advantageous position to invest in new products, return capital to investors, and consolidate the market during industry downturns. The company’s free cash flow margin was among the best in the industrials sector, averaging 15.8% over the last five years.
Taking a step back, we can see that RBC Bearings’s margin dropped by 1.8 percentage points during that time. It may have ticked higher more recently, but shareholders are likely hoping for its margin to at least revert to its historical level. If the longer-term trend returns, it could signal increasing investment needs and capital intensity. We’re willing to give the company some leeway give it’s one of the more cash generative and investable businesses in its space.
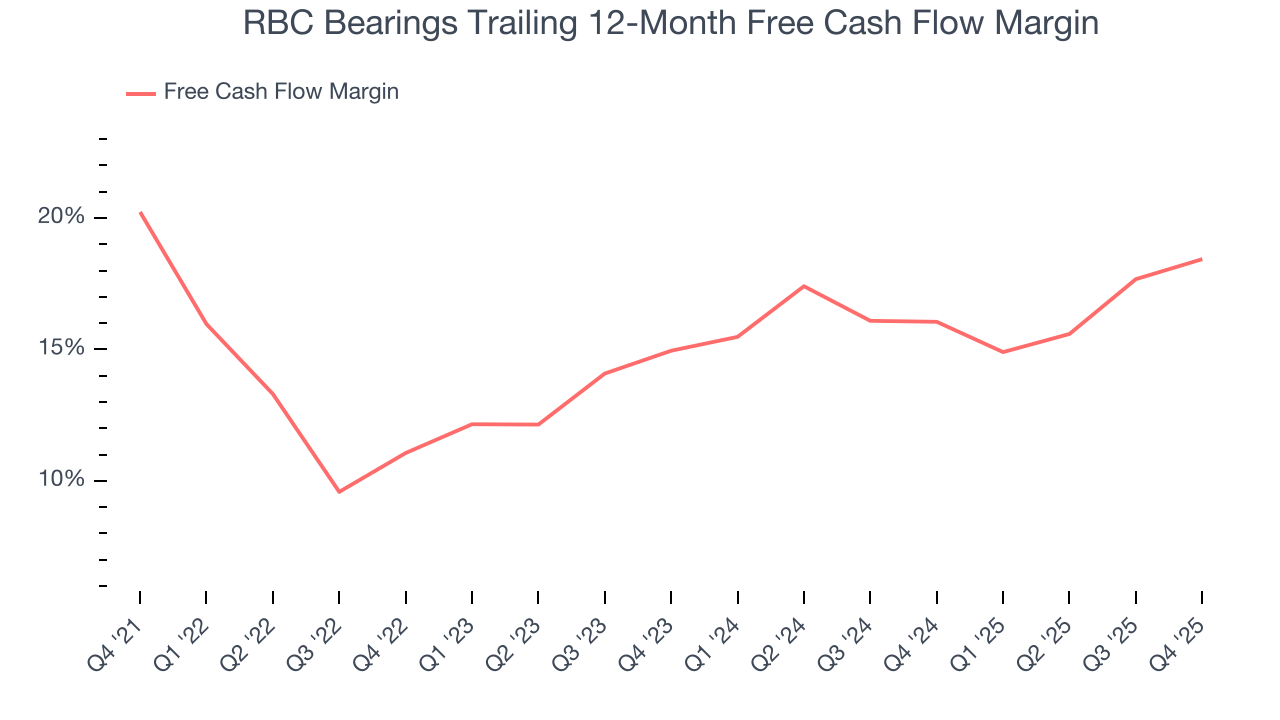
RBC Bearings’s free cash flow clocked in at $99.1 million in Q4, equivalent to a 21.5% margin. This result was good as its margin was 2.8 percentage points higher than in the same quarter last year. Its cash profitability was also above its five-year level, and we hope the company can build on this trend.
10. Return on Invested Capital (ROIC)
EPS and free cash flow tell us whether a company was profitable while growing its revenue. But was it capital-efficient? A company’s ROIC explains this by showing how much operating profit it makes compared to the money it has raised (debt and equity).
Although RBC Bearings has shown solid business quality lately, it historically did a mediocre job investing in profitable growth initiatives. Its five-year average ROIC was 6.1%, somewhat low compared to the best industrials companies that consistently pump out 20%+.
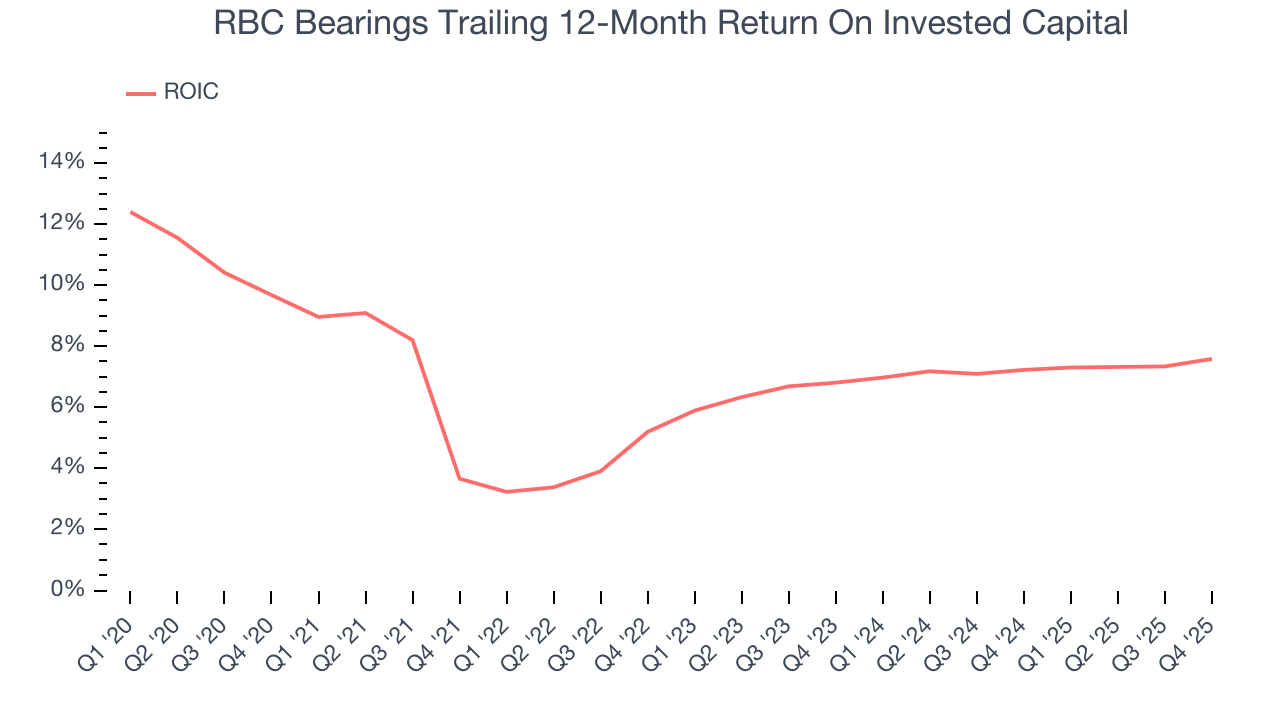
We like to invest in businesses with high returns, but the trend in a company’s ROIC is what often surprises the market and moves the stock price. On average, RBC Bearings’s ROIC increased by 3 percentage points annually each year over the last few years. its rising ROIC is a good sign and could suggest its competitive advantage or profitable growth opportunities are expanding.
11. Balance Sheet Assessment
RBC Bearings reported $107.6 million of cash and $1.05 billion of debt on its balance sheet in the most recent quarter. As investors in high-quality companies, we primarily focus on two things: 1) that a company’s debt level isn’t too high and 2) that its interest payments are not excessively burdening the business.
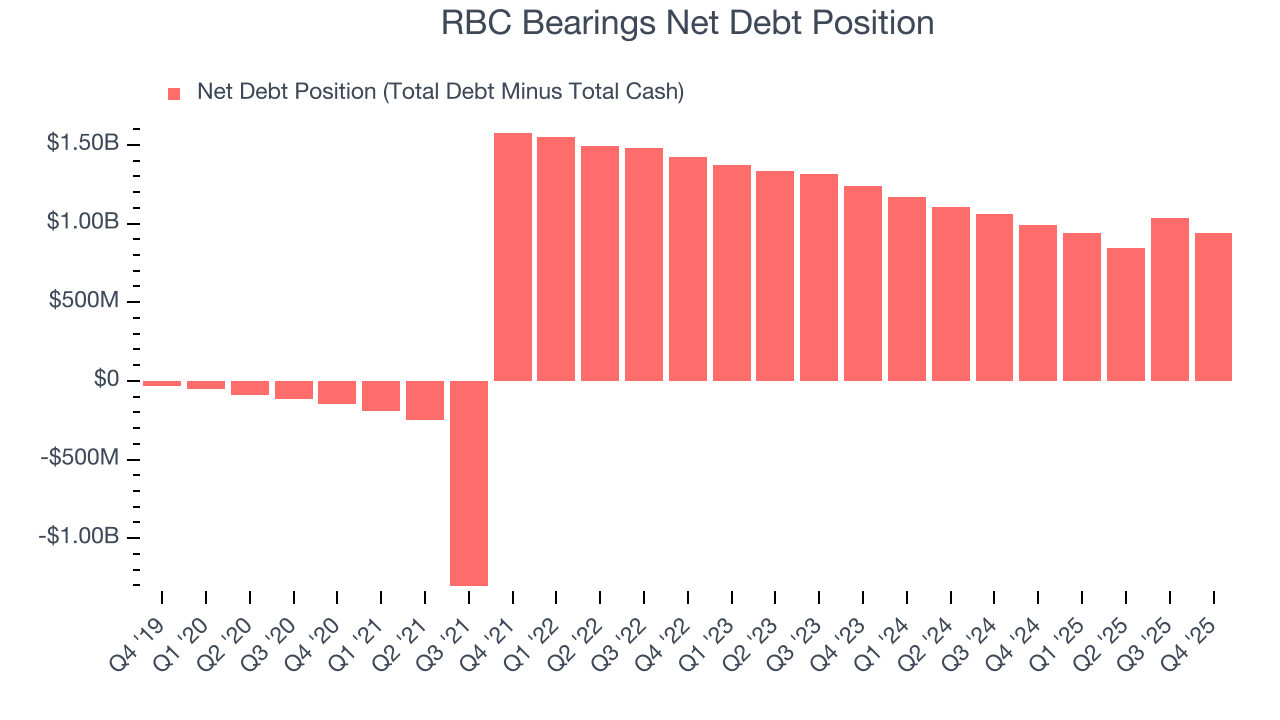
With $554.1 million of EBITDA over the last 12 months, we view RBC Bearings’s 1.7× net-debt-to-EBITDA ratio as safe. We also see its $25.4 million of annual interest expenses as appropriate. The company’s profits give it plenty of breathing room, allowing it to continue investing in growth initiatives.
12. Key Takeaways from RBC Bearings’s Q4 Results
We were impressed by how significantly RBC Bearings blew past analysts’ Aerospace and Defense revenue expectations this quarter. We were also glad its EBITDA outperformed Wall Street’s estimates. On the other hand, its Diversified Industrials revenue missed and its revenue guidance for next quarter fell short of Wall Street’s estimates. Overall, this print was mixed but still had some key positives. The market seemed to be hoping for more, and the stock traded down 5% to $491.00 immediately after reporting.
13. Is Now The Time To Buy RBC Bearings?
Updated: February 5, 2026 at 8:35 AM EST
Before making an investment decision, investors should account for RBC Bearings’s business fundamentals and valuation in addition to what happened in the latest quarter.
RBC Bearings is an amazing business ranking highly on our list. First of all, the company’s revenue growth was exceptional over the last five years. And while its relatively low ROIC suggests management has struggled to find compelling investment opportunities, its powerful free cash flow generation enables it to stay ahead of the competition through consistent reinvestment of profits. On top of that, RBC Bearings’s impressive operating margins show it has a highly efficient business model.
RBC Bearings’s P/E ratio based on the next 12 months is 39.1x. There’s some optimism reflected in this multiple, but we don’t mind owning a high-quality business, even if it’s slightly expensive. It’s often wise to hold investments like this for at least three to five years, as the power of long-term compounding negates short-term price swings that can accompany relatively high valuations.
Wall Street analysts have a consensus one-year price target of $518.67 on the company (compared to the current share price of $491.00).