
Raymond James (RJF)
Raymond James is a great business. Its annual EPS growth of 21.2% over the last five years has topped its peer group.― StockStory Analyst Team
1. News


2. Summary
Why We Like Raymond James
Founded in 1962 and headquartered in St. Petersburg, Florida, Raymond James Financial (NYSE:RJF) is a diversified financial services company that provides wealth management, investment banking, asset management, and banking services to individuals and institutions.
- Incremental sales over the last five years boosted profitability as its annual earnings per share growth of 21.2% outstripped its revenue performance
- Annual tangible book value per share growth of 14.7% over the past two years was outstanding, reflecting strong capital accumulation this cycle
- ROE punches in at 17.9%, illustrating management’s expertise in identifying profitable investments


We have an affinity for Raymond James. The valuation looks reasonable relative to its quality, so this might be a good time to buy some shares.
Why Is Now The Time To Buy Raymond James?


Raymond James is trading at $169.07 per share, or 14.2x forward P/E. Most financials companies are more expensive, so we think Raymond James is a good deal when considering its quality characteristics.
By definition, where you buy a stock impacts returns. Compared to entry price, business quality matters much more for long-term market outperformance. Buying in at a great price helps, nevertheless.
3. Raymond James (RJF) Research Report: Q4 CY2025 Update
Financial services firm Raymond James Financial (NYSE:RJF) missed Wall Street’s revenue expectations in Q4 CY2025, but sales rose 5.6% year on year to $3.74 billion. Its non-GAAP profit of $2.86 per share was 1.1% above analysts’ consensus estimates.
Raymond James (RJF) Q4 CY2025 Highlights:
- Assets Under Management: $280.8 billion (15.1% year-on-year growth)
- Revenue: $3.74 billion vs analyst estimates of $3.77 billion (5.6% year-on-year growth, 0.9% miss)
- Pre-tax Profit: $728 million (19.5% margin)
- Adjusted EPS: $2.86 vs analyst estimates of $2.83 (1.1% beat)
- Tangible Book Value per Share: $54.82 vs analyst estimates of $54.76 (12.3% year-on-year growth, in line)
- Market Capitalization: $33.33 billion
Company Overview
Founded in 1962 and headquartered in St. Petersburg, Florida, Raymond James Financial (NYSE:RJF) is a diversified financial services company that provides wealth management, investment banking, asset management, and banking services to individuals and institutions.
Raymond James operates through five business segments that work together to serve clients across the financial spectrum. The Private Client Group, the company's largest segment, offers financial planning and investment services through a network of financial advisors who can affiliate with the firm in multiple ways – as employees, independent contractors, or through third-party RIAs. This flexibility in advisor affiliation models distinguishes Raymond James from many competitors.
The Capital Markets segment provides investment banking services including merger and acquisition advisory, equity and debt underwriting, as well as institutional brokerage services and research. Meanwhile, the Asset Management segment oversees client assets through its Asset Management Services division and Raymond James Investment Management, earning fees based on assets under management.
The Bank segment includes Raymond James Bank and TriState Capital Bank, which offer various lending products such as securities-based loans, corporate loans, and residential mortgages, while also providing deposit accounts for clients. The company's banking operations complement its wealth management business by allowing clients to keep their cash deposits within the Raymond James ecosystem.
A client might engage with Raymond James by working with a financial advisor who helps them develop a retirement plan, invest in a diversified portfolio of stocks and mutual funds, and secure a securities-based loan to purchase a vacation property – all while keeping their cash deposits at Raymond James Bank. The company generates revenue through advisory fees, commissions, interest income on loans, and other service fees.
4. Investment Banking & Brokerage
Investment banks and brokerages facilitate capital raises, mergers and acquisitions, and securities trading. The sector benefits from corporate activity during economic expansion, increased retail trading participation, and advisory opportunities in emerging sectors. Headwinds include economic cycle vulnerability affecting deal flow, compressed trading commissions due to electronic platforms, and regulatory capital requirements constraining certain higher-risk activities.
Raymond James Financial competes with major financial services firms including Morgan Stanley (NYSE:MS), Bank of America's Merrill Lynch (NYSE:BAC), UBS Group (NYSE:UBS), and Charles Schwab (NYSE:SCHW), as well as regional broker-dealers and independent advisory firms.
5. Revenue Growth
A company’s long-term performance is an indicator of its overall quality. Any business can put up a good quarter or two, but the best consistently grow over the long haul. Thankfully, Raymond James’s 11.7% annualized revenue growth over the last five years was solid. Its growth surpassed the average financials company and shows its offerings resonate with customers, a great starting point for our analysis.
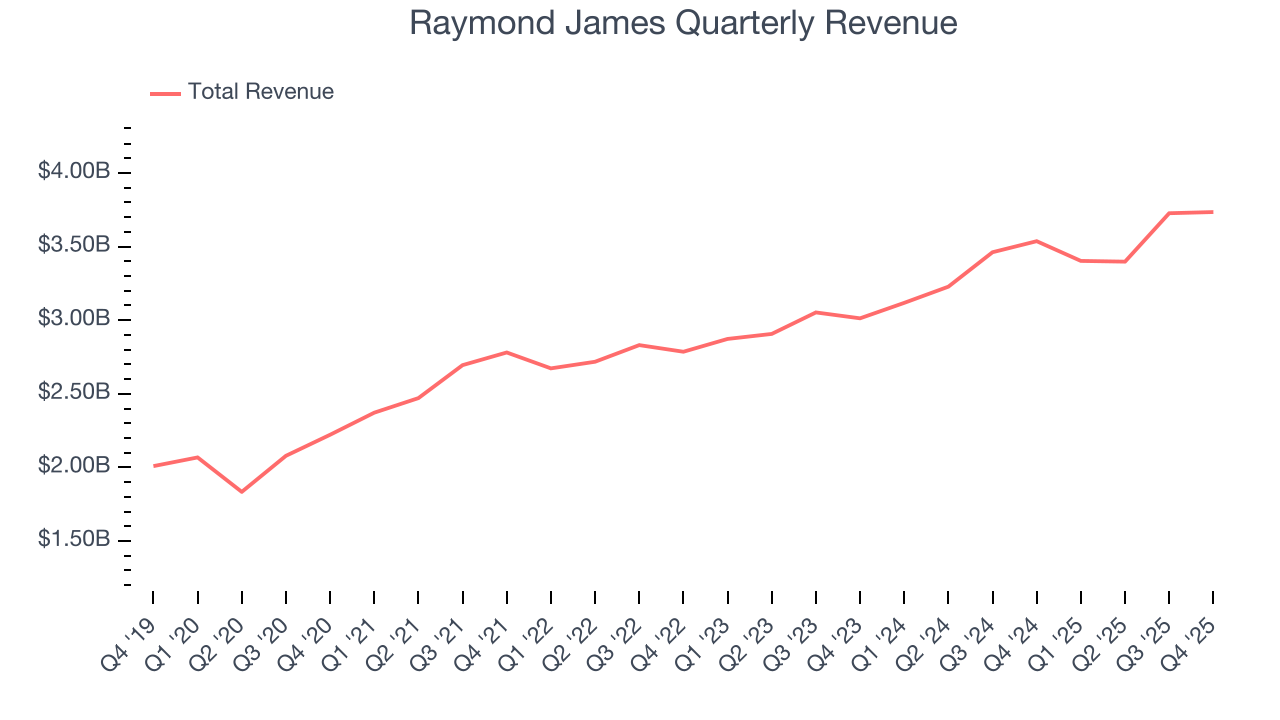
Long-term growth is the most important, but within financials, a half-decade historical view may miss recent interest rate changes and market returns. Raymond James’s annualized revenue growth of 9.7% over the last two years is below its five-year trend, but we still think the results were respectable. 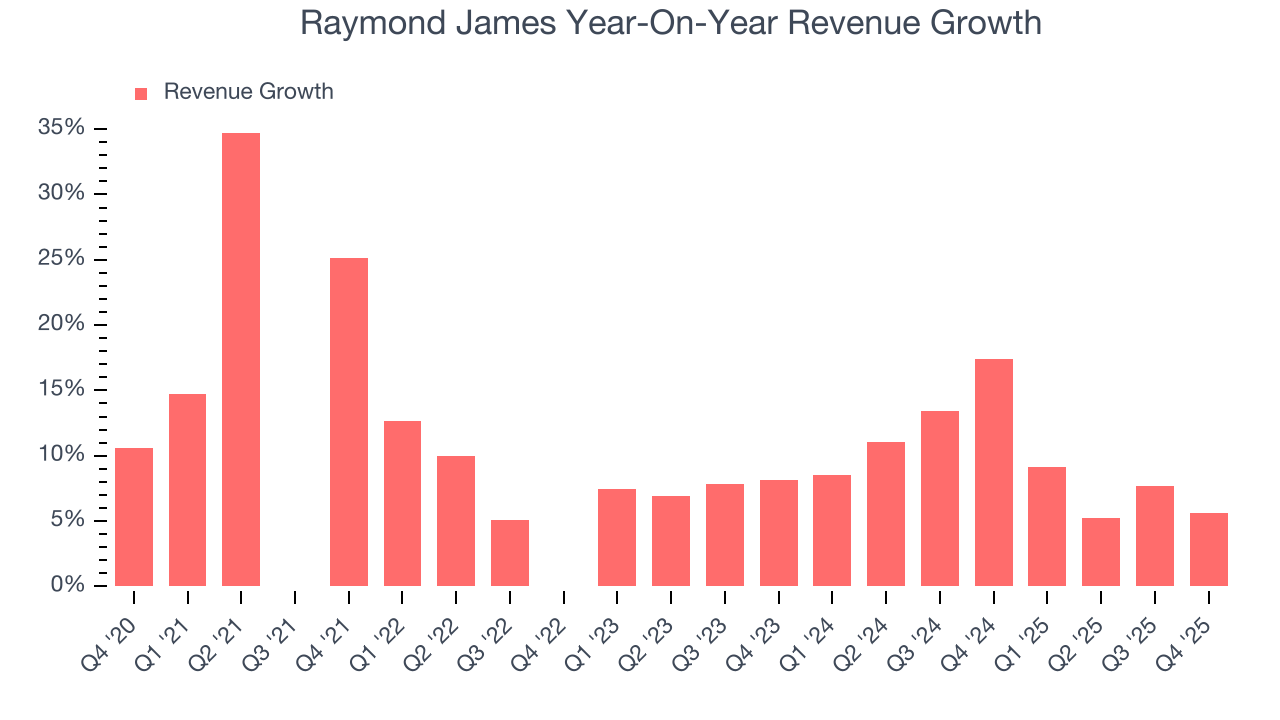 Note: Quarters not shown were determined to be outliers, impacted by outsized investment gains/losses that are not indicative of the recurring fundamentals of the business.
This quarter, Raymond James’s revenue grew by 5.6% year on year to $3.74 billion, missing Wall Street’s estimates.
6. Assets Under Management (AUM)
Assets Under Management (AUM) represents the total value of investments that a financial institution manages for its clients. These assets generate steady income through management fees, creating predictable revenue streams that remain stable so long as clients remain invested with the firm.
Raymond James’s AUM has grown at an annual rate of 12.3% over the last five years, a step above the broader financials industry and faster than its total revenue. When analyzing Raymond James’s AUM over the last two years, we can see that growth accelerated to 14.9% annually. Fundraising or short-term investment performance were net contributors for the company over this shorter period since assets grew faster than total revenue. Just remember that while assets are relevant to watch, we don't place too much emphasis on them because they ebb and flow with the market.
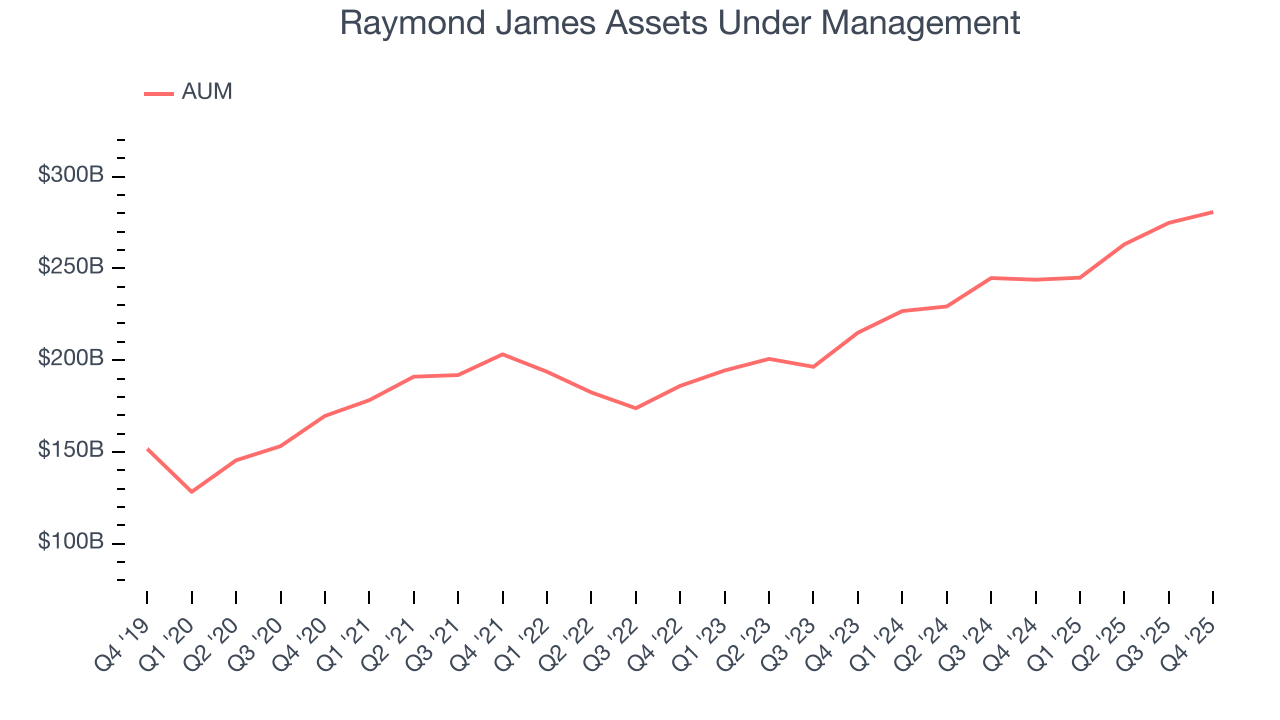
Raymond James’s AUM punched in at $280.8 billion this quarter. This print was 15.1% higher than the same quarter last year.
7. Pre-Tax Profit Margin
Revenue growth is one major determinant of business quality, and the efficiency of operations is another. For Investment Banking & Brokerage companies, we look at pre-tax profit rather than the operating margin that defines sectors such as consumer, tech, and industrials.
Interest income and expenses play a big role in financial institutions' profitability, so they should be factored into the definition of profit. Taxes, however, should not as they are largely out of a company's control. This is pre-tax profit by definition.
Over the last five years, Raymond James’s pre-tax profit margin has fallen by 5.6 percentage points, going from 18.9% to 18.9%. However, fixed cost leverage was muted more recently as the company’s pre-tax profit margin was flat on a two-year basis.
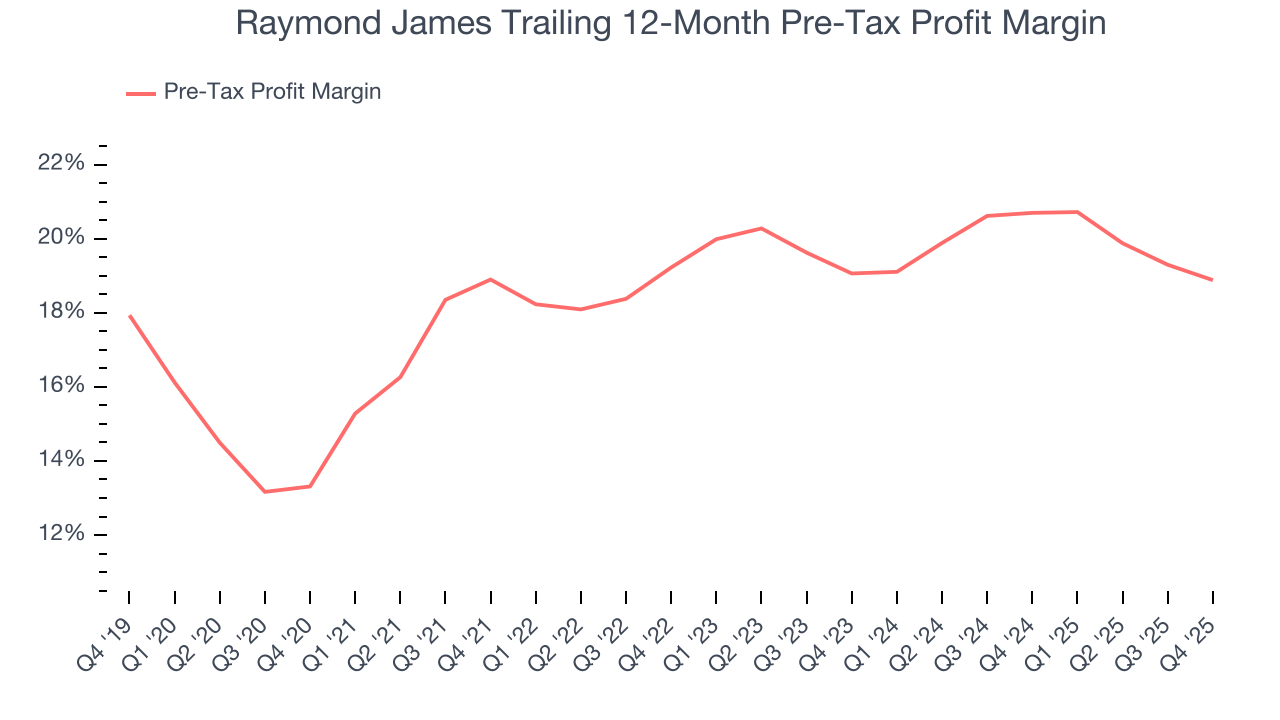
In Q4, Raymond James’s pre-tax profit margin was 19.5%. This result was 1.7 percentage points worse than the same quarter last year.
8. Earnings Per Share
We track the long-term change in earnings per share (EPS) for the same reason as long-term revenue growth. Compared to revenue, however, EPS highlights whether a company’s growth is profitable.
Raymond James’s EPS grew at a remarkable 19.7% compounded annual growth rate over the last five years, higher than its 11.7% annualized revenue growth. This tells us the company became more profitable on a per-share basis as it expanded.
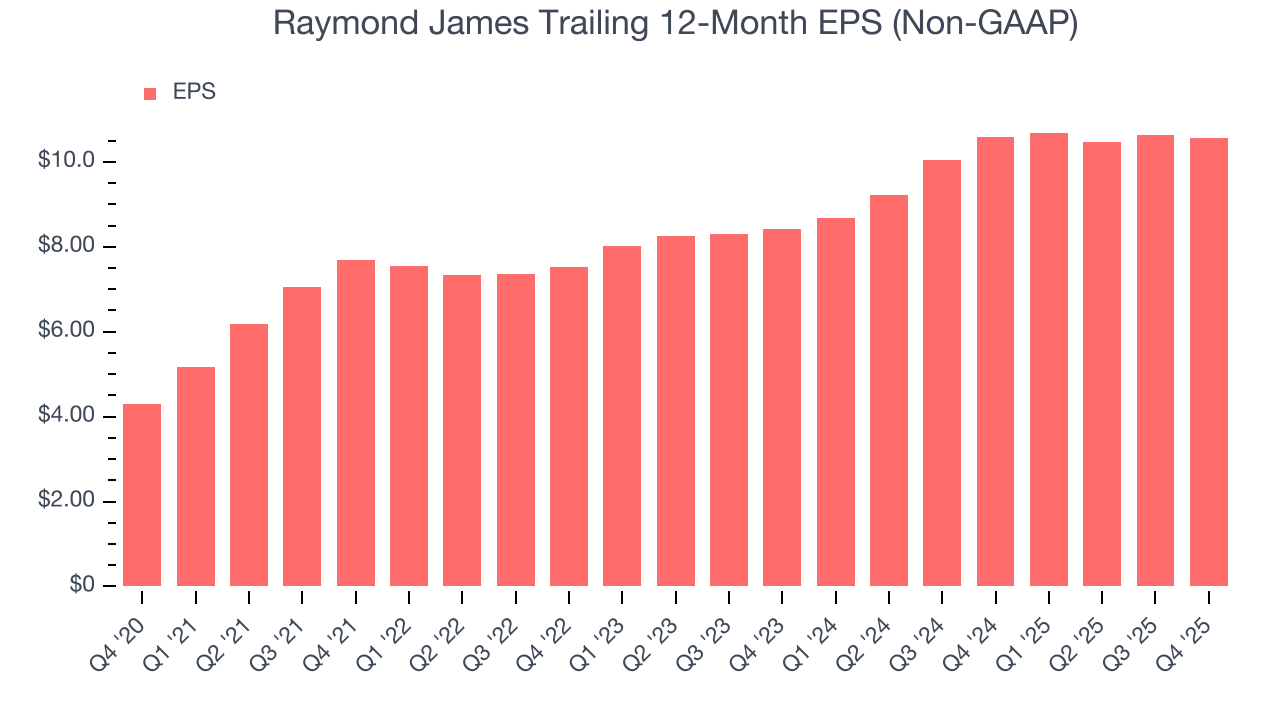
Like with revenue, we analyze EPS over a more recent period because it can provide insight into an emerging theme or development for the business.
For Raymond James, its two-year annual EPS growth of 12.1% was lower than its five-year trend. This wasn’t great, but at least the company was successful in other measures of financial health.
In Q4, Raymond James reported adjusted EPS of $2.86, down from $2.93 in the same quarter last year. This print was close to analysts’ estimates. Over the next 12 months, Wall Street expects Raymond James’s full-year EPS of $10.57 to grow 17.7%.
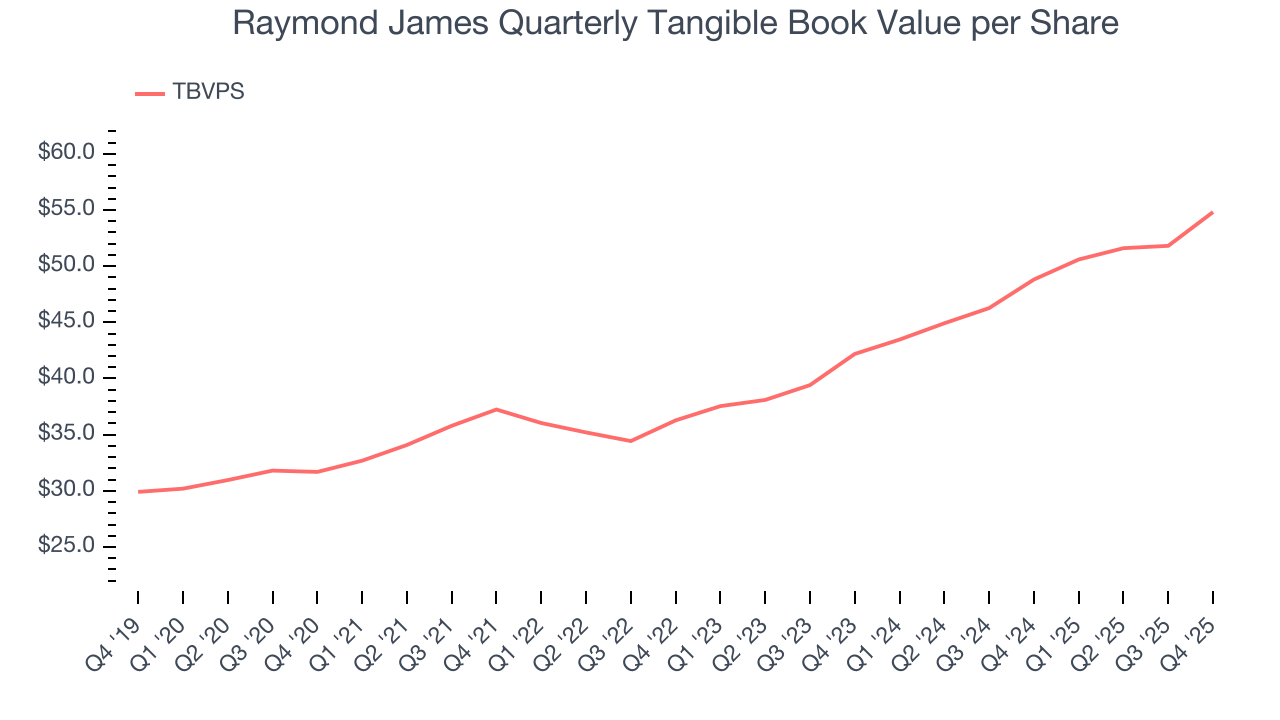
9. Tangible Book Value Per Share (TBVPS)
Financial institutions manage complex balance sheets spanning various financial activities. Valuations reflect this complexity, emphasizing balance sheet quality and long-term book value compounding across multiple revenue streams.
This is why we consider tangible book value per share (TBVPS) an important metric for the sector. TBVPS represents the real net worth per share across all business segments, providing a clear measure of shareholder equity regardless of the complexity of operations. EPS can become murky due to the complexity of multiple revenue streams, acquisition impacts, or accounting flexibility across different financial services, and book value resists financial engineering manipulation.
Raymond James’s TBVPS grew at a solid 11.6% annual clip over the last five years. TBVPS growth has also accelerated recently, growing by 14% annually over the last two years from $42.19 to $54.82 per share.
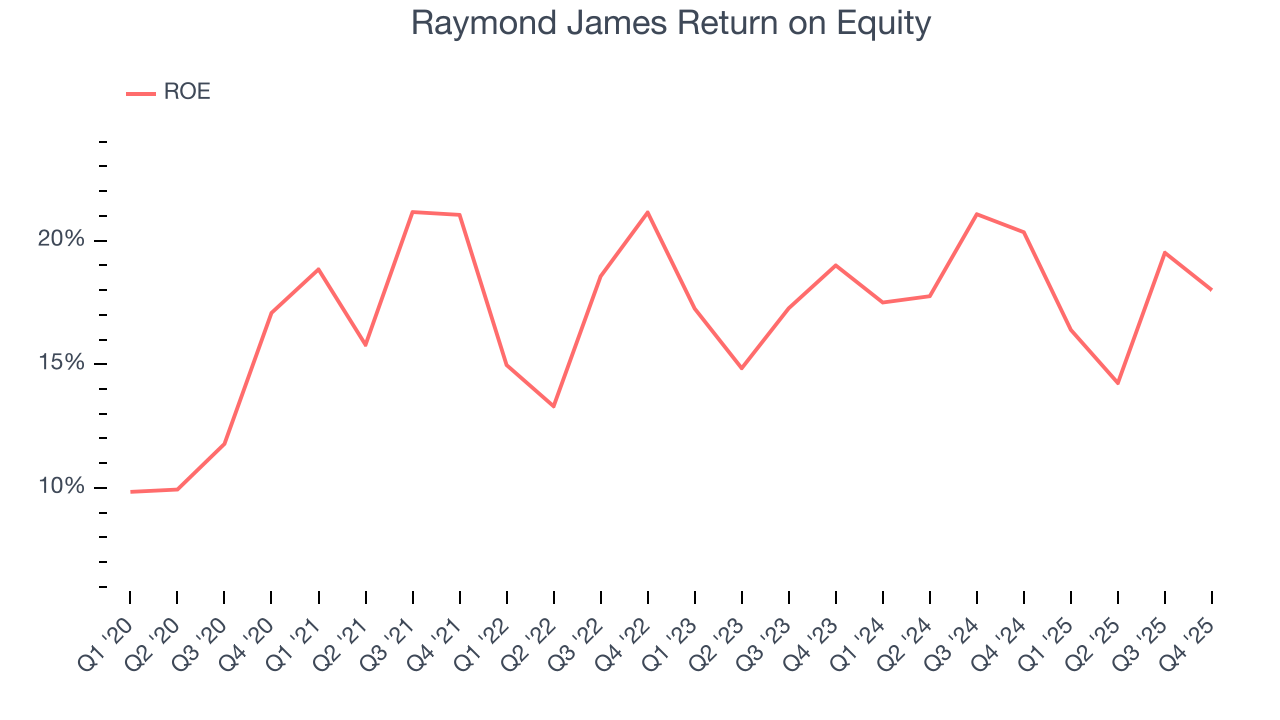
10. Return on Equity
Return on equity, or ROE, quantifies bank profitability relative to shareholder equity - an essential capital source for these institutions. Over extended periods, superior ROE performance drives faster shareholder wealth compounding through reinvestment, share repurchases, and dividend growth.
Over the last five years, Raymond James has averaged an ROE of 17.9%, impressive for a company operating in a sector where the average shakes out around 10% and those putting up 25%+ are greatly admired. This shows Raymond James has a strong competitive moat.
11. Balance Sheet Assessment
Leverage is core to a financial firm’s business model (loans funded by deposits). To ensure economic stability and avoid a repeat of the 2008 GFC, regulators require certain levels of capital and liquidity, focusing on the Tier 1 capital ratio.
Tier 1 capital is the highest-quality capital that a firm holds, consisting primarily of common stock and retained earnings, but also physical gold. It serves as the primary cushion against losses and is the first line of defense in times of financial distress.
This capital is divided by risk-weighted assets to derive the Tier 1 capital ratio. Risk-weighted means that cash and US treasury securities are assigned little risk while unsecured consumer loans and equity investments get much higher risk weights, for example.
New regulation after the 2008 financial crisis requires that all firms must maintain a Tier 1 capital ratio greater than 4.5%. On top of this, there are additional buffers based on scale, risk profile, and other regulatory classifications, so that at the end of the day, firms generally must maintain a 7-10% ratio at minimum.
Over the last two years, Raymond James has averaged a Tier 1 capital ratio of 22.7%, which is considered safe and well capitalized in the event that macro or market conditions suddenly deteriorate.
12. Key Takeaways from Raymond James’s Q4 Results
We struggled to find many positives in these results. Overall, this was a softer quarter. The stock traded down 4.3% to $161 immediately after reporting.
13. Is Now The Time To Buy Raymond James?
Updated: January 28, 2026 at 11:25 PM EST
Are you wondering whether to buy Raymond James or pass? We urge investors to not only consider the latest earnings results but also longer-term business quality and valuation as well.
There’s plenty to admire about Raymond James. First off, its revenue growth was solid over the last five years, and analysts believe it can continue growing at these levels. On top of that, Raymond James’s expanding pre-tax profit margin shows the business has become more efficient, and its remarkable EPS growth over the last five years shows its profits are trickling down to shareholders.
Raymond James’s P/E ratio based on the next 12 months is 13.6x. Looking at the financials space right now, Raymond James trades at a compelling valuation. For those confident in the business and its management team, this is a good time to invest.
Wall Street analysts have a consensus one-year price target of $183.42 on the company (compared to the current share price of $168.00), implying they see 9.2% upside in buying Raymond James in the short term.