
Silgan Holdings (SLGN)
Silgan Holdings is in for a bumpy ride. Its sales have underperformed and its low returns on capital show it has few growth opportunities.― StockStory Analyst Team
1. News


2. Summary
Why We Think Silgan Holdings Will Underperform
Established in 1987, Silgan Holdings (NYSE:SLGN) is a supplier of rigid packaging for consumer goods products, specializing in metal containers, closures, and plastic packaging.
- High input costs result in an inferior gross margin of 16.8% that must be offset through higher volumes
- Estimated sales growth of 2.5% for the next 12 months implies demand will slow from its two-year trend
- Earnings growth over the last five years fell short of the peer group average as its EPS only increased by 4% annually


Silgan Holdings’s quality doesn’t meet our hurdle. We see more favorable opportunities in the market.
Why There Are Better Opportunities Than Silgan Holdings


Silgan Holdings’s stock price of $38.40 implies a valuation ratio of 10.3x forward P/E. This multiple is cheaper than most industrials peers, but we think this is justified.
Cheap stocks can look like great bargains at first glance, but you often get what you pay for. These mediocre businesses often have less earnings power, meaning there is more reliance on a re-rating to generate good returns - an unlikely scenario for low-quality companies.
3. Silgan Holdings (SLGN) Research Report: Q4 CY2025 Update
Rigid packaging solutions manufacturer Silgan Holdings (NYSE:SLGN) reported Q4 CY2025 results topping the market’s revenue expectations, with sales up 4.1% year on year to $1.47 billion. Its non-GAAP profit of $0.67 per share was 4.3% above analysts’ consensus estimates.
Silgan Holdings (SLGN) Q4 CY2025 Highlights:
- Revenue: $1.47 billion vs analyst estimates of $1.46 billion (4.1% year-on-year growth, 0.6% beat)
- Adjusted EPS: $0.67 vs analyst estimates of $0.64 (4.3% beat)
- Adjusted EBITDA: $182.1 million vs analyst estimates of $208.2 million (12.4% margin, 12.5% miss)
- Adjusted EPS guidance for the upcoming financial year 2026 is $3.80 at the midpoint, in line with analyst estimates
- Operating Margin: 6.9%, in line with the same quarter last year
- Free Cash Flow Margin: 83.2%, up from 61.1% in the same quarter last year
- Market Capitalization: $4.62 billion
Company Overview
Established in 1987, Silgan Holdings (NYSE:SLGN) is a supplier of rigid packaging for consumer goods products, specializing in metal containers, closures, and plastic packaging.
Founded in 1987 and headquartered in Stamford, Connecticut, Silgan operates through three primary business segments: Dispensing and Specialty Closures, Metal Containers, and Custom Containers.
The Dispensing and Specialty Closures segment, is a worldwide manufacturer of dispensing systems and specialty closures for markets including fragrance and beauty, food, beverage, personal care, home care, and lawn and garden. This segment operates 40+ manufacturing facilities across North America, Europe, Asia, and South America, serving over 100 countries.
The Metal Containers segment is a leading manufacturer of metal containers in North America and Europe. In North America, Silgan claims to be the largest manufacturer of metal food containers with a market share of more than half. This segment operates 40+ manufacturing facilities in the United States, Europe, and Asia, serving over 50 countries.
The Custom Containers segment produces custom-designed plastic containers for markets such as food and beverage, consumer health and pharmaceutical, personal care, home care, and automotive. This segment operates 20+ manufacturing facilities in the United States and Canada.
The company employs various manufacturing processes across its segments, including compression and injection molding for closures, draw and iron or draw and redraw processes for metal containers, and extrusion blowmolding and injection blowmolding for custom containers.
4. Industrial Packaging
Industrial packaging companies have built competitive advantages from economies of scale that lead to advantaged purchasing and capital investments that are difficult and expensive to replicate. Recently, eco-friendly packaging and conservation are driving customers preferences and innovation. For example, plastic is not as desirable a material as it once was. Despite being integral to consumer goods ranging from beer to toothpaste to laundry detergent, these companies are still at the whim of the macro, especially consumer health and consumer willingness to spend.
Competitors in the packaging industry include Crown Holdings (NYSE:CCK), Ardagh Group (NYSE:ARD), and Silgan Holdings (NASDAQ:SLGN)
5. Revenue Growth
A company’s long-term sales performance is one signal of its overall quality. Any business can put up a good quarter or two, but the best consistently grow over the long haul. Unfortunately, Silgan Holdings’s 5.7% annualized revenue growth over the last five years was tepid. This fell short of our benchmark for the industrials sector and is a poor baseline for our analysis.
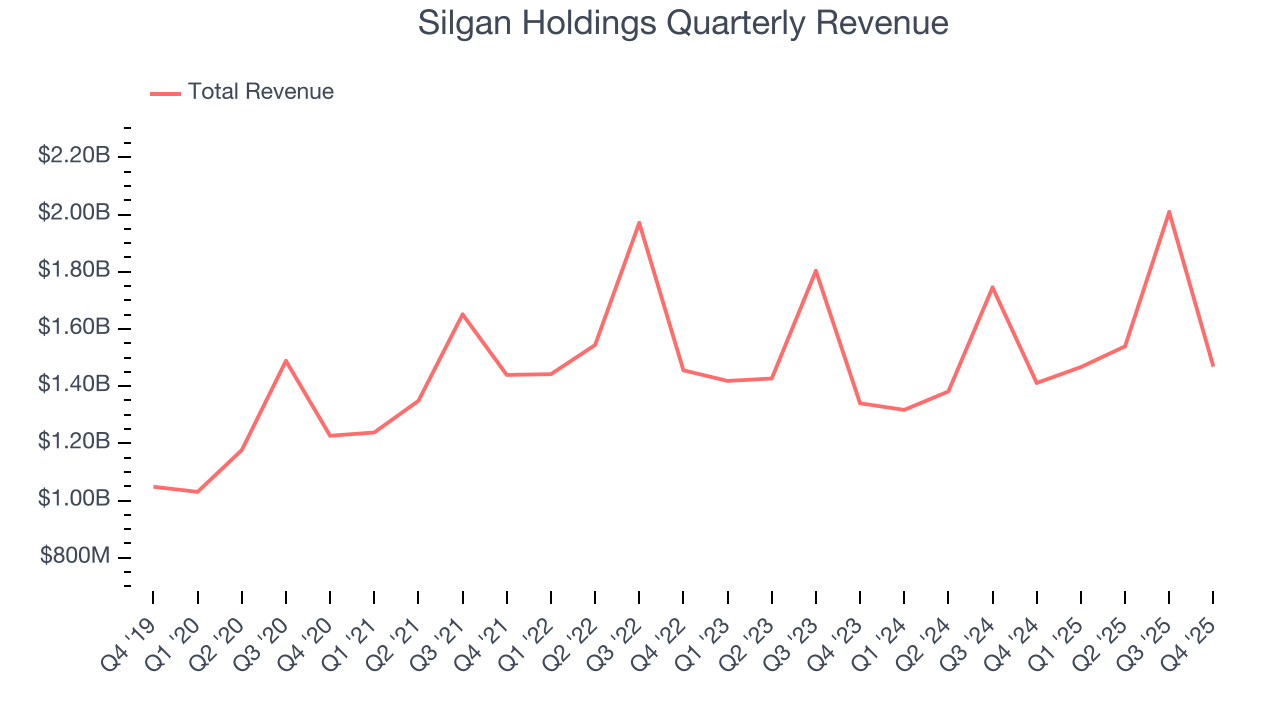
Long-term growth is the most important, but within industrials, a half-decade historical view may miss new industry trends or demand cycles. Silgan Holdings’s recent performance shows its demand has slowed as its annualized revenue growth of 4.1% over the last two years was below its five-year trend. 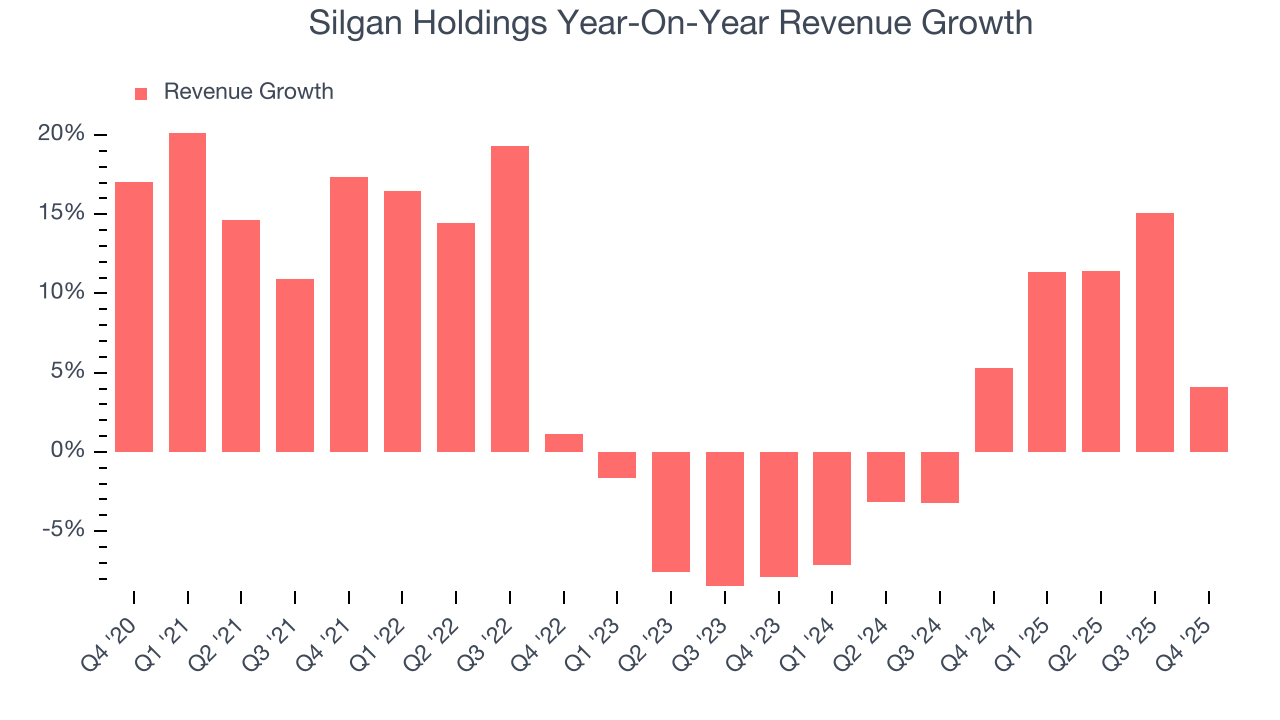
This quarter, Silgan Holdings reported modest year-on-year revenue growth of 4.1% but beat Wall Street’s estimates by 0.6%.
Looking ahead, sell-side analysts expect revenue to grow 1.9% over the next 12 months, a slight deceleration versus the last two years. This projection is underwhelming and implies its products and services will see some demand headwinds.
6. Gross Margin & Pricing Power
Silgan Holdings has bad unit economics for an industrials business, signaling it operates in a competitive market. As you can see below, it averaged a 16.8% gross margin over the last five years. Said differently, Silgan Holdings had to pay a chunky $83.17 to its suppliers for every $100 in revenue. 
In Q4, Silgan Holdings produced a 17.2% gross profit margin, in line with the same quarter last year. Zooming out, the company’s full-year margin has remained steady over the past 12 months, suggesting its input costs (such as raw materials and manufacturing expenses) have been stable and it isn’t under pressure to lower prices.
7. Operating Margin
Silgan Holdings’s operating margin might fluctuated slightly over the last 12 months but has generally stayed the same, averaging 9.5% over the last five years. This profitability was higher than the broader industrials sector, showing it did a decent job managing its expenses.
Analyzing the trend in its profitability, Silgan Holdings’s operating margin might fluctuated slightly but has generally stayed the same over the last five years. We like to see margin expansion, but we’re still happy with Silgan Holdings’s performance considering most Industrial Packaging companies saw their margins plummet.
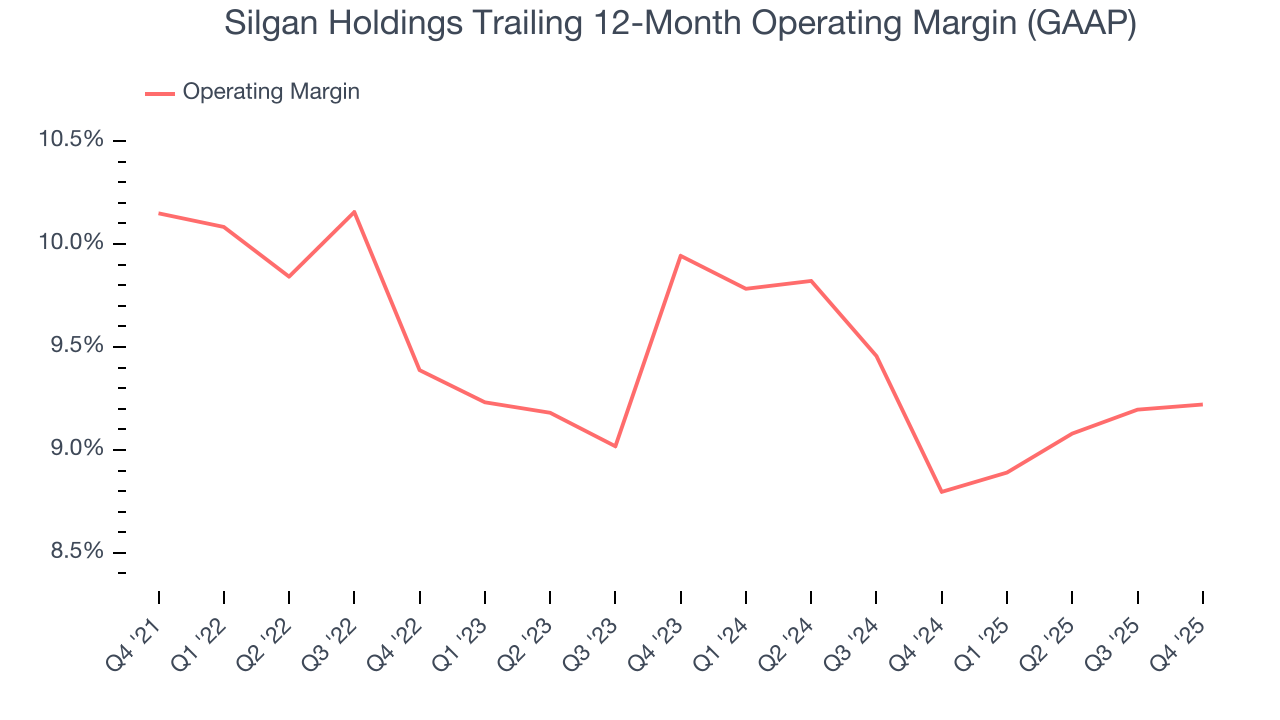
This quarter, Silgan Holdings generated an operating margin profit margin of 6.9%, in line with the same quarter last year. This indicates the company’s cost structure has recently been stable.
8. Earnings Per Share
Revenue trends explain a company’s historical growth, but the long-term change in earnings per share (EPS) points to the profitability of that growth – for example, a company could inflate its sales through excessive spending on advertising and promotions.
Silgan Holdings’s weak 4% annual EPS growth over the last five years aligns with its revenue performance. This tells us it maintained its per-share profitability as it expanded.
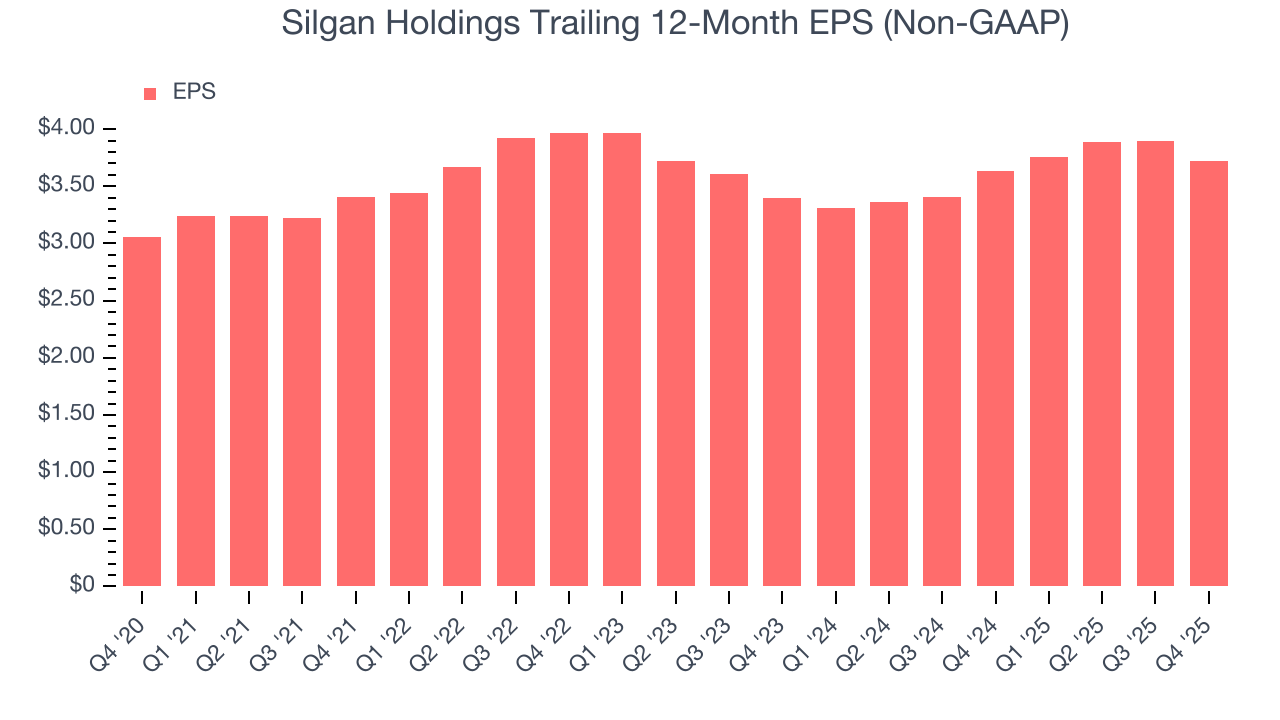
Like with revenue, we analyze EPS over a shorter period to see if we are missing a change in the business.
For Silgan Holdings, its two-year annual EPS growth of 4.6% is similar to its five-year trend, implying stable earnings.
In Q4, Silgan Holdings reported adjusted EPS of $0.67, down from $0.85 in the same quarter last year. Despite falling year on year, this print beat analysts’ estimates by 4.3%. Over the next 12 months, Wall Street expects Silgan Holdings’s full-year EPS of $3.72 to grow 2.1%.
9. Cash Is King
If you’ve followed StockStory for a while, you know we emphasize free cash flow. Why, you ask? We believe that in the end, cash is king, and you can’t use accounting profits to pay the bills.
Silgan Holdings has shown weak cash profitability over the last five years, giving the company limited opportunities to return capital to shareholders. Its free cash flow margin averaged 3.8%, subpar for an industrials business.
Taking a step back, an encouraging sign is that Silgan Holdings’s margin expanded by 2.6 percentage points during that time. The company’s improvement shows it’s heading in the right direction, and we can see it became a less capital-intensive business because its free cash flow profitability rose while its operating profitability was flat.
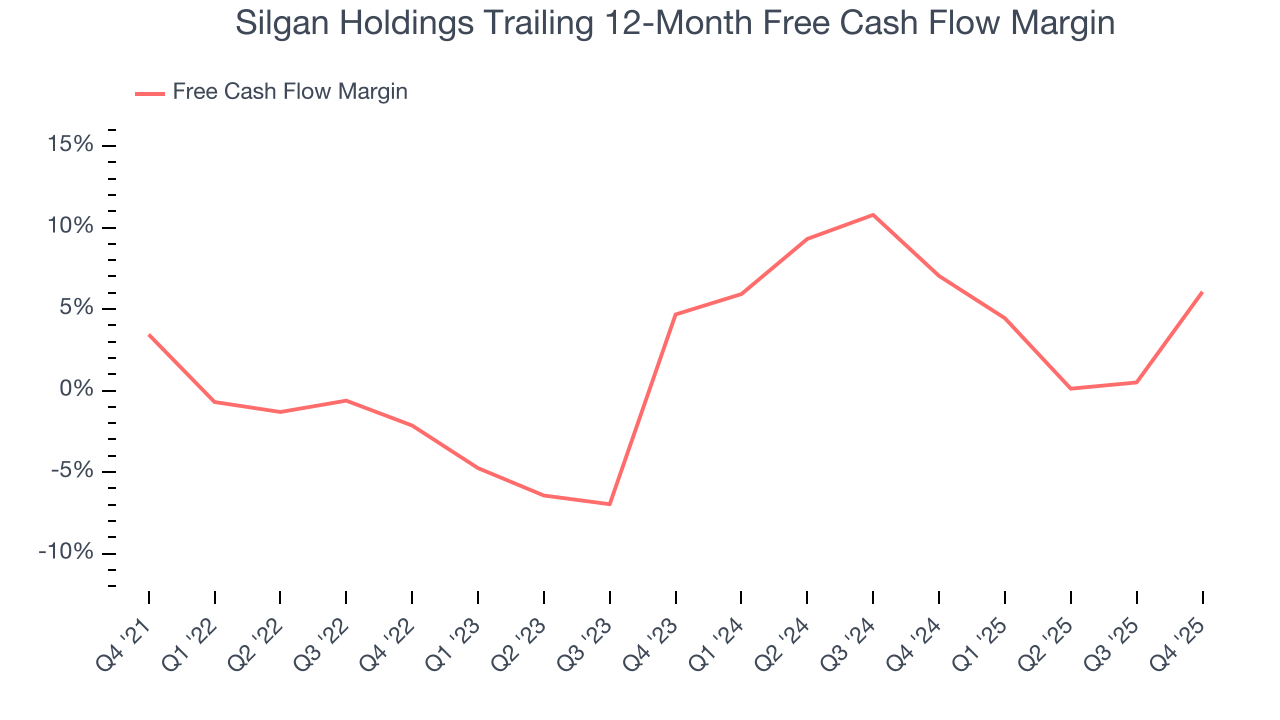
Silgan Holdings’s free cash flow clocked in at $1.22 billion in Q4, equivalent to a 83.2% margin. This result was good as its margin was 22.2 percentage points higher than in the same quarter last year, building on its favorable historical trend.
10. Return on Invested Capital (ROIC)
EPS and free cash flow tell us whether a company was profitable while growing its revenue. But was it capital-efficient? Enter ROIC, a metric showing how much operating profit a company generates relative to the money it has raised (debt and equity).
Silgan Holdings historically did a mediocre job investing in profitable growth initiatives. Its five-year average ROIC was 9.3%, somewhat low compared to the best industrials companies that consistently pump out 20%+.
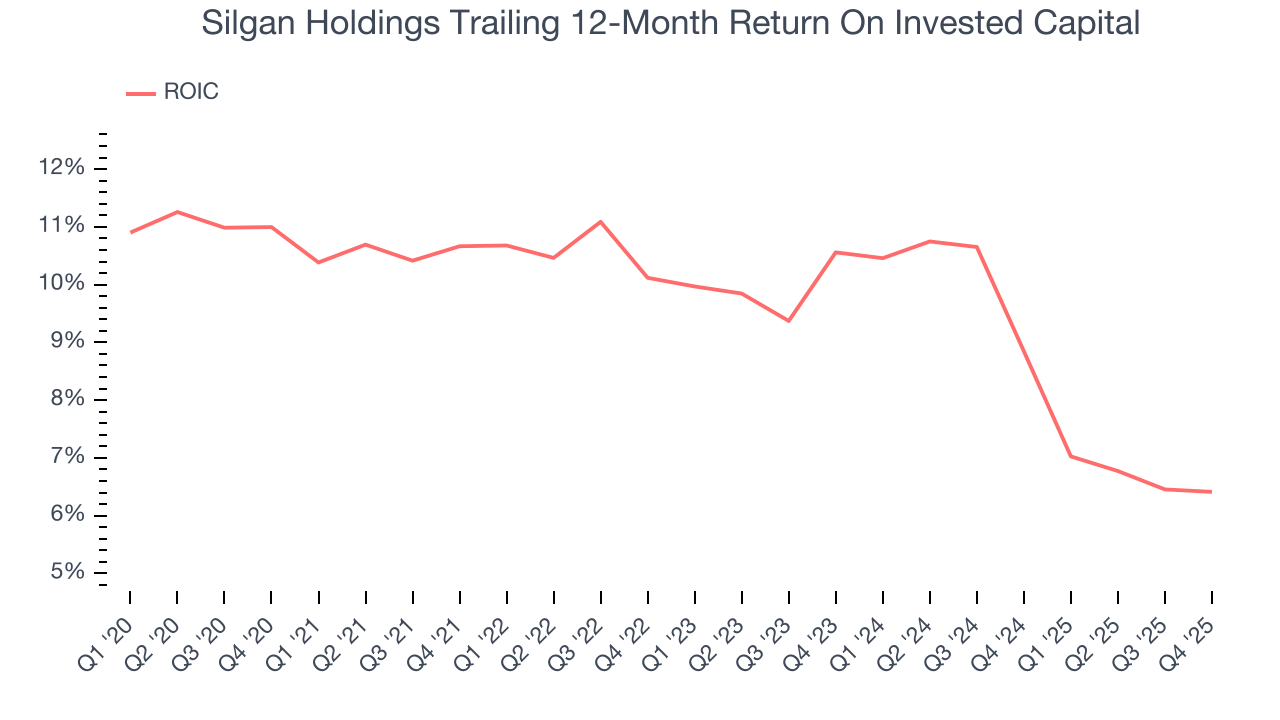
We like to invest in businesses with high returns, but the trend in a company’s ROIC is what often surprises the market and moves the stock price. Unfortunately, Silgan Holdings’s ROIC averaged 2.8 percentage point decreases over the last few years. Paired with its already low returns, these declines suggest its profitable growth opportunities are few and far between.
11. Balance Sheet Assessment
Silgan Holdings reported $1.08 billion of cash and $4.35 billion of debt on its balance sheet in the most recent quarter. As investors in high-quality companies, we primarily focus on two things: 1) that a company’s debt level isn’t too high and 2) that its interest payments are not excessively burdening the business.
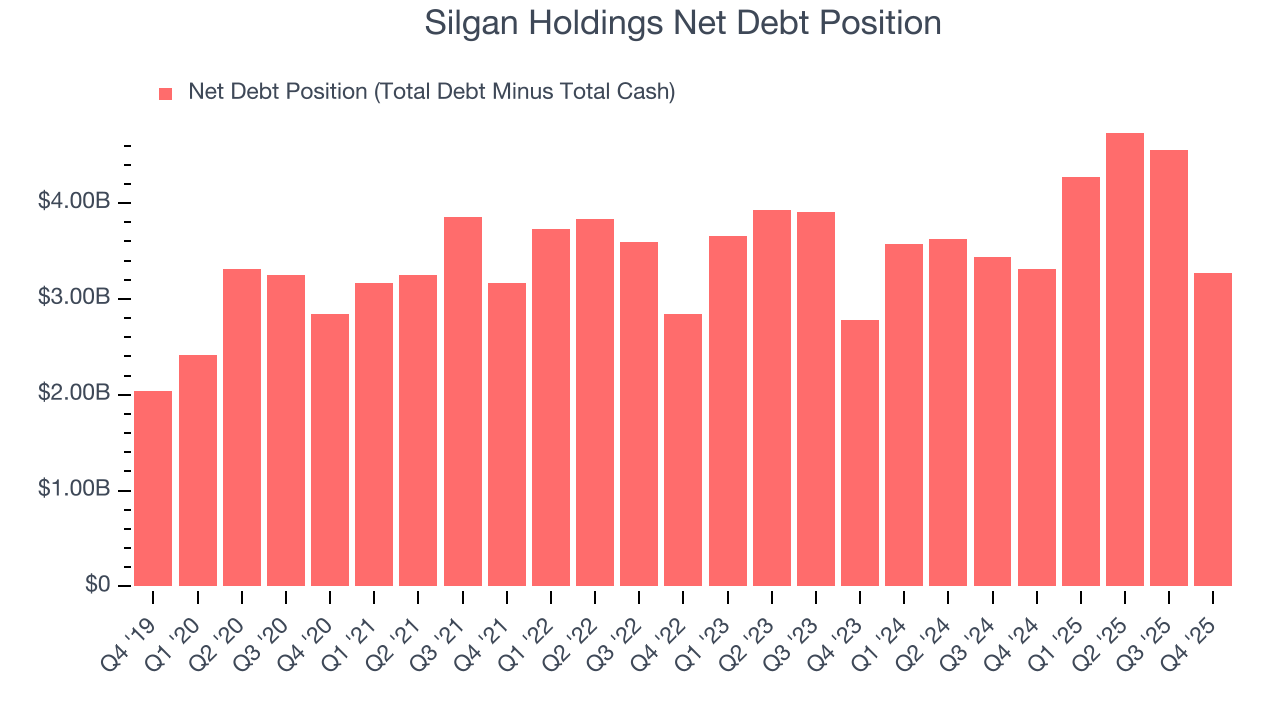
With $945.6 million of EBITDA over the last 12 months, we view Silgan Holdings’s 3.5× net-debt-to-EBITDA ratio as safe. We also see its $93.92 million of annual interest expenses as appropriate. The company’s profits give it plenty of breathing room, allowing it to continue investing in growth initiatives.
12. Key Takeaways from Silgan Holdings’s Q4 Results
It was good to see Silgan Holdings beat analysts’ EPS expectations this quarter. We were also happy its revenue narrowly outperformed Wall Street’s estimates. On the other hand, its EBITDA missed and its EPS guidance for next quarter fell short of Wall Street’s estimates. Overall, this quarter could have been better. The stock remained flat at $43.76 immediately after reporting.
13. Is Now The Time To Buy Silgan Holdings?
Updated: March 23, 2026 at 12:01 AM EDT
When considering an investment in Silgan Holdings, investors should account for its valuation and business qualities as well as what’s happened in the latest quarter.
Silgan Holdings falls short of our quality standards. To kick things off, its revenue growth was uninspiring over the last five years, and analysts expect its demand to deteriorate over the next 12 months. While its rising cash profitability gives it more optionality, the downside is its low gross margins indicate some combination of competitive pressures and high production costs. On top of that, its projected EPS for the next year is lacking.
Silgan Holdings’s P/E ratio based on the next 12 months is 10.3x. This valuation multiple is fair, but we don’t have much confidence in the company. There are better stocks to buy right now.
Wall Street analysts have a consensus one-year price target of $55.27 on the company (compared to the current share price of $38.40).
Although the price target is bullish, readers should exercise caution because analysts tend to be overly optimistic. The firms they work for, often big banks, have relationships with companies that extend into fundraising, M&A advisory, and other rewarding business lines. As a result, they typically hesitate to say bad things for fear they will lose out. We at StockStory do not suffer from such conflicts of interest, so we’ll always tell it like it is.