
TD SYNNEX (SNX)
We’re not sold on TD SYNNEX. Its poor returns on capital indicate it barely generated any profits, a must for high-quality companies.― StockStory Analyst Team
1. News


2. Summary
Why TD SYNNEX Is Not Exciting
Serving as the crucial middleman in the technology supply chain, TD SYNNEX (NYSE:SNX) is a global technology distributor that connects thousands of IT manufacturers with resellers, helping businesses access hardware, software, and technology solutions.
- Incremental sales over the last five years were less profitable as its earnings per share were flat while its revenue grew
- Responsiveness to unforeseen market trends is restricted due to its substandard adjusted operating margin profitability
- A positive is that its unparalleled revenue scale of $62.51 billion gives it an edge in distribution


TD SYNNEX’s quality doesn’t meet our hurdle. Our attention is focused on better businesses.
Why There Are Better Opportunities Than TD SYNNEX


TD SYNNEX is trading at $161.28 per share, or 11x forward P/E. This multiple is lower than most business services companies, but for good reason.
It’s better to pay up for high-quality businesses with higher long-term earnings potential rather than to buy lower-quality stocks because they appear cheap. These challenged businesses often don’t re-rate, a phenomenon known as a “value trap”.
3. TD SYNNEX (SNX) Research Report: Q4 CY2025 Update
IT distribution giant TD SYNNEX (NYSE:SNX) announced better-than-expected revenue in Q4 CY2025, with sales up 9.7% year on year to $17.38 billion. The company expects next quarter’s revenue to be around $15.5 billion, close to analysts’ estimates. Its non-GAAP profit of $3.83 per share was 2.7% above analysts’ consensus estimates.
TD SYNNEX (SNX) Q4 CY2025 Highlights:
- Revenue: $17.38 billion vs analyst estimates of $16.95 billion (9.7% year-on-year growth, 2.6% beat)
- Adjusted EPS: $3.83 vs analyst estimates of $3.73 (2.7% beat)
- Adjusted EBITDA: $527.1 million vs analyst estimates of $515.2 million (3% margin, 2.3% beat)
- Revenue Guidance for Q1 CY2026 is $15.5 billion at the midpoint, roughly in line with what analysts were expecting
- Adjusted EPS guidance for Q1 CY2026 is $3.25 at the midpoint, above analyst estimates of $3.21
- Operating Margin: 2.3%, in line with the same quarter last year
- Free Cash Flow Margin: 8.2%, up from 3.2% in the same quarter last year
- Market Capitalization: $12.3 billion
Company Overview
Serving as the crucial middleman in the technology supply chain, TD SYNNEX (NYSE:SNX) is a global technology distributor that connects thousands of IT manufacturers with resellers, helping businesses access hardware, software, and technology solutions.
The company operates as a massive technology wholesaler, maintaining relationships with approximately 2,500 technology manufacturers including industry giants like Apple, Microsoft, Cisco, and IBM. This extensive network allows TD SYNNEX to offer a comprehensive catalog of over 200,000 technology products to more than 150,000 reseller customers worldwide.
TD SYNNEX's business is organized into two main portfolios. The Endpoint Solutions portfolio handles personal computing devices, mobile phones, and printers that end-users directly interact with. The Advanced Solutions portfolio focuses on infrastructure technology like servers, networking equipment, security systems, and cloud technologies.
Beyond simple distribution, TD SYNNEX provides value-added services throughout the IT supply chain. For example, a small business IT provider might purchase server equipment, networking gear, and software licenses through TD SYNNEX, along with integration services to ensure everything works together before delivery to their client. The company's engineers design custom server and storage solutions, while its logistics experts manage everything from warehouse operations to returns processing.
TD SYNNEX also offers financial services to its reseller customers, including credit terms, leasing options, and floor plan financing, which helps these businesses manage cash flow while serving their end customers. Additionally, the company provides cloud services that help businesses transition to hosted environments and navigate complex technologies like artificial intelligence and cybersecurity.
With distribution centers across the Americas, Europe, and Asia-Pacific regions, TD SYNNEX maintains a global footprint that allows it to serve as a single source for technology products worldwide. The company's highly automated distribution processes utilize technologies like robotic automation and real-time inventory tracking to ensure efficient and accurate order fulfillment.
4. IT Distribution & Solutions
IT Distribution & Solutions will be buoyed by the increasing complexity of IT ecosystems, rising cloud adoption, and demand for cybersecurity solutions. Enterprises are less likely than ever to embark on these complicated journeys solo, and companies in the sector boast expertise and scale in these areas. However, cloud migration also means less need for hardware, which could dent demand for large portions of the product portfolio and hurt margins. Additionally, planning for potentially supply chain disruptions is ongoing, as the COVID-19 pandemic showed how damaging a pause in global trade could be in areas like semiconductor procurement.
TD SYNNEX competes with other major IT distributors including Arrow Electronics (NYSE: ARW), Ingram Micro (privately held), and ScanSource (NASDAQ: SCSC), along with various regional distributors across its global markets.
5. Revenue Growth
A company’s long-term sales performance can indicate its overall quality. Any business can have short-term success, but a top-tier one grows for years.
With $62.51 billion in revenue over the past 12 months, TD SYNNEX is a behemoth in the business services sector and benefits from economies of scale, giving it an edge in distribution. This also enables it to gain more leverage on its fixed costs than smaller competitors and the flexibility to offer lower prices.
As you can see below, TD SYNNEX grew its sales at an incredible 25.6% compounded annual growth rate over the last five years. This shows it had high demand, a useful starting point for our analysis.
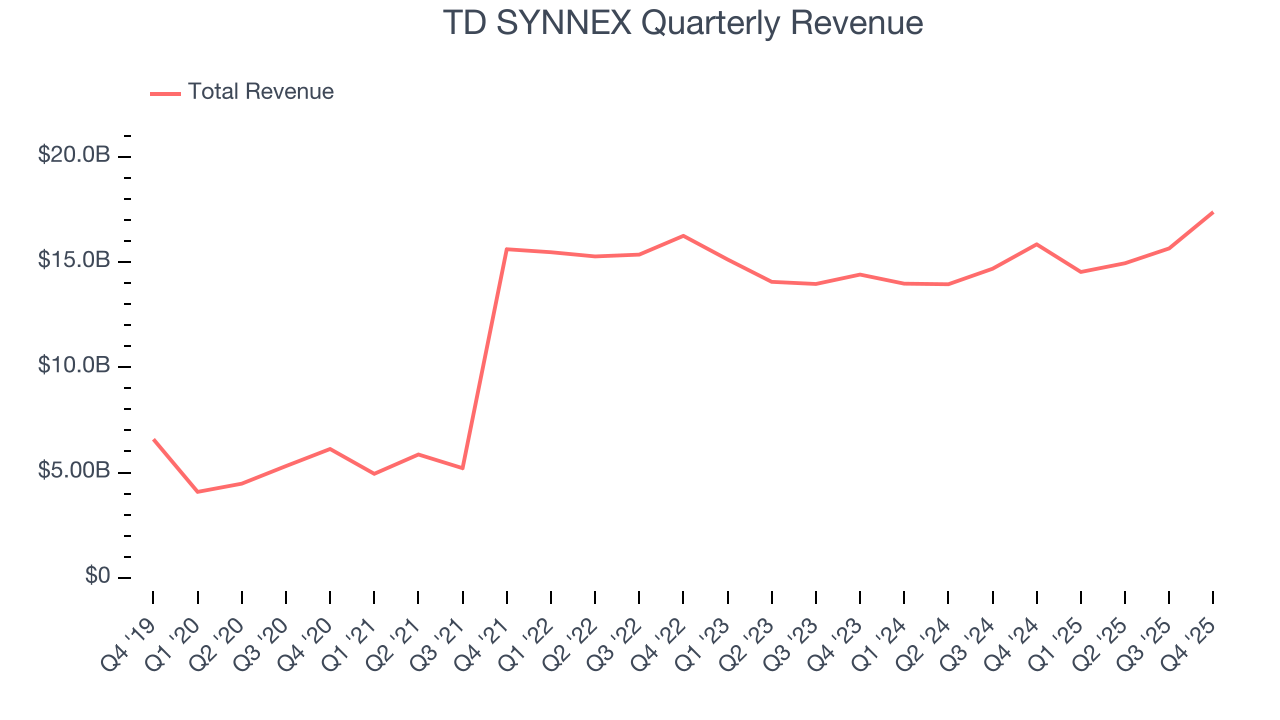
Long-term growth is the most important, but within business services, a half-decade historical view may miss new innovations or demand cycles. TD SYNNEX’s recent performance shows its demand has slowed significantly as its annualized revenue growth of 4.2% over the last two years was well below its five-year trend. 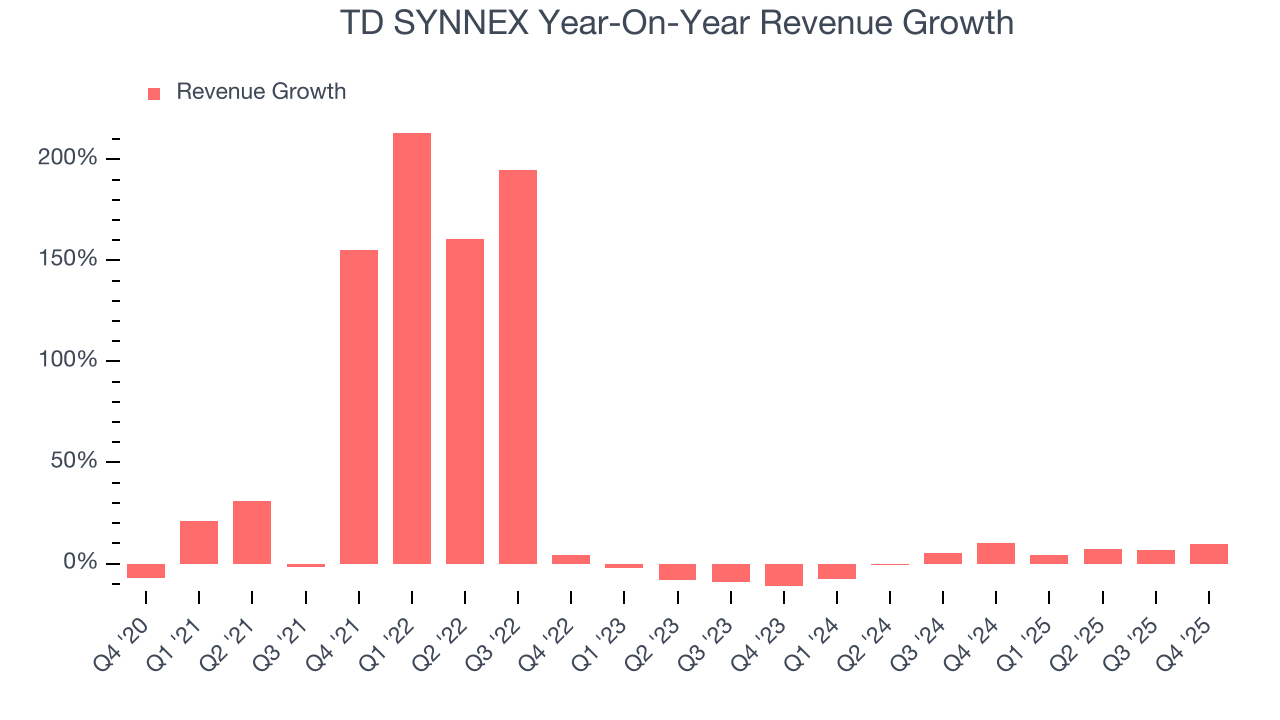
This quarter, TD SYNNEX reported year-on-year revenue growth of 9.7%, and its $17.38 billion of revenue exceeded Wall Street’s estimates by 2.6%. Company management is currently guiding for a 6.7% year-on-year increase in sales next quarter.
Looking further ahead, sell-side analysts expect revenue to grow 3.6% over the next 12 months, similar to its two-year rate. This projection is underwhelming and suggests its newer products and services will not catalyze better top-line performance yet.
6. Operating Margin
TD SYNNEX’s operating margin might fluctuated slightly over the last 12 months but has remained more or less the same, averaging 2% over the last five years. This profitability was inadequate for a business services business and caused by its suboptimal cost structure.
Looking at the trend in its profitability, TD SYNNEX’s operating margin might fluctuated slightly but has generally stayed the same over the last five years. This raises questions about the company’s expense base because its revenue growth should have given it leverage on its fixed costs, resulting in better economies of scale and profitability.
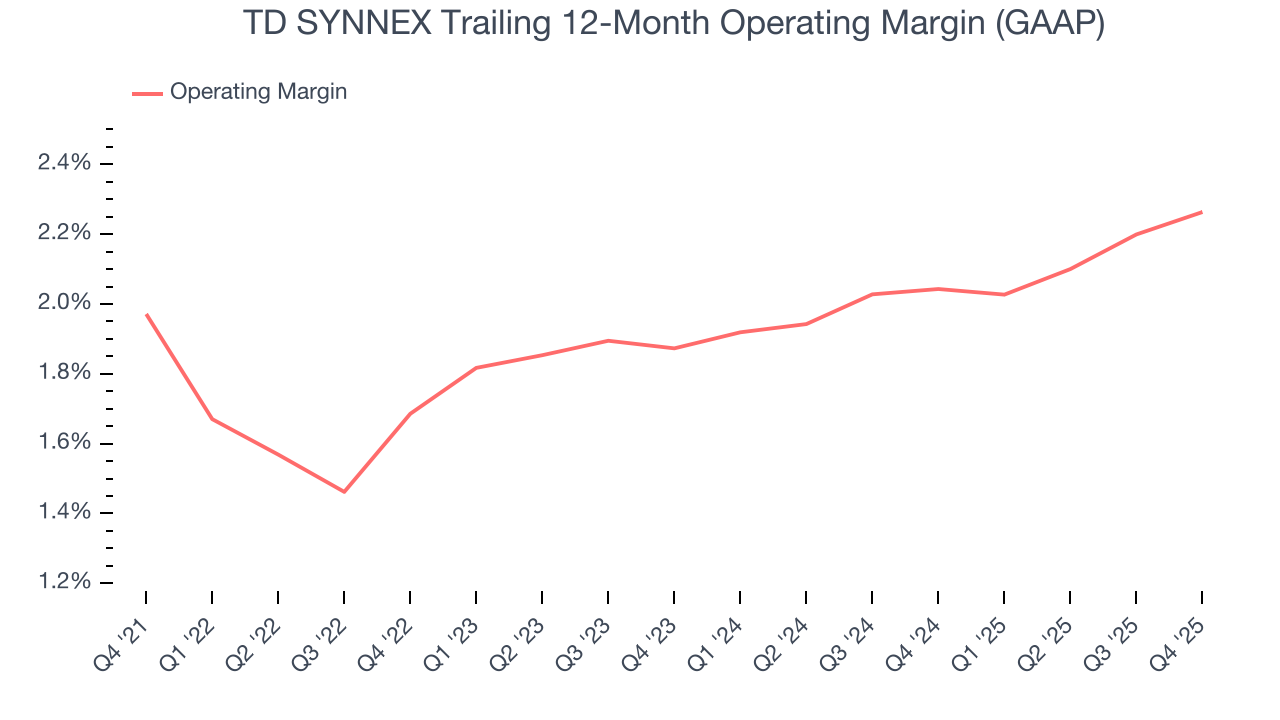
This quarter, TD SYNNEX generated an operating margin profit margin of 2.3%, in line with the same quarter last year. This indicates the company’s overall cost structure has been relatively stable.
7. Earnings Per Share
Revenue trends explain a company’s historical growth, but the long-term change in earnings per share (EPS) points to the profitability of that growth – for example, a company could inflate its sales through excessive spending on advertising and promotions.
TD SYNNEX’s flat EPS over the last five years was below its 25.6% annualized revenue growth. However, its operating margin didn’t change during this time, telling us that non-fundamental factors such as interest and taxes affected its ultimate earnings.
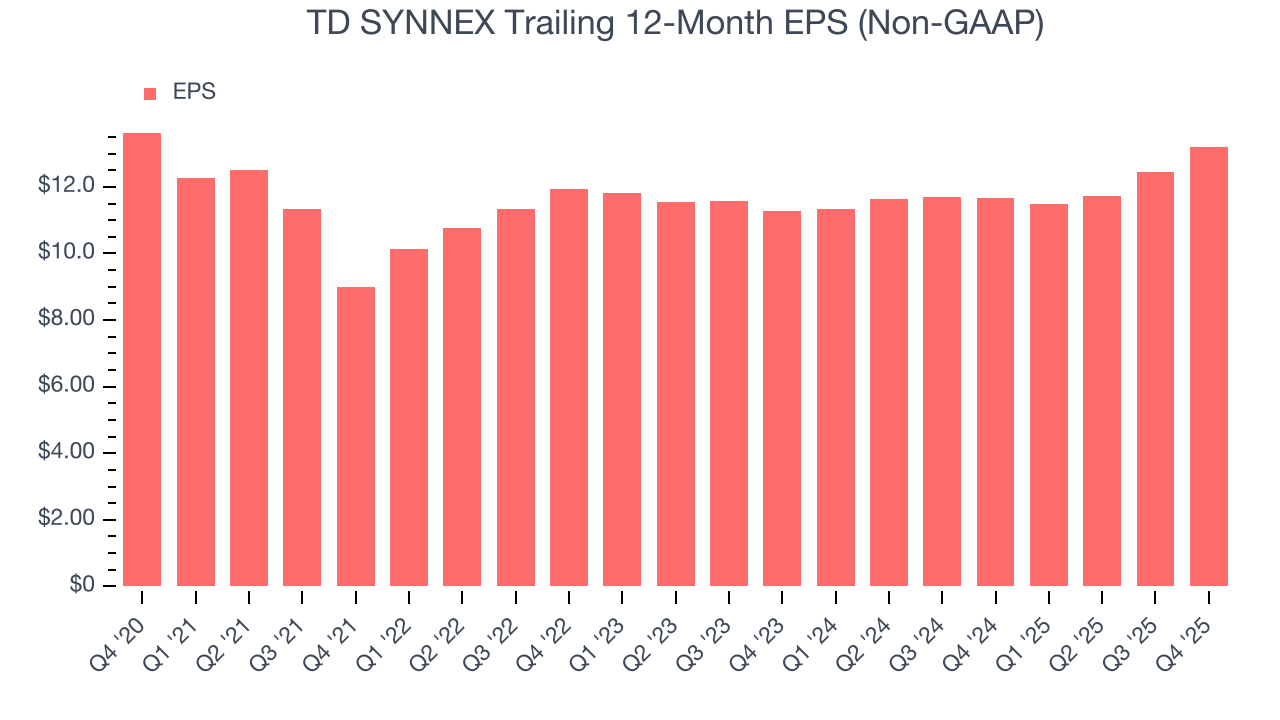
Like with revenue, we analyze EPS over a more recent period because it can provide insight into an emerging theme or development for the business.
For TD SYNNEX, its two-year annual EPS growth of 8.2% was higher than its five-year trend. Accelerating earnings growth is almost always an encouraging data point.
In Q4, TD SYNNEX reported adjusted EPS of $3.83, up from $3.09 in the same quarter last year. This print beat analysts’ estimates by 2.7%. Over the next 12 months, Wall Street expects TD SYNNEX’s full-year EPS of $13.20 to grow 10.4%.
8. Cash Is King
If you’ve followed StockStory for a while, you know we emphasize free cash flow. Why, you ask? We believe that in the end, cash is king, and you can’t use accounting profits to pay the bills.
TD SYNNEX has shown poor cash profitability over the last five years, giving the company limited opportunities to return capital to shareholders. Its free cash flow margin averaged 1.6%, lousy for a business services business.
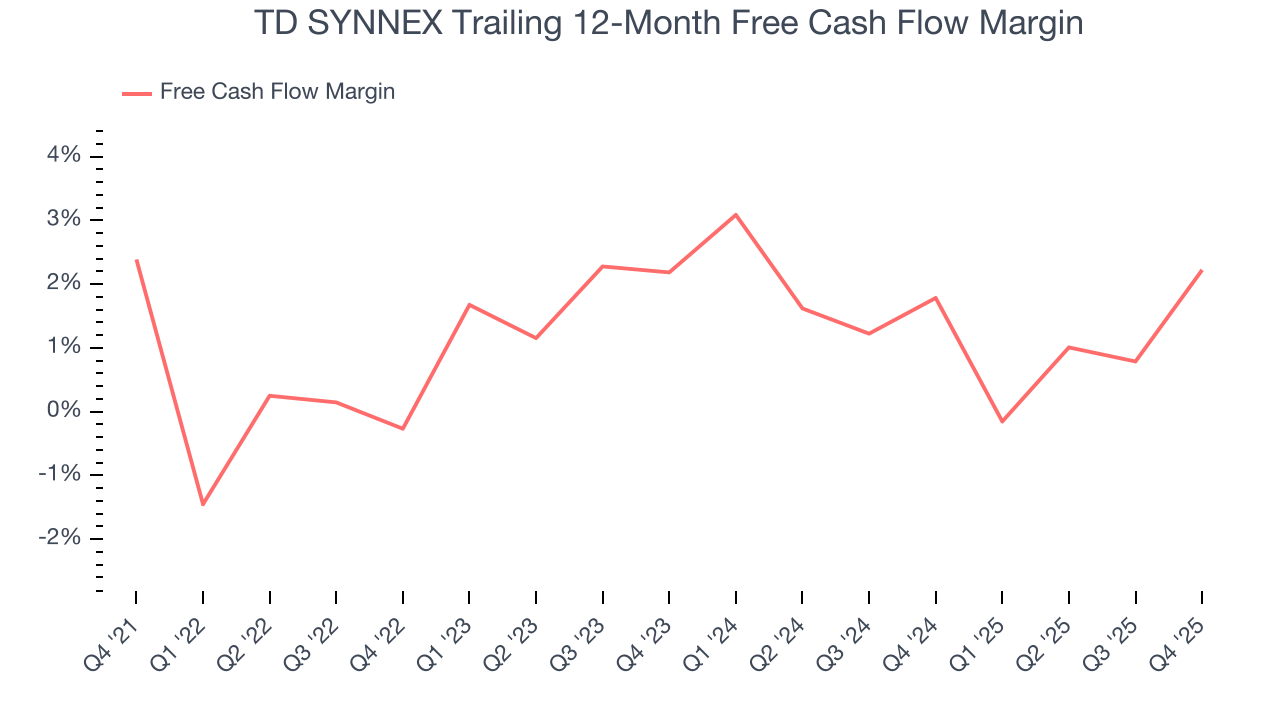
TD SYNNEX’s free cash flow clocked in at $1.42 billion in Q4, equivalent to a 8.2% margin. This result was good as its margin was 4.9 percentage points higher than in the same quarter last year, but we wouldn’t read too much into the short term because investment needs can be seasonal, causing temporary swings. Long-term trends carry greater meaning.
9. Return on Invested Capital (ROIC)
EPS and free cash flow tell us whether a company was profitable while growing its revenue. But was it capital-efficient? A company’s ROIC explains this by showing how much operating profit it makes compared to the money it has raised (debt and equity).
TD SYNNEX historically did a mediocre job investing in profitable growth initiatives. Its five-year average ROIC was 8.4%, somewhat low compared to the best business services companies that consistently pump out 25%+.
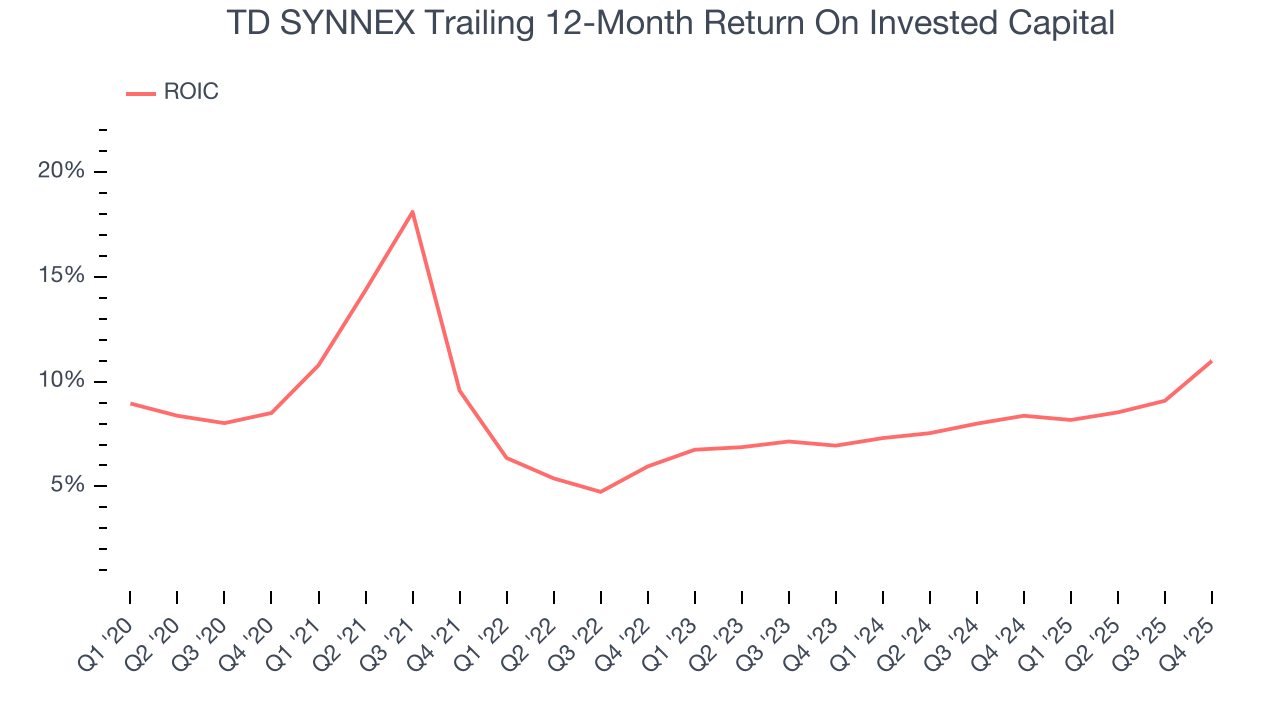
We like to invest in businesses with high returns, but the trend in a company’s ROIC is what often surprises the market and moves the stock price. Over the last few years, TD SYNNEX’s ROIC averaged 1.9 percentage point increases each year. This is a good sign, and if its returns keep rising, there’s a chance it could evolve into an investable business.
10. Balance Sheet Assessment
TD SYNNEX reported $2.44 billion of cash and $4.61 billion of debt on its balance sheet in the most recent quarter. As investors in high-quality companies, we primarily focus on two things: 1) that a company’s debt level isn’t too high and 2) that its interest payments are not excessively burdening the business.
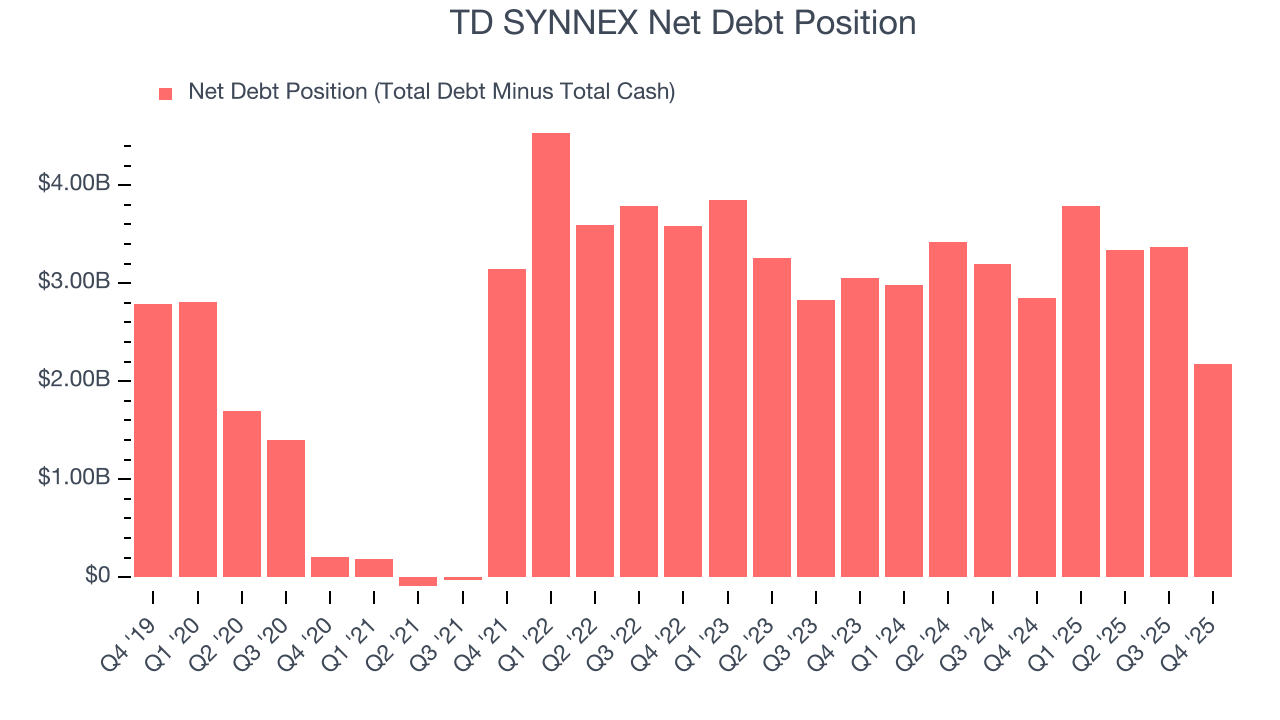
With $1.90 billion of EBITDA over the last 12 months, we view TD SYNNEX’s 1.1× net-debt-to-EBITDA ratio as safe. We also see its $318.2 million of annual interest expenses as appropriate. The company’s profits give it plenty of breathing room, allowing it to continue investing in growth initiatives.
11. Key Takeaways from TD SYNNEX’s Q4 Results
We enjoyed seeing TD SYNNEX beat analysts’ revenue expectations this quarter. We were also happy its EPS guidance for next quarter narrowly outperformed Wall Street’s estimates. Overall, this print had some key positives. The stock traded up 1.7% to $153.50 immediately following the results.
12. Is Now The Time To Buy TD SYNNEX?
Updated: February 19, 2026 at 11:21 PM EST
The latest quarterly earnings matters, sure, but we actually think longer-term fundamentals and valuation matter more. Investors should consider all these pieces before deciding whether or not to invest in TD SYNNEX.
TD SYNNEX isn’t a bad business, but we’re not clamoring to buy it here and now. First off, its revenue growth was exceptional over the last five years. And while TD SYNNEX’s weak EPS growth over the last five years shows it’s failed to produce meaningful profits for shareholders, its scale makes it a trusted partner with negotiating leverage.
TD SYNNEX’s P/E ratio based on the next 12 months is 11x. This valuation multiple is fair, but we don’t have much faith in the company. We're fairly confident there are better stocks to buy right now.
Wall Street analysts have a consensus one-year price target of $179.73 on the company (compared to the current share price of $161.28).