Spectrum Brands (SPB)
We wouldn’t buy Spectrum Brands. Not only are its sales cratering but also its low returns on capital suggest it struggles to generate profits.― StockStory Analyst Team
1. News


2. Summary
Why We Think Spectrum Brands Will Underperform
A leader in multiple consumer product categories, Spectrum Brands (NYSE:SPB) is a diversified company with a portfolio of trusted brands spanning home appliances, garden care, personal care, and pet care.
- Annual revenue declines of 3.4% over the last three years indicate problems with its market positioning
- Organic sales performance over the past two years indicates the company may need to make strategic adjustments or rely on M&A to catalyze faster growth
- Below-average returns on capital indicate management struggled to find compelling investment opportunities


Spectrum Brands’s quality is lacking. There are better opportunities in the market.
Why There Are Better Opportunities Than Spectrum Brands


At $73.72 per share, Spectrum Brands trades at 16.8x forward P/E. This multiple is quite expensive for the quality you get.
We’d rather pay up for companies with elite fundamentals than get a decent price on a poor one. High-quality businesses often have more durable earnings power, helping us sleep well at night.
3. Spectrum Brands (SPB) Research Report: Q4 CY2025 Update
Household products company Spectrum Brands (NYSE:SPB) reported Q4 CY2025 results beating Wall Street’s revenue expectations, but sales fell by 3.3% year on year to $677 million. Its non-GAAP profit of $1.40 per share was 84.7% above analysts’ consensus estimates.
Spectrum Brands (SPB) Q4 CY2025 Highlights:
- Revenue: $677 million vs analyst estimates of $668.8 million (3.3% year-on-year decline, 1.2% beat)
- Adjusted EPS: $1.40 vs analyst estimates of $0.76 (84.7% beat)
- Adjusted EBITDA: $62.6 million vs analyst estimates of $61.43 million (9.2% margin, 1.9% beat)
- Operating Margin: 4%, down from 6.4% in the same quarter last year
- Free Cash Flow was $59.3 million, up from -$78.3 million in the same quarter last year
- Organic Revenue fell 6% year on year (miss)
- Market Capitalization: $1.6 billion
Company Overview
A leader in multiple consumer product categories, Spectrum Brands (NYSE:SPB) is a diversified company with a portfolio of trusted brands spanning home appliances, garden care, personal care, and pet care.
The company’s history traces back to the early 20th century when it was originally founded as the "U.S. Electrical Manufacturing Company" in 1906, playing a key role in the development of the first electrically lit Christmas tree lights. In 1955, it changed its name to Rayovac Corporation and merged with Spectrum Brands in 2005 to form the company we know today.
Spectrum Brands’s portfolio was largely built up via acquisitions and now includes household names such as Black + Decker in home appliances, Spectracide in lawn and garden care, Nature's Miracle in pet care, and Remington in personal care. The company continues to be quite acquisitive and seeks to buy complementary brands, allowing it to enter new markets, benefit from synergies, and adapt to changing consumer preferences.
Spectrum Brands has a global footprint and its products are available in North America, Europe, Latin America, and other select markets, making it a significant player in the global consumer goods industry. It sells its products through various channels, including e-commerce and retail partnerships with companies like Best Buy and The Home Depot.
4. Household Products
Household products stocks are generally stable investments, as many of the industry's products are essential for a comfortable and functional living space. Recently, there's been a growing emphasis on eco-friendly and sustainable offerings, reflecting the evolving consumer preferences for environmentally conscious options. These trends can be double-edged swords that benefit companies who innovate quickly to take advantage of them and hurt companies that don't invest enough to meet consumers where they want to be with regards to trends.
Competitors include General Electric (NYSE:GE) in home appliances, Central Garden & Pet (NASDAQ:CENT) in pet care, Scotts Miracle-Gro (NYSE:SMG) in lawn and garden care, and Procter & Gamble (NYSE:PG) in personal care.
5. Revenue Growth
Reviewing a company’s long-term sales performance reveals insights into its quality. Any business can put up a good quarter or two, but many enduring ones grow for years.
With $2.79 billion in revenue over the past 12 months, Spectrum Brands carries some recognizable products but is a mid-sized consumer staples company. Its size could bring disadvantages compared to larger competitors benefiting from better brand awareness and economies of scale.
As you can see below, Spectrum Brands’s revenue declined by 3.4% per year over the last three years, a poor baseline for our analysis.
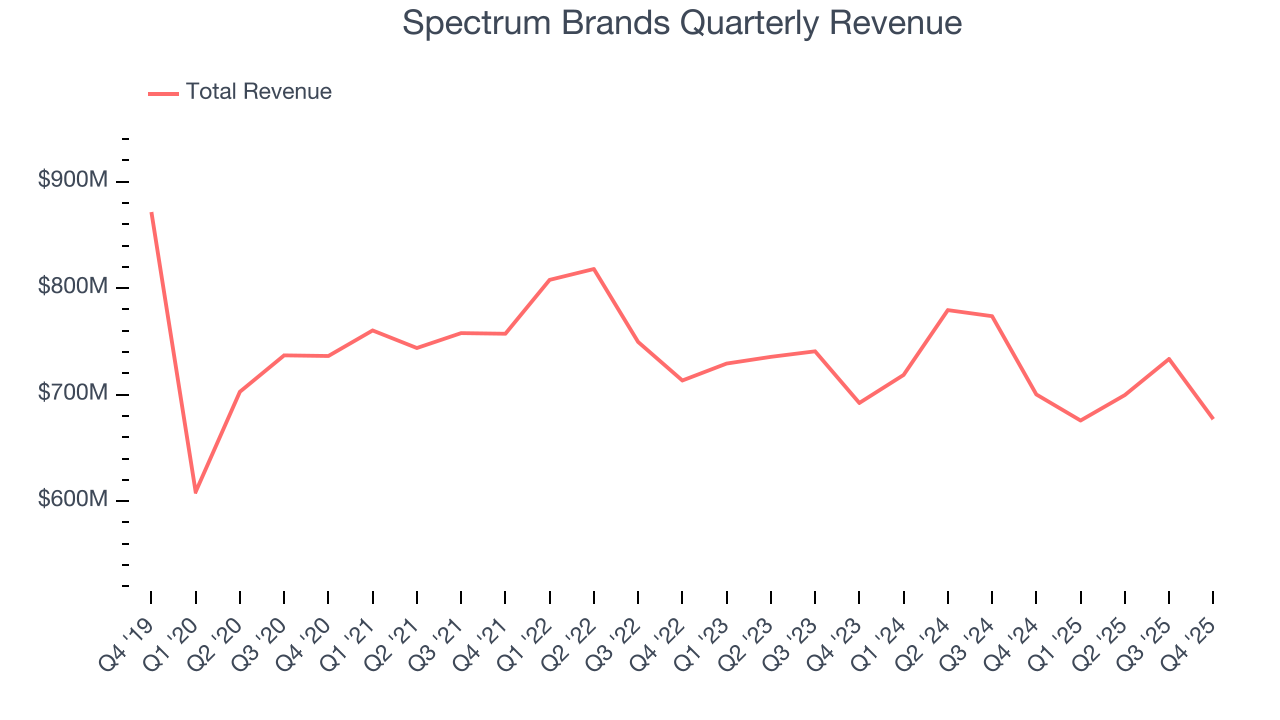
This quarter, Spectrum Brands’s revenue fell by 3.3% year on year to $677 million but beat Wall Street’s estimates by 1.2%.
Looking ahead, sell-side analysts expect revenue to grow 1.8% over the next 12 months. While this projection suggests its newer products will catalyze better top-line performance, it is still below the sector average.
6. Organic Revenue Growth
When analyzing revenue growth, we care most about organic revenue growth. This metric captures a business’s performance excluding one-time events such as mergers, acquisitions, and divestitures as well as foreign currency fluctuations.
Spectrum Brands’s demand has been falling over the last eight quarters, and on average, its organic sales have declined by 2% year on year. 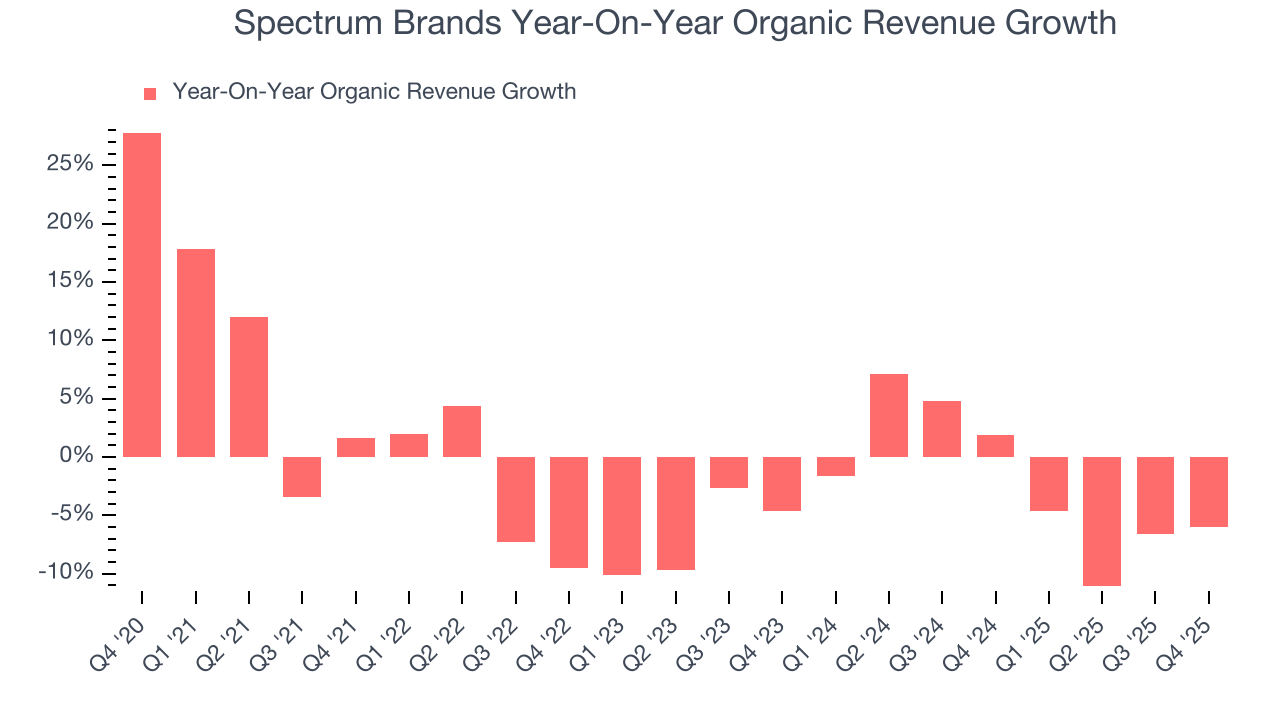
In the latest quarter, Spectrum Brands’s organic sales fell by 6% year on year. This decrease represents a further deceleration from its historical levels. We hope the business can get back on track.
7. Gross Margin & Pricing Power
Spectrum Brands has good unit economics for a consumer staples company, giving it the opportunity to invest in areas such as marketing and talent to stay competitive. As you can see below, it averaged an impressive 37.1% gross margin over the last two years. That means for every $100 in revenue, $62.87 went towards paying for raw materials, production of goods, transportation, and distribution. 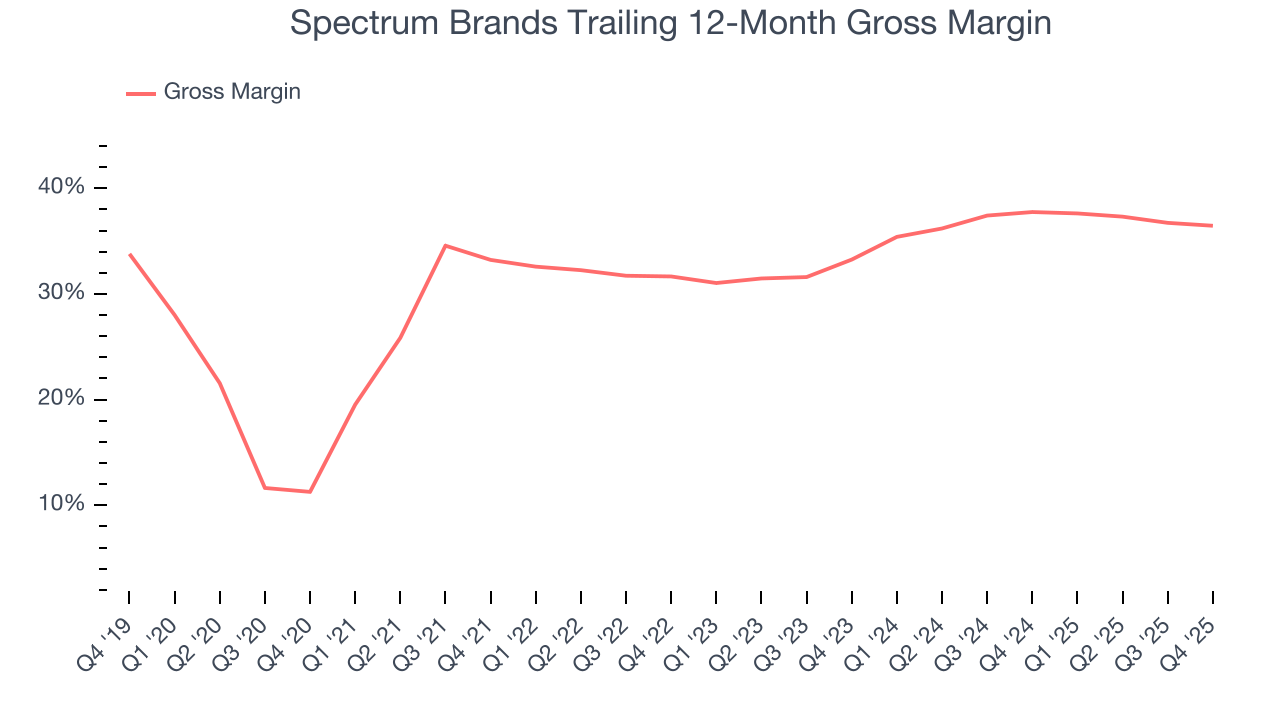
Spectrum Brands produced a 35.7% gross profit margin in Q4, down 1.1 percentage points year on year. Spectrum Brands’s full-year margin has also been trending down over the past 12 months, decreasing by 1.3 percentage points. If this move continues, it could suggest a more competitive environment with some pressure to lower prices and higher input costs (such as raw materials and manufacturing expenses).
8. Operating Margin
Spectrum Brands was profitable over the last two years but held back by its large cost base. Its average operating margin of 5.2% was weak for a consumer staples business. This result is surprising given its high gross margin as a starting point.
Analyzing the trend in its profitability, Spectrum Brands’s operating margin decreased by 2.5 percentage points over the last year. Spectrum Brands’s performance was poor no matter how you look at it - it shows that costs were rising and it couldn’t pass them onto its customers.
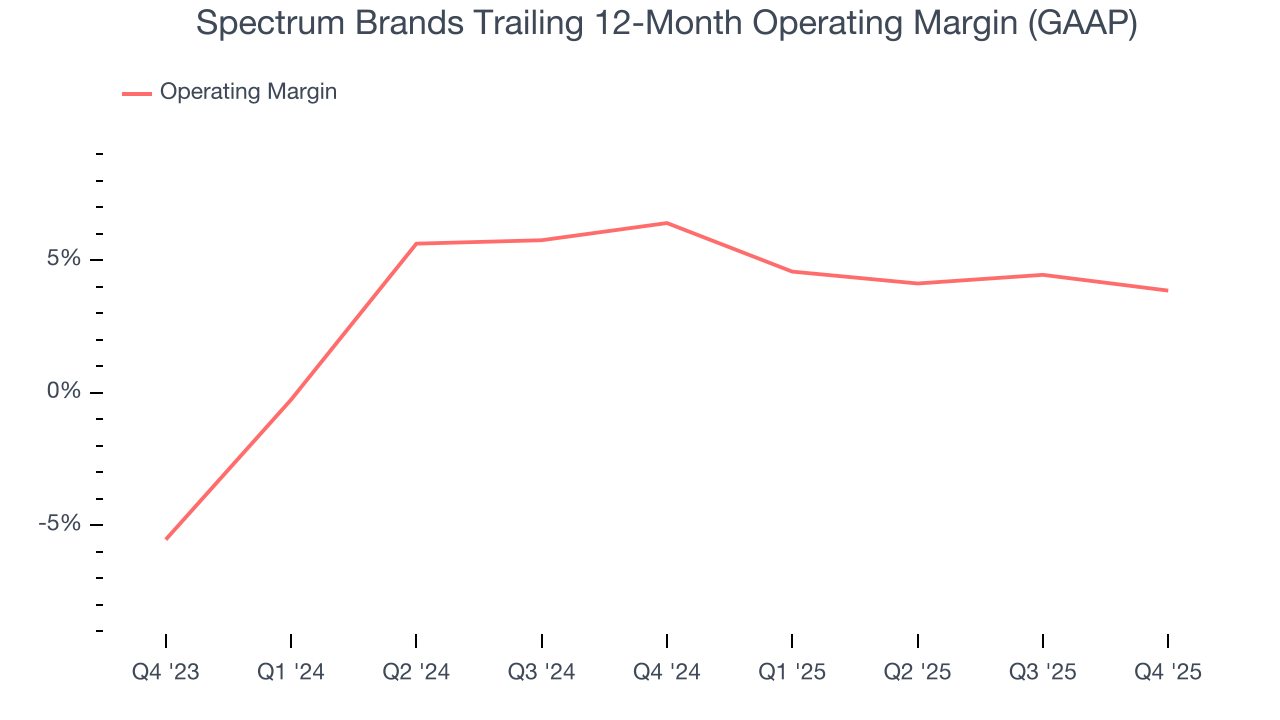
This quarter, Spectrum Brands generated an operating margin profit margin of 4%, down 2.4 percentage points year on year. Since Spectrum Brands’s operating margin decreased more than its gross margin, we can assume it was less efficient because expenses such as marketing, and administrative overhead increased.
9. Earnings Per Share
We track the long-term change in earnings per share (EPS) for the same reason as long-term revenue growth. Compared to revenue, however, EPS highlights whether a company’s growth is profitable.
Spectrum Brands’s EPS grew at an astounding 74.8% compounded annual growth rate over the last three years, higher than its 3.4% annualized revenue declines. This tells us management adapted its cost structure in response to a challenging demand environment.
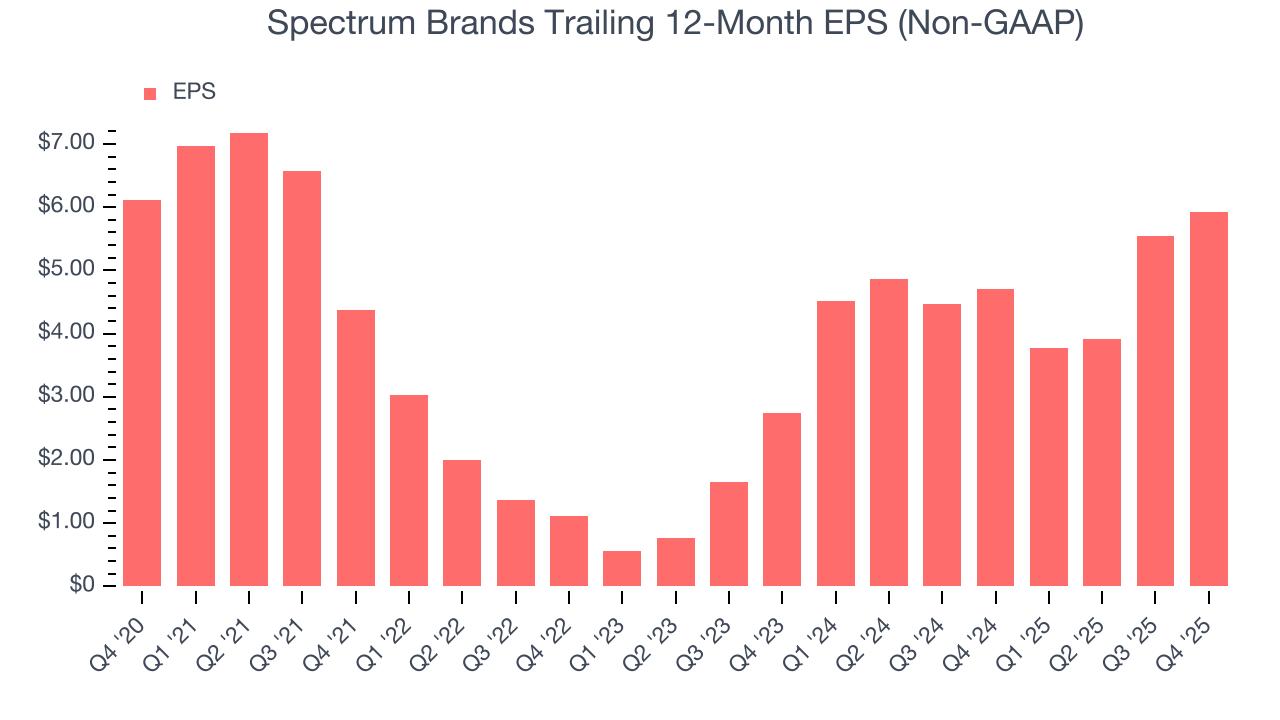
In Q4, Spectrum Brands reported adjusted EPS of $1.40, up from $1.02 in the same quarter last year. This print easily cleared analysts’ estimates, and shareholders should be content with the results. Over the next 12 months, Wall Street expects Spectrum Brands’s full-year EPS of $5.93 to shrink by 23.8%.
10. Cash Is King
If you’ve followed StockStory for a while, you know we emphasize free cash flow. Why, you ask? We believe that in the end, cash is king, and you can’t use accounting profits to pay the bills.
Spectrum Brands has shown decent cash profitability, giving it some flexibility to reinvest or return capital to investors. The company’s free cash flow margin averaged 6.2% over the last two years, slightly better than the broader consumer staples sector.
Taking a step back, we can see that Spectrum Brands’s margin expanded by 9.1 percentage points over the last year. This is encouraging, and we can see it became a less capital-intensive business because its free cash flow profitability rose while its operating profitability fell.
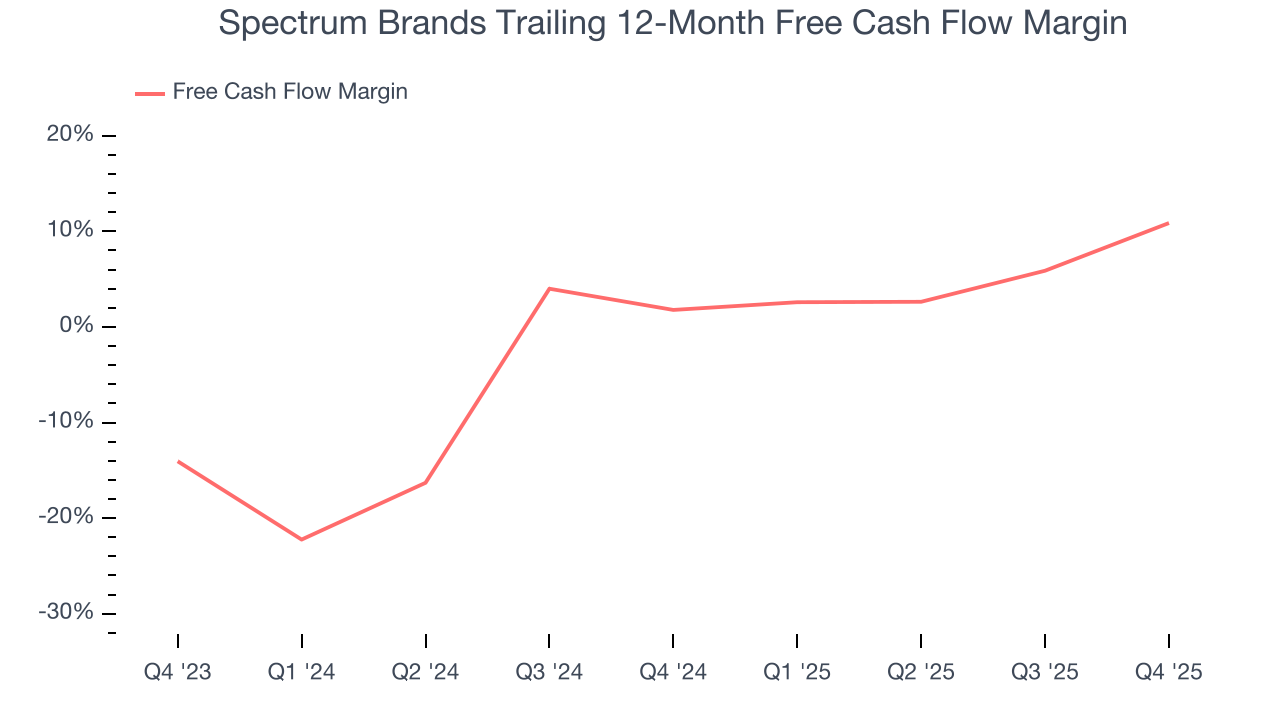
Spectrum Brands’s free cash flow clocked in at $59.3 million in Q4, equivalent to a 8.8% margin. Its cash flow turned positive after being negative in the same quarter last year, building on its favorable historical trend.
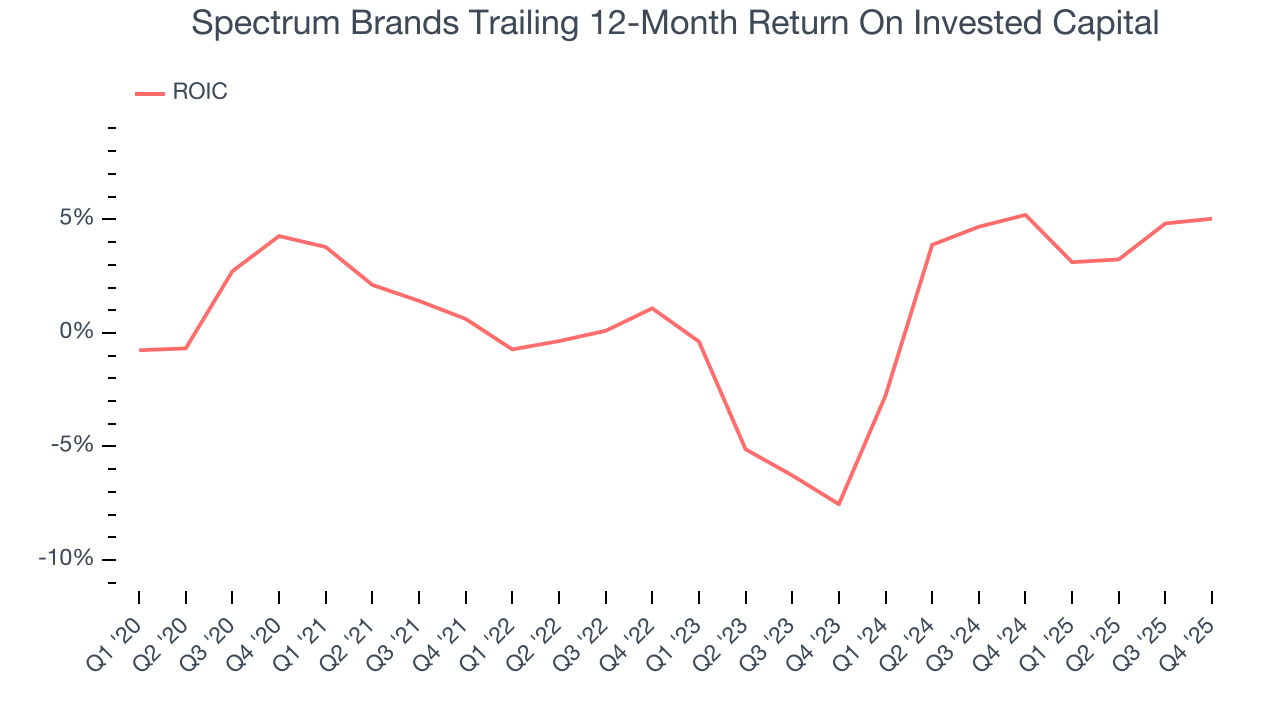
11. Return on Invested Capital (ROIC)
EPS and free cash flow tell us whether a company was profitable while growing its revenue. But was it capital-efficient? A company’s ROIC explains this by showing how much operating profit it makes compared to the money it has raised (debt and equity).
Spectrum Brands historically did a mediocre job investing in profitable growth initiatives. Its five-year average ROIC was 0.9%, lower than the typical cost of capital (how much it costs to raise money) for consumer staples companies.
12. Balance Sheet Assessment
Spectrum Brands reported $126.6 million of cash and $697.6 million of debt on its balance sheet in the most recent quarter. As investors in high-quality companies, we primarily focus on two things: 1) that a company’s debt level isn’t too high and 2) that its interest payments are not excessively burdening the business.
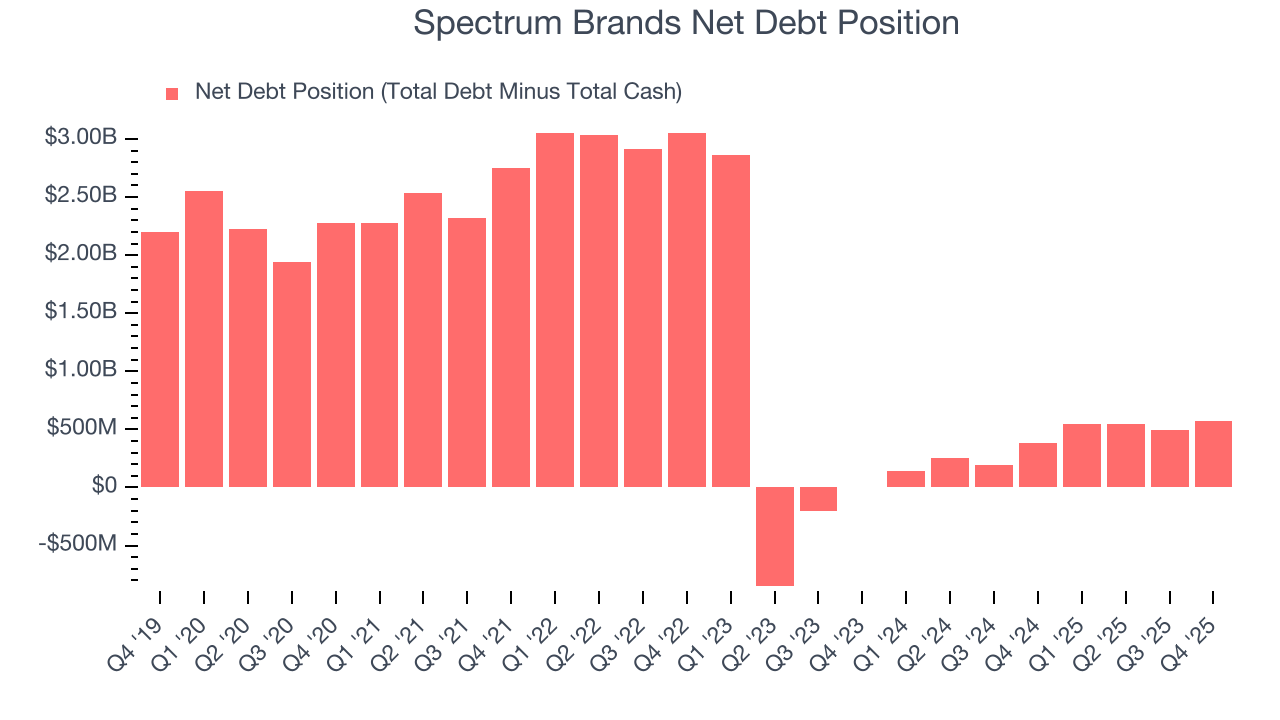
With $273.9 million of EBITDA over the last 12 months, we view Spectrum Brands’s 2.1× net-debt-to-EBITDA ratio as safe. We also see its $16 million of annual interest expenses as appropriate. The company’s profits give it plenty of breathing room, allowing it to continue investing in growth initiatives.
13. Key Takeaways from Spectrum Brands’s Q4 Results
It was good to see Spectrum Brands beat analysts’ EPS expectations this quarter. We were also happy its EBITDA outperformed Wall Street’s estimates. On the other hand, its gross margin missed. Overall, we think this was a decent quarter with some key metrics above expectations. The stock remained flat at $68.45 immediately after reporting.
14. Is Now The Time To Buy Spectrum Brands?
Updated: March 16, 2026 at 10:58 PM EDT
The latest quarterly earnings matters, sure, but we actually think longer-term fundamentals and valuation matter more. Investors should consider all these pieces before deciding whether or not to invest in Spectrum Brands.
Spectrum Brands falls short of our quality standards. First off, its revenue has declined over the last three years. While its EPS growth over the last three years has been fantastic, the downside is its projected EPS for the next year is lacking. On top of that, its relatively low ROIC suggests management has struggled to find compelling investment opportunities.
Spectrum Brands’s P/E ratio based on the next 12 months is 16.7x. This multiple tells us a lot of good news is priced in - we think there are better stocks to buy right now.
Wall Street analysts have a consensus one-year price target of $85.29 on the company (compared to the current share price of $74.15).
Although the price target is bullish, readers should exercise caution because analysts tend to be overly optimistic. The firms they work for, often big banks, have relationships with companies that extend into fundraising, M&A advisory, and other rewarding business lines. As a result, they typically hesitate to say bad things for fear they will lose out. We at StockStory do not suffer from such conflicts of interest, so we’ll always tell it like it is.