
Sphere Entertainment (SPHR)
Sphere Entertainment faces an uphill battle. Its underwhelming revenue growth and failure to generate meaningful free cash flow is a concerning trend.― StockStory Analyst Team
1. News


2. Summary
Why We Think Sphere Entertainment Will Underperform
Famous for its viral Las Vegas Sphere venue, Sphere Entertainment (NYSE:SPHR) hosts live entertainment events and distributes content across various media platforms.
- Muted 18.1% annual revenue growth over the last five years shows its demand lagged behind its consumer discretionary peers
- Suboptimal cost structure is highlighted by its history of operating margin losses
- Negative earnings profile makes it challenging to secure favorable financing terms from lenders


Sphere Entertainment fails to meet our quality criteria. We believe there are better opportunities elsewhere.
Why There Are Better Opportunities Than Sphere Entertainment


Sphere Entertainment’s stock price of $105 implies a valuation ratio of 19.4x forward EV-to-EBITDA. This multiple is higher than most consumer discretionary companies, and we think it’s quite expensive for the weaker revenue growth you get.
We’d rather invest in similarly-priced but higher-quality companies with more reliable earnings growth.
3. Sphere Entertainment (SPHR) Research Report: Q4 CY2025 Update
Content production and distribution company Sphere Entertainment (NYSE:SPHR) reported revenue ahead of Wall Street’s expectations in Q4 CY2025, with sales up 27.9% year on year to $394.3 million. Its GAAP profit of $1.23 per share was significantly above analysts’ consensus estimates.
Sphere Entertainment (SPHR) Q4 CY2025 Highlights:
- Revenue: $394.3 million vs analyst estimates of $377.6 million (27.9% year-on-year growth, 4.4% beat)
- EPS (GAAP): $1.23 vs analyst estimates of -$0.26 (significant beat)
- Operating Margin: 7.3%, up from -45% in the same quarter last year
- Market Capitalization: $3.35 billion
Company Overview
Famous for its viral Las Vegas Sphere venue, Sphere Entertainment (NYSE:SPHR) hosts live entertainment events and distributes content across various media platforms.
Sphere Entertainment made its initial splash with the Las Vegas Sphere, a unique venue sporting advanced technologies in media production. This venue looks like a giant orb and is covered with LED panels on the inside and outside to create an immersive digital experience. Beyond The Sphere and live event production, the company's offerings include content creation and distribution across various media platforms.
Sphere Entertainment generates revenue through live events, content distribution agreements, and media partnerships. Specifically, its Las Vegas Sphere has a two-sided business model, where live events within The Sphere generate ticket and concession revenue while the outside of the venue pulls in advertising revenue from companies seeking to display large-format digital ads. On the content distribution side, the company operates regional sports and entertainment networks, MSG Network and MSG Sportsnet, along with a direct-to-consumer streaming product, MSG+.
The expansion of its Sphere venues is key for growth, but new locations are subject to regulatory approvals, presenting risks (as seen in its December 2023 denial of a London location).
4. Leisure Facilities
Leisure facilities companies often sell experiences rather than tangible products, and in the last decade-plus, consumers have slowly shifted their spending from "things" to "experiences". Leisure facilities seek to benefit but must innovate to do so because of the industry's high competition and capital intensity.
Competitors in the live entertainment and content production industry include Live Nation (NYSE:LYV), Endeavor (NYSE: EDR), and Madison Square Garden (NYSE:MSGE).
5. Revenue Growth
Reviewing a company’s long-term sales performance reveals insights into its quality. Even a bad business can shine for one or two quarters, but a top-tier one grows for years. Over the last five years, Sphere Entertainment grew its sales at a 18.1% compounded annual growth rate. Though this growth is acceptable on an absolute basis, we need to see more than just topline growth for the consumer discretionary sector, which can display significant earnings volatility. This means our bar for the sector is particularly high, reflecting the non-essential and hit-driven nature of the products and services offered. Additionally, five-year CAGR starts around Covid, when revenue was depressed then rebounded.
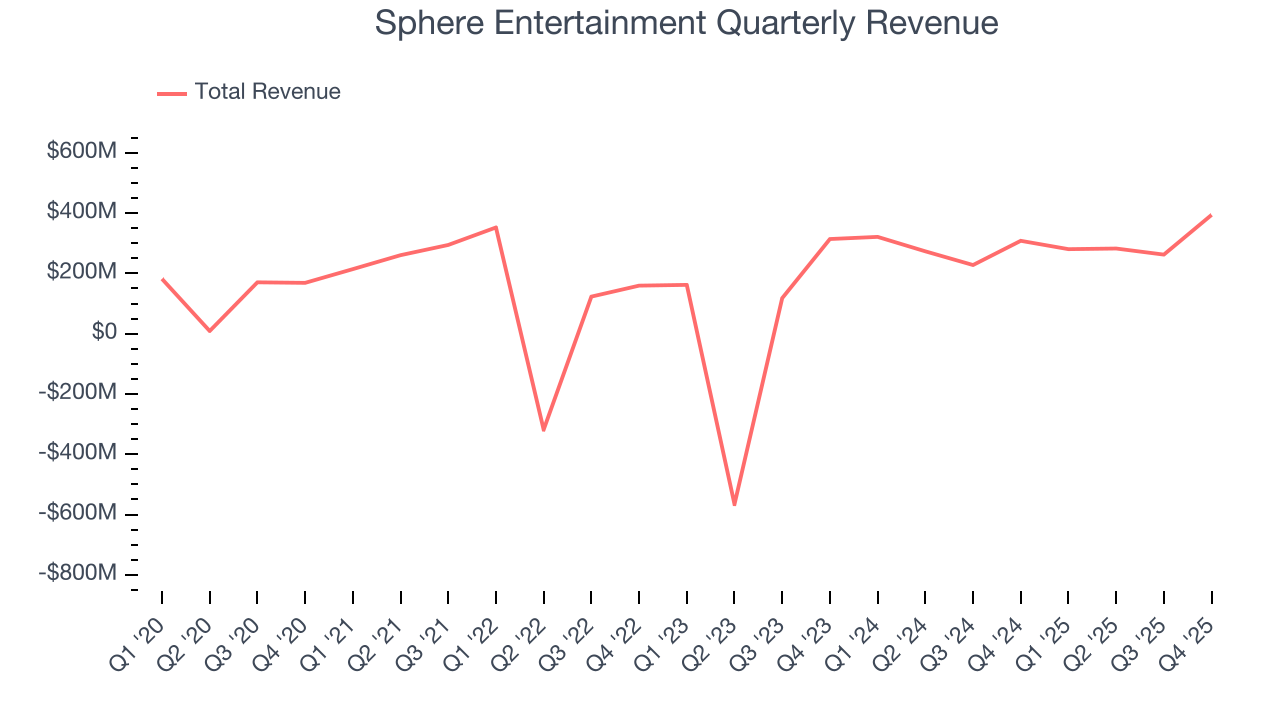
We at StockStory place the most emphasis on long-term growth, but within consumer discretionary, a stretched historical view may miss a company riding a successful new product or trend. Sphere Entertainment’s annualized revenue growth of 554% over the last two years is above its five-year trend, suggesting its demand recently accelerated. Note that COVID hurt Sphere Entertainment’s business in 2020 and part of 2021, and it bounced back in a big way thereafter. 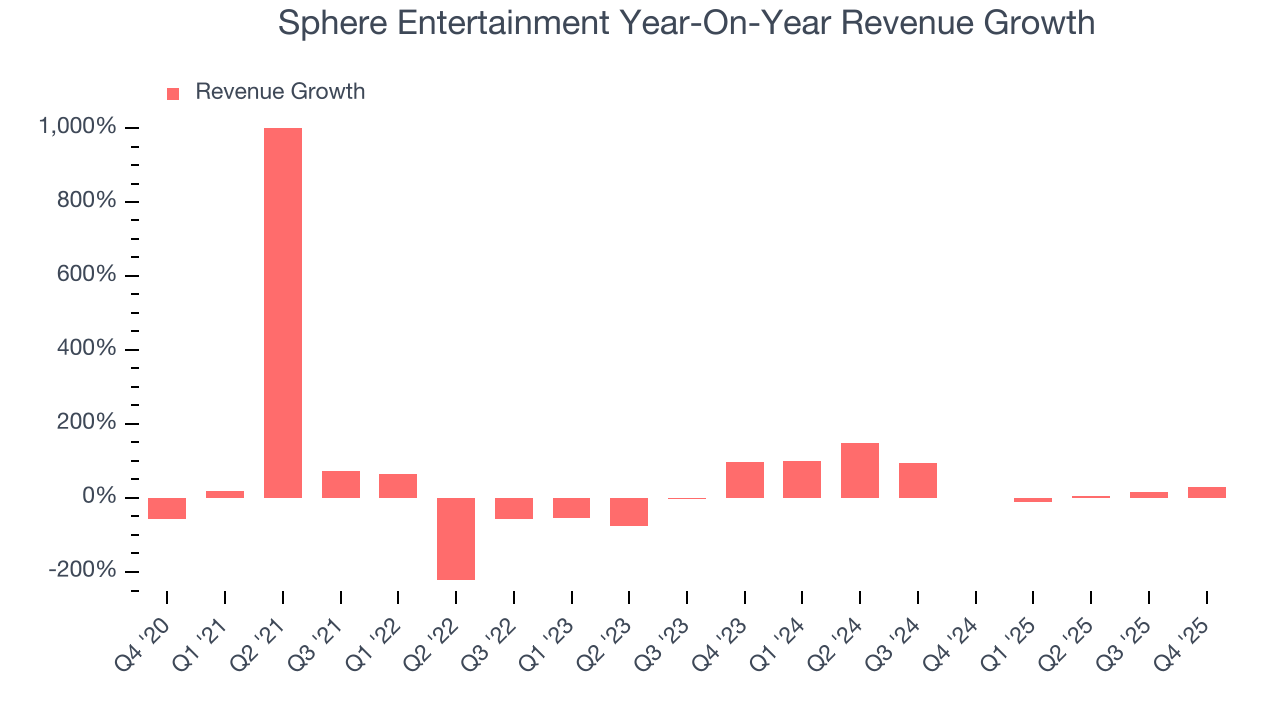
We can dig further into the company’s revenue dynamics by analyzing its most important segments, Sphere and MSG Networks, which are 69.5% and 30.5% of revenue. Over the last two years, Sphere Entertainment’s Sphere revenue (live events and advertising) averaged 26.9% year-on-year growth. On the other hand, its MSG Networks revenue (content distribution) averaged 14.2% declines. 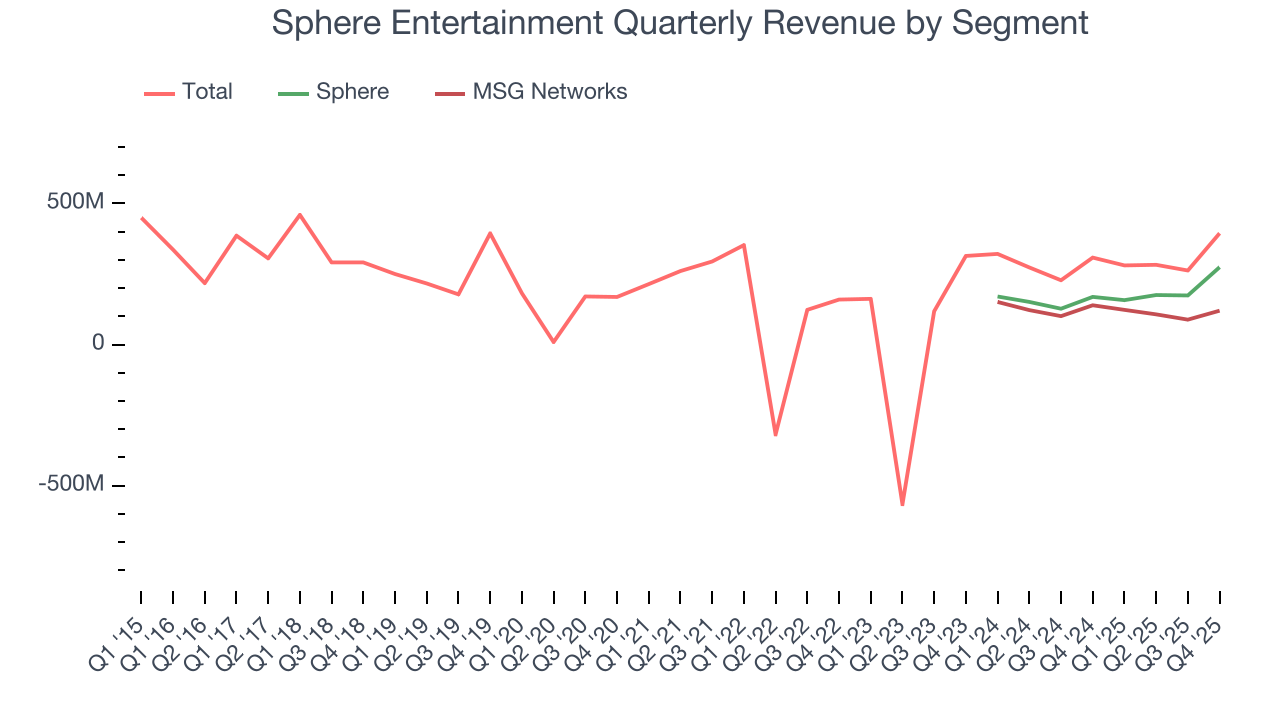
This quarter, Sphere Entertainment reported robust year-on-year revenue growth of 27.9%, and its $394.3 million of revenue topped Wall Street estimates by 4.4%.
Looking ahead, sell-side analysts expect revenue to grow 2% over the next 12 months, a deceleration versus the last two years. This projection doesn't excite us and suggests its products and services will see some demand headwinds.
6. Operating Margin
Operating margin is an important measure of profitability as it shows the portion of revenue left after accounting for all core expenses – everything from the cost of goods sold to advertising and wages. It’s also useful for comparing profitability across companies with different levels of debt and tax rates because it excludes interest and taxes.
Sphere Entertainment’s operating margin has been trending up over the last 12 months, but it still averaged negative 21.5% over the last two years. This is due to its large expense base and inefficient cost structure.
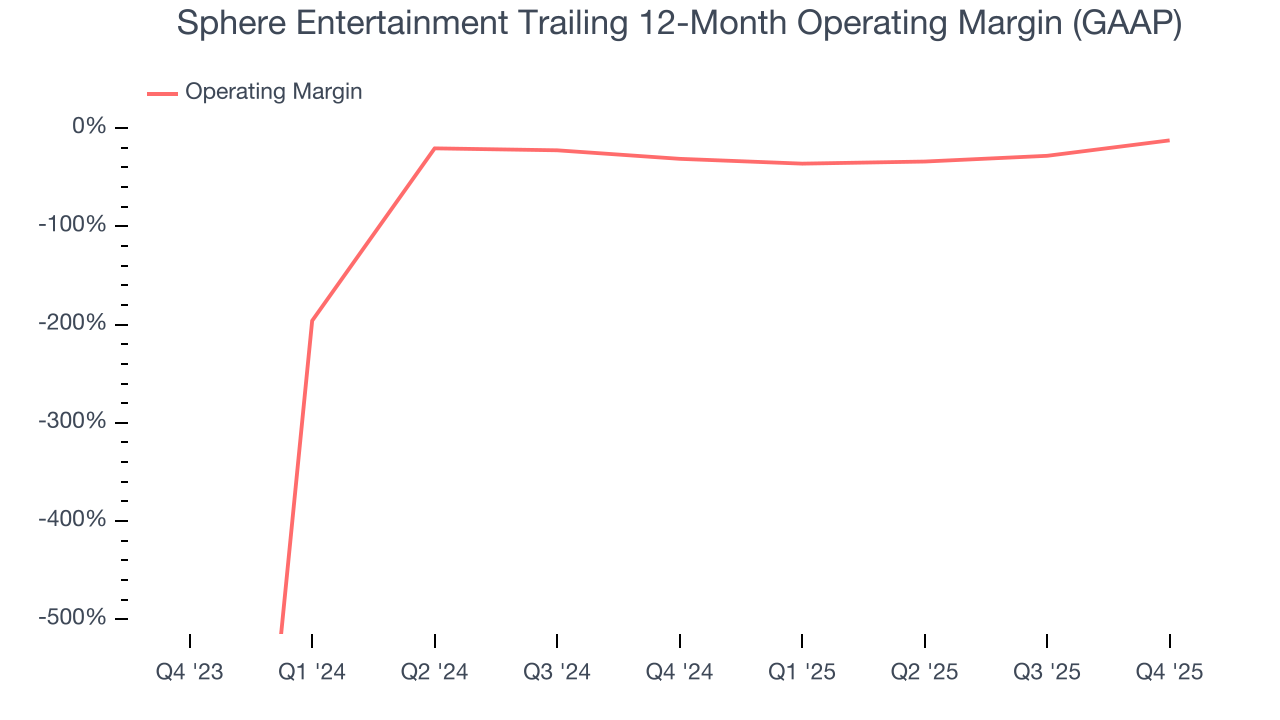
In Q4, Sphere Entertainment generated an operating margin profit margin of 7.3%, up 52.3 percentage points year on year. This increase was a welcome development and shows it was more efficient.
7. Earnings Per Share
We track the long-term change in earnings per share (EPS) for the same reason as long-term revenue growth. Compared to revenue, however, EPS highlights whether a company’s growth is profitable.
Although Sphere Entertainment’s full-year earnings are still negative, it reduced its losses and improved its EPS by 45.3% annually over the last five years. The next few quarters will be critical for assessing its long-term profitability.
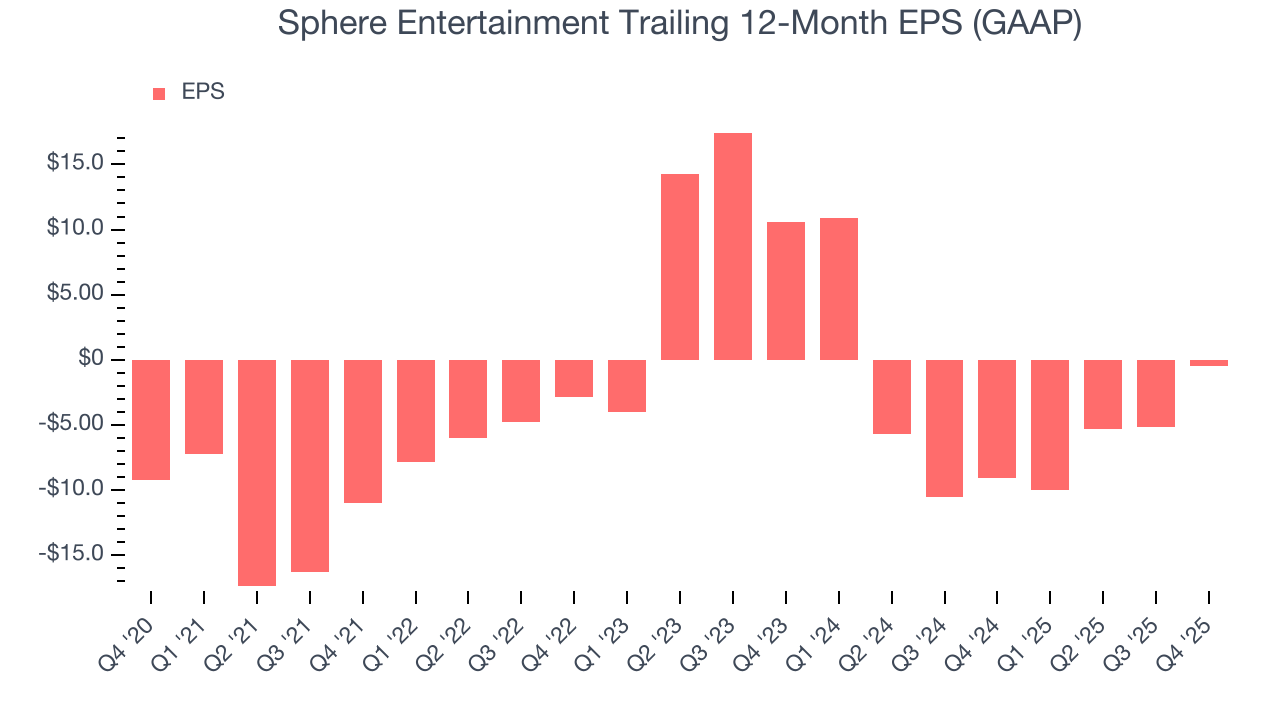
In Q4, Sphere Entertainment reported EPS of $1.23, up from negative $3.49 in the same quarter last year. This print easily cleared analysts’ estimates, and shareholders should be content with the results. Over the next 12 months, Wall Street expects Sphere Entertainment to perform poorly. Analysts forecast its full-year EPS of negative $0.45 will tumble to negative $3.69.
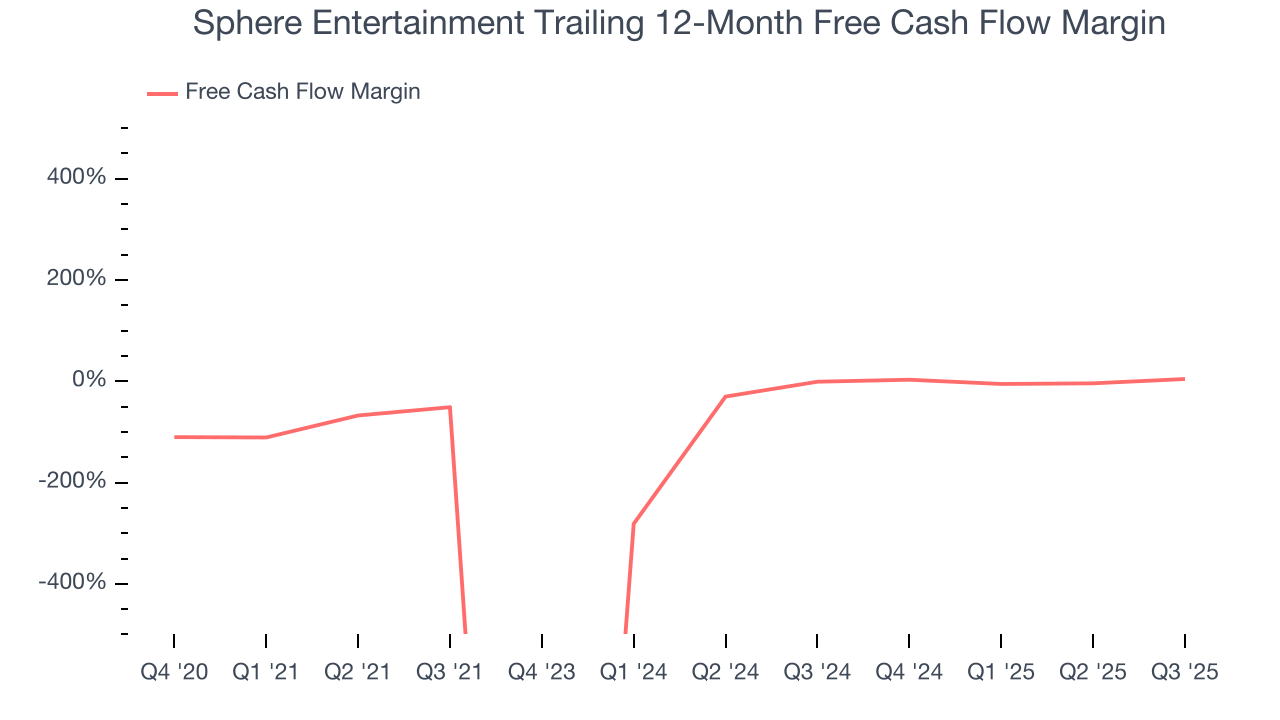
8. Cash Is King
Free cash flow isn't a prominently featured metric in company financials and earnings releases, but we think it's telling because it accounts for all operating and capital expenses, making it tough to manipulate. Cash is king.
Sphere Entertainment has shown poor cash profitability over the last two years, giving the company limited opportunities to return capital to shareholders. Its free cash flow margin averaged 3.1%, lousy for a consumer discretionary business.
9. Balance Sheet Risk
As long-term investors, the risk we care about most is the permanent loss of capital, which can happen when a company goes bankrupt or raises money from a disadvantaged position. This is separate from short-term stock price volatility, something we are much less bothered by.
Sphere Entertainment’s $961.5 million of debt exceeds the $521.3 million of cash on its balance sheet. Furthermore, its 6× net-debt-to-EBITDA ratio (based on its EBITDA of $75.13 million over the last 12 months) shows the company is overleveraged.
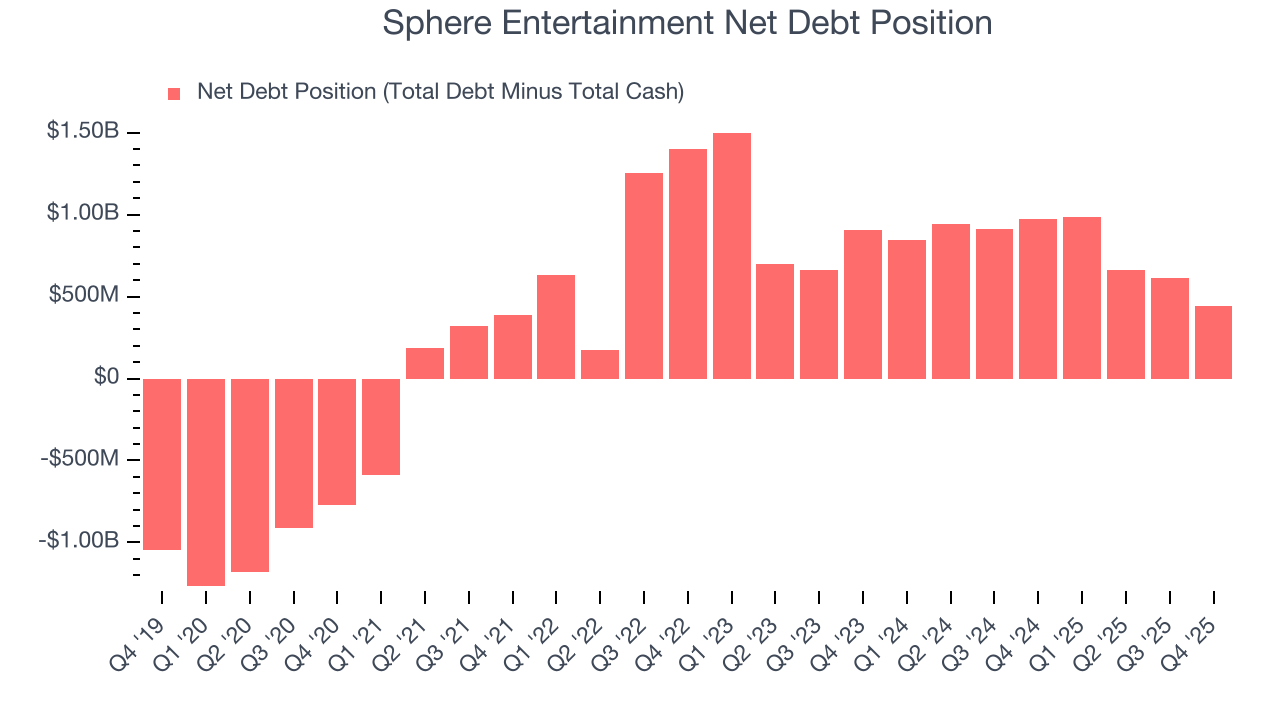
At this level of debt, incremental borrowing becomes increasingly expensive and credit agencies could downgrade the company’s rating if profitability falls. Sphere Entertainment could also be backed into a corner if the market turns unexpectedly – a situation we seek to avoid as investors in high-quality companies.
We hope Sphere Entertainment can improve its balance sheet and remain cautious until it increases its profitability or pays down its debt.
10. Key Takeaways from Sphere Entertainment’s Q4 Results
It was good to see Sphere Entertainment beat analysts’ revenue and EPS expectations this quarter. We were also glad its operating margin greatly improved from the same quarter last year. Overall, this print had some key positives. The stock traded up 10.9% to $105.13 immediately following the results.
11. Is Now The Time To Buy Sphere Entertainment?
Updated: March 14, 2026 at 11:56 PM EDT
A common mistake we notice when investors are deciding whether to buy a stock or not is that they simply look at the latest earnings results. Business quality and valuation matter more, so we urge you to understand these dynamics as well.
We cheer for all companies serving everyday consumers, but in the case of Sphere Entertainment, we’ll be cheering from the sidelines. On top of that, Sphere Entertainment’s projected EPS for the next year is lacking, and its low free cash flow margins give it little breathing room.
Sphere Entertainment’s EV-to-EBITDA ratio based on the next 12 months is 19.4x. This multiple tells us a lot of good news is priced in - you can find more timely opportunities elsewhere.
Wall Street analysts have a consensus one-year price target of $128.90 on the company (compared to the current share price of $105).
Although the price target is bullish, readers should exercise caution because analysts tend to be overly optimistic. The firms they work for, often big banks, have relationships with companies that extend into fundraising, M&A advisory, and other rewarding business lines. As a result, they typically hesitate to say bad things for fear they will lose out. We at StockStory do not suffer from such conflicts of interest, so we’ll always tell it like it is.