
Simpson (SSD)
We’re wary of Simpson. Its weak sales growth and declining returns on capital show its demand and profits are shrinking.― StockStory Analyst Team
1. News


2. Summary
Why Simpson Is Not Exciting
Aiming to build safer and stronger buildings, Simpson (NYSE:SSD) designs and manufactures structural connectors, anchors, and other construction products.
- Estimated sales growth of 2.8% for the next 12 months is soft and implies weaker demand
- One positive is that its offerings are mission-critical for businesses and lead to a best-in-class gross margin of 46.3%


Simpson falls short of our quality standards. We see more attractive opportunities in the market.
Why There Are Better Opportunities Than Simpson


Simpson is trading at $166.65 per share, or 19.2x forward P/E. This multiple is cheaper than most industrials peers, but we think this is justified.
Cheap stocks can look like great bargains at first glance, but you often get what you pay for. These mediocre businesses often have less earnings power, meaning there is more reliance on a re-rating to generate good returns - an unlikely scenario for low-quality companies.
3. Simpson (SSD) Research Report: Q4 CY2025 Update
Building products manufacturer Simpson (NYSE:SSD) reported Q4 CY2025 results beating Wall Street’s revenue expectations, with sales up 4.2% year on year to $539.3 million. Its GAAP profit of $1.35 per share was 11.1% above analysts’ consensus estimates.
Simpson (SSD) Q4 CY2025 Highlights:
- Revenue: $539.3 million vs analyst estimates of $530.7 million (4.2% year-on-year growth, 1.6% beat)
- EPS (GAAP): $1.35 vs analyst estimates of $1.22 (11.1% beat)
- Adjusted EBITDA: $104.7 million vs analyst estimates of $94.39 million (19.4% margin, 10.9% beat)
- Operating Margin: 13.9%, down from 15% in the same quarter last year
- Market Capitalization: $8.05 billion
Company Overview
Aiming to build safer and stronger buildings, Simpson (NYSE:SSD) designs and manufactures structural connectors, anchors, and other construction products.
Its products are most commonly used in residential homes, commercial buildings, industrial buildings, and public infrastructure. The company’s bread-and-butter offerings include its Strong-Tie connectors, fasteners, and anchoring systems.
Simply put, connectors are usually small pieces of hardware used to join structural elements together; for example, ties can be used to connect wall frames to the floor or roof frames to walls. Simpson also sells products for bathrooms, plumbing, and accessories such as faucets, showerheads, and valves.
The company only generates revenue through product sales, which are segmented into architectural products (connectors, fasteners, etc.) and plumbing products. The former segment is seasonally higher during Q2 and Q3 each year when building and construction are in the highest demand due to favorable weather. The plumbing products sector attracts more DIY (do-it-yourself) customers, who purchase the company’s products through retail stores like The Home Depot (NYSE:HD).
4. Home Construction Materials
Traditionally, home construction materials companies have built economic moats with expertise in specialized areas, brand recognition, and strong relationships with contractors. More recently, advances to address labor availability and job site productivity have spurred innovation that is driving incremental demand. However, these companies are at the whim of residential construction volumes, which tend to be cyclical and can be impacted heavily by economic factors such as interest rates. Additionally, the costs of raw materials can be driven by a myriad of worldwide factors and greatly influence the profitability of home construction materials companies.
Competitors offering connectors in the building products space include Builders FirstSource (NYSE:BLDR), UFP (NASDAQ:UFPI), and private company USP Structural Connectors.
5. Revenue Growth
A company’s long-term sales performance can indicate its overall quality. Any business can put up a good quarter or two, but many enduring ones grow for years. Luckily, Simpson’s sales grew at an excellent 13% compounded annual growth rate over the last five years. Its growth beat the average industrials company and shows its offerings resonate with customers.
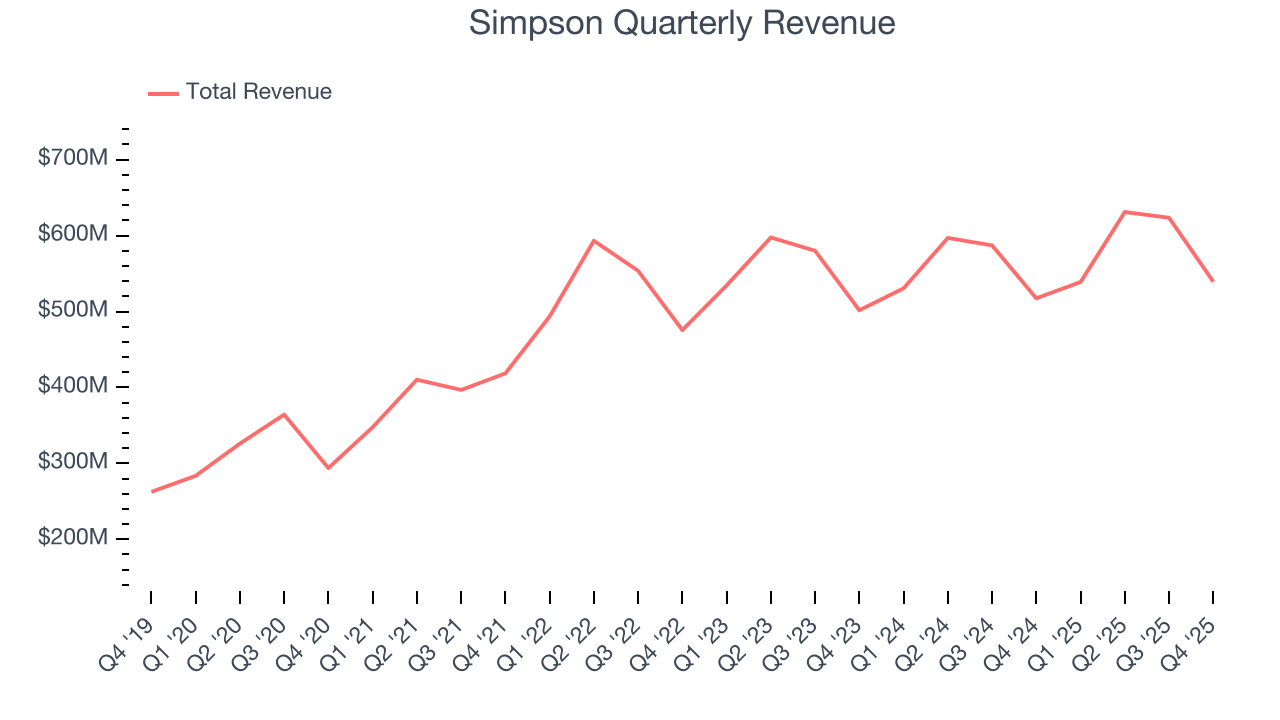
We at StockStory place the most emphasis on long-term growth, but within industrials, a half-decade historical view may miss cycles, industry trends, or a company capitalizing on catalysts such as a new contract win or a successful product line. Simpson’s recent performance shows its demand has slowed significantly as its annualized revenue growth of 2.7% over the last two years was well below its five-year trend. 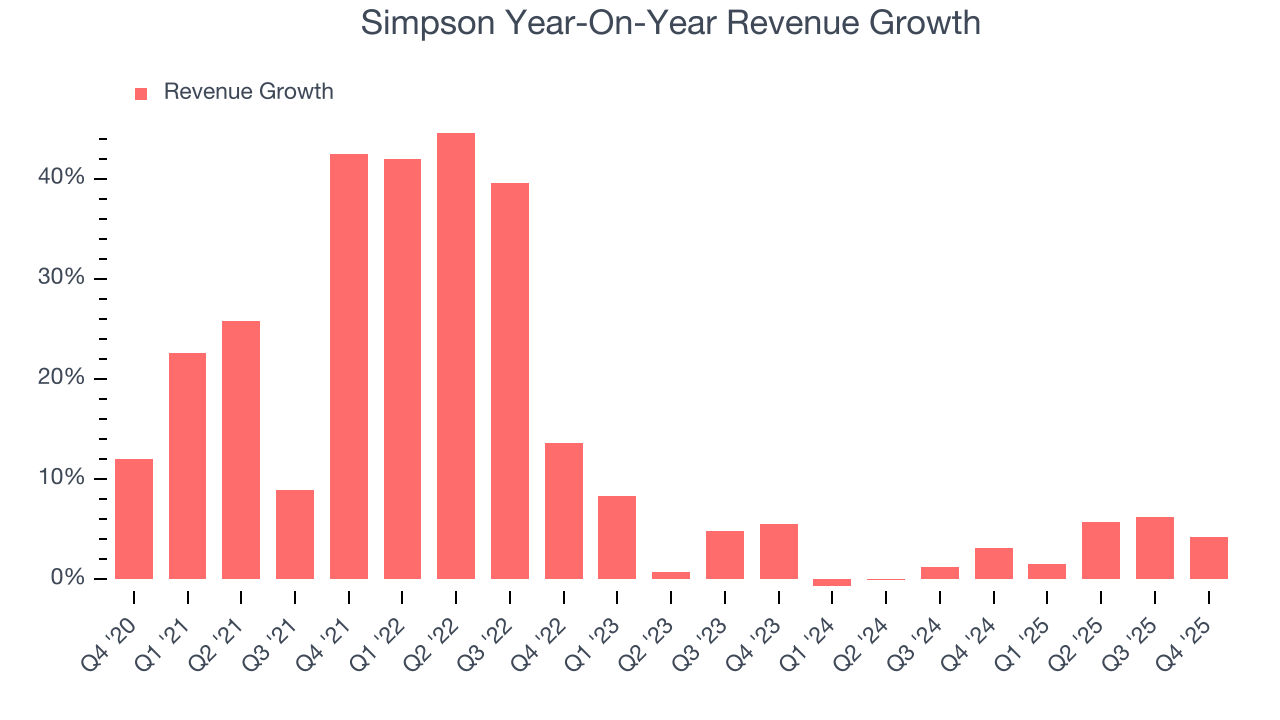
This quarter, Simpson reported modest year-on-year revenue growth of 4.2% but beat Wall Street’s estimates by 1.6%.
Looking ahead, sell-side analysts expect revenue to grow 2.5% over the next 12 months, similar to its two-year rate. This projection is underwhelming and suggests its newer products and services will not catalyze better top-line performance yet.
6. Gross Margin & Pricing Power
At StockStory, we prefer high gross margin businesses because they indicate the company has pricing power or differentiated products, giving it a chance to generate higher operating profits.
Simpson has best-in-class unit economics for an industrials company, enabling it to invest in areas such as research and development. Its margin also signals it sells differentiated products, not commodities. As you can see below, it averaged an elite 46.3% gross margin over the last five years. That means Simpson only paid its suppliers $53.67 for every $100 in revenue. 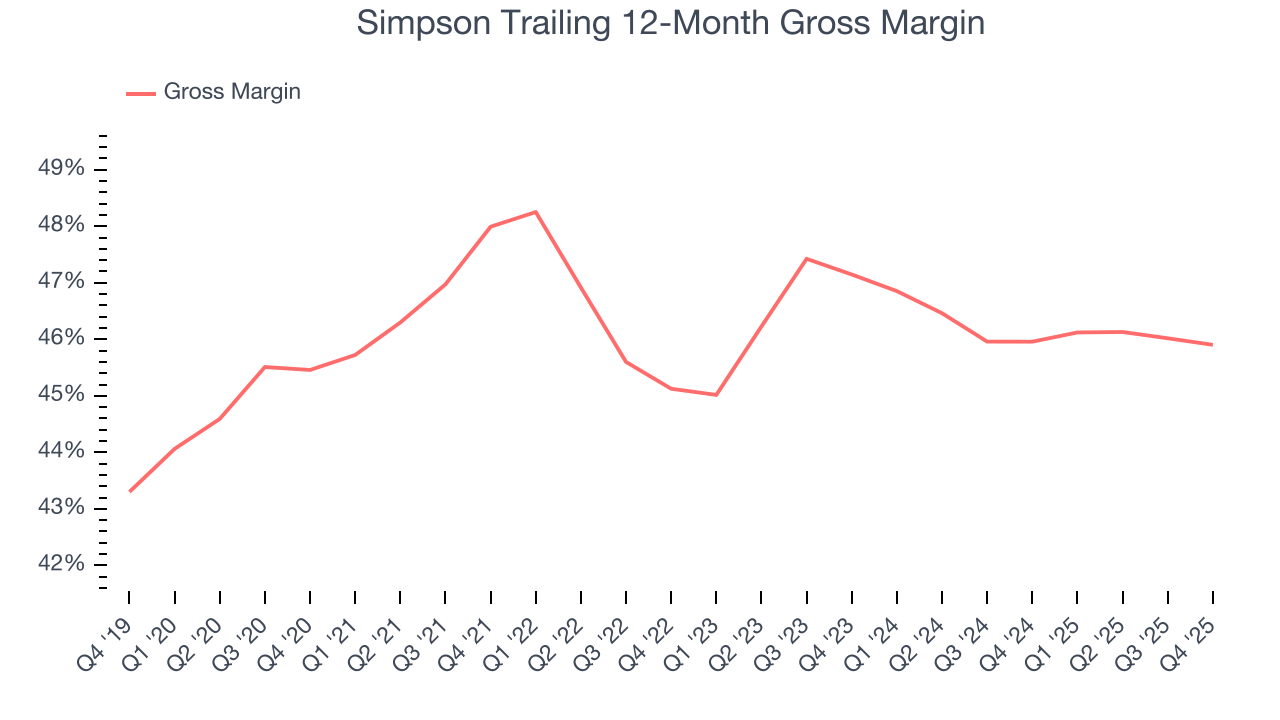
This quarter, Simpson’s gross profit margin was 43.6%, in line with the same quarter last year. On a wider time horizon, the company’s full-year margin has remained steady over the past four quarters, suggesting its input costs (such as raw materials and manufacturing expenses) have been stable and it isn’t under pressure to lower prices.
7. Operating Margin
Simpson has been a well-oiled machine over the last five years. It demonstrated elite profitability for an industrials business, boasting an average operating margin of 21.2%. This result isn’t surprising as its high gross margin gives it a favorable starting point.
Analyzing the trend in its profitability, Simpson’s operating margin decreased by 4.3 percentage points over the last five years. This raises questions about the company’s expense base because its revenue growth should have given it leverage on its fixed costs, resulting in better economies of scale and profitability.
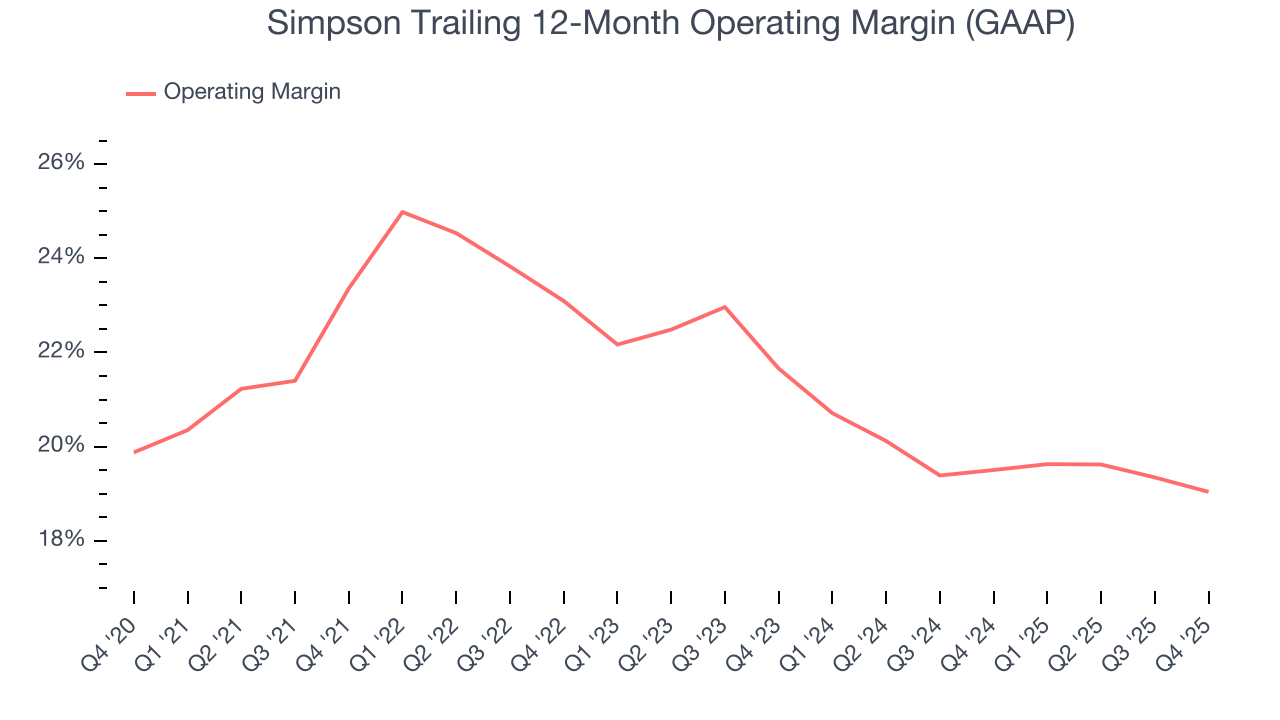
In Q4, Simpson generated an operating margin profit margin of 13.9%, down 1.2 percentage points year on year. Since Simpson’s operating margin decreased more than its gross margin, we can assume it was less efficient because expenses such as marketing, R&D, and administrative overhead increased.
8. Earnings Per Share
We track the long-term change in earnings per share (EPS) for the same reason as long-term revenue growth. Compared to revenue, however, EPS highlights whether a company’s growth is profitable.
Simpson’s remarkable 14.1% annual EPS growth over the last five years aligns with its revenue performance. This tells us it maintained its per-share profitability as it expanded.
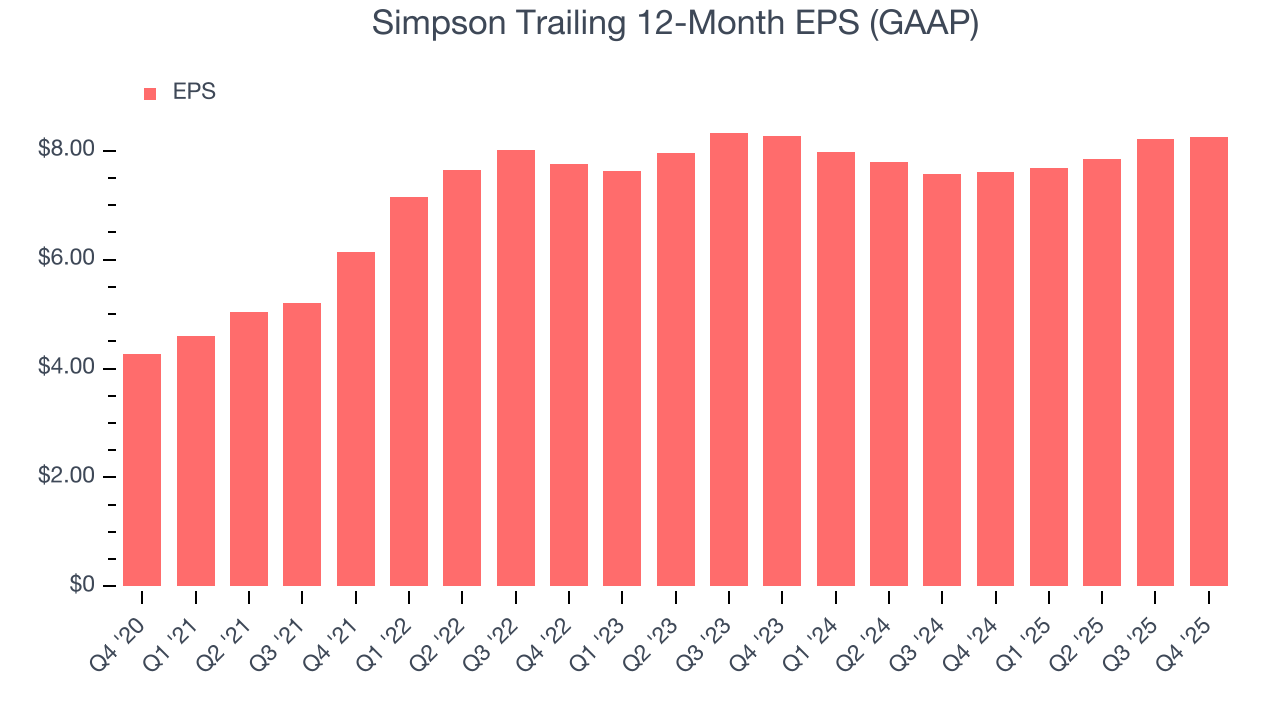
Like with revenue, we analyze EPS over a shorter period to see if we are missing a change in the business.
For Simpson, EPS didn’t budge over the last two years, a regression from its five-year trend. We hope it can revert to earnings growth in the coming years.
In Q4, Simpson reported EPS of $1.35, up from $1.31 in the same quarter last year. This print easily cleared analysts’ estimates, and shareholders should be content with the results. Over the next 12 months, Wall Street expects Simpson’s full-year EPS of $8.25 to grow 4.6%.
9. Cash Is King
Although earnings are undoubtedly valuable for assessing company performance, we believe cash is king because you can’t use accounting profits to pay the bills.
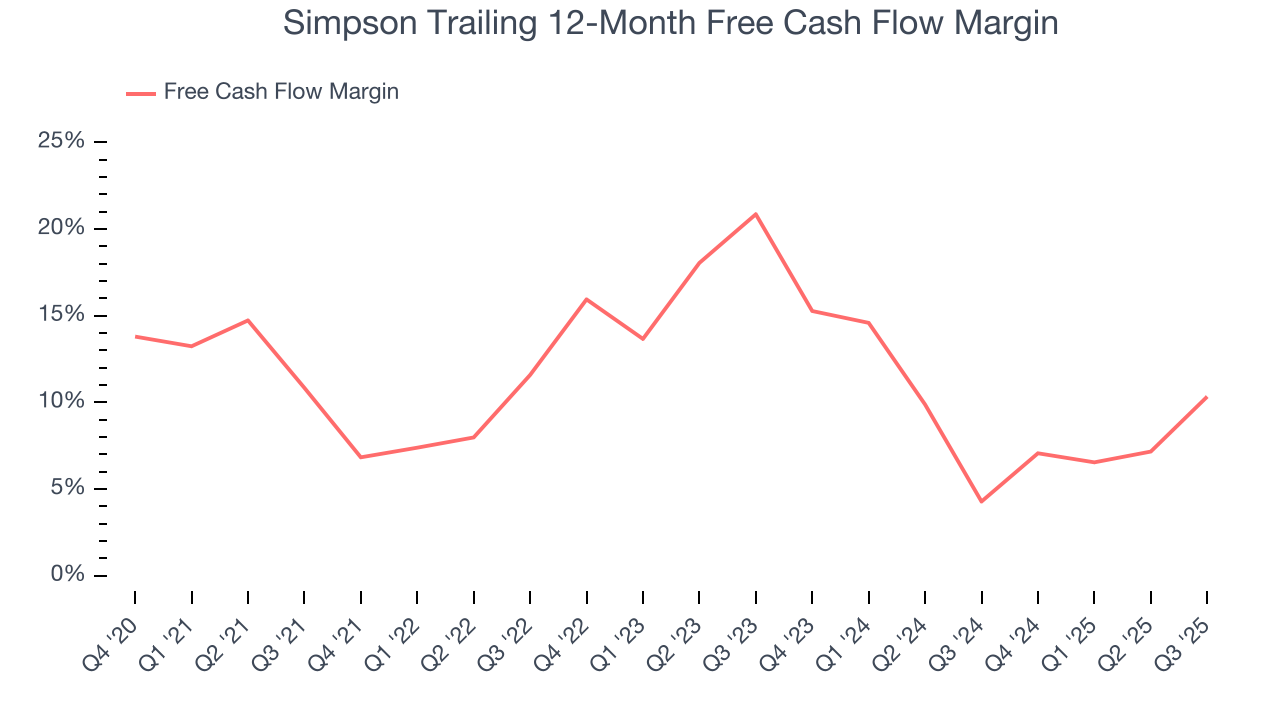
Simpson has shown robust cash profitability, enabling it to comfortably ride out cyclical downturns while investing in plenty of new offerings and returning capital to investors. The company’s free cash flow margin averaged 11.3% over the last five years, quite impressive for an industrials business.
Taking a step back, we can see that Simpson’s margin expanded by 2.1 percentage points during that time. This shows the company is heading in the right direction, and we can see it became a less capital-intensive business because its free cash flow profitability rose while its operating profitability fell.
10. Return on Invested Capital (ROIC)
EPS and free cash flow tell us whether a company was profitable while growing its revenue. But was it capital-efficient? Enter ROIC, a metric showing how much operating profit a company generates relative to the money it has raised (debt and equity).
Although Simpson hasn’t been the highest-quality company lately, it found a few growth initiatives in the past that worked out wonderfully. Its five-year average ROIC was 22.1%, splendid for an industrials business.
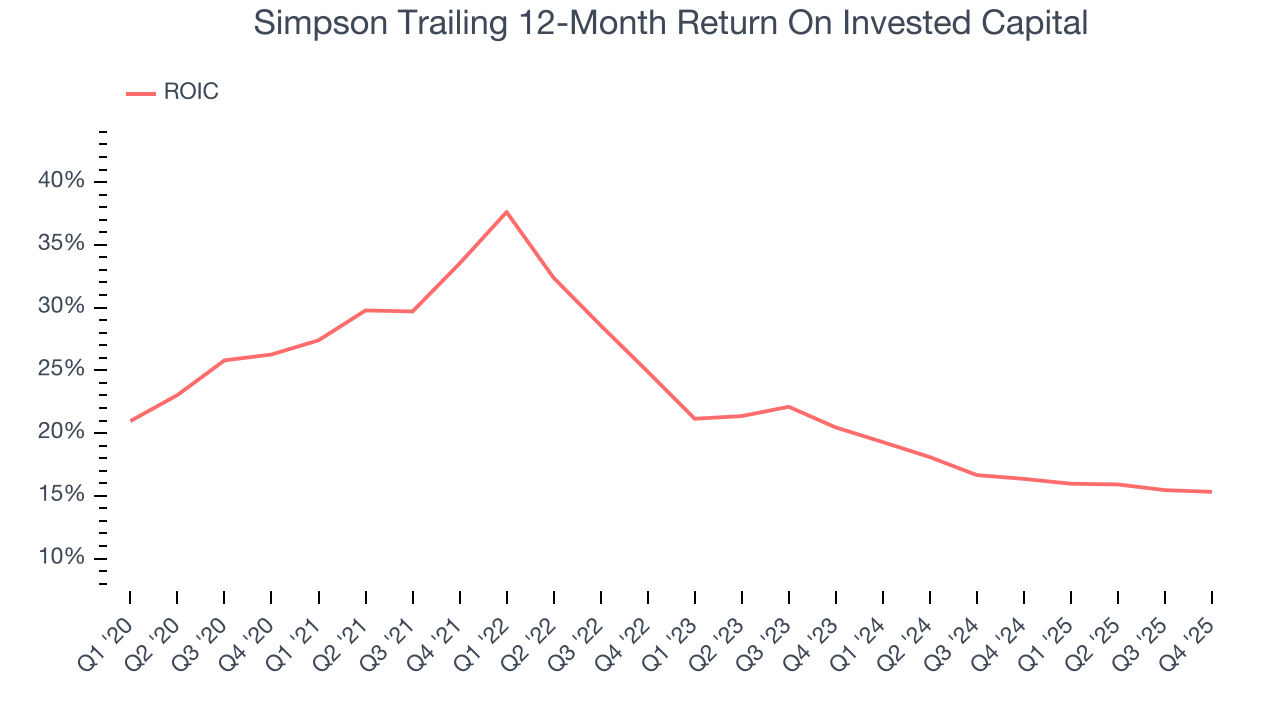
We like to invest in businesses with high returns, but the trend in a company’s ROIC is what often surprises the market and moves the stock price. Over the last few years, Simpson’s ROIC has unfortunately decreased significantly. We like what management has done in the past, but its declining returns are perhaps a symptom of fewer profitable growth opportunities.
11. Balance Sheet Assessment
Simpson reported $384.1 million of cash and $467.3 million of debt on its balance sheet in the most recent quarter. As investors in high-quality companies, we primarily focus on two things: 1) that a company’s debt level isn’t too high and 2) that its interest payments are not excessively burdening the business.
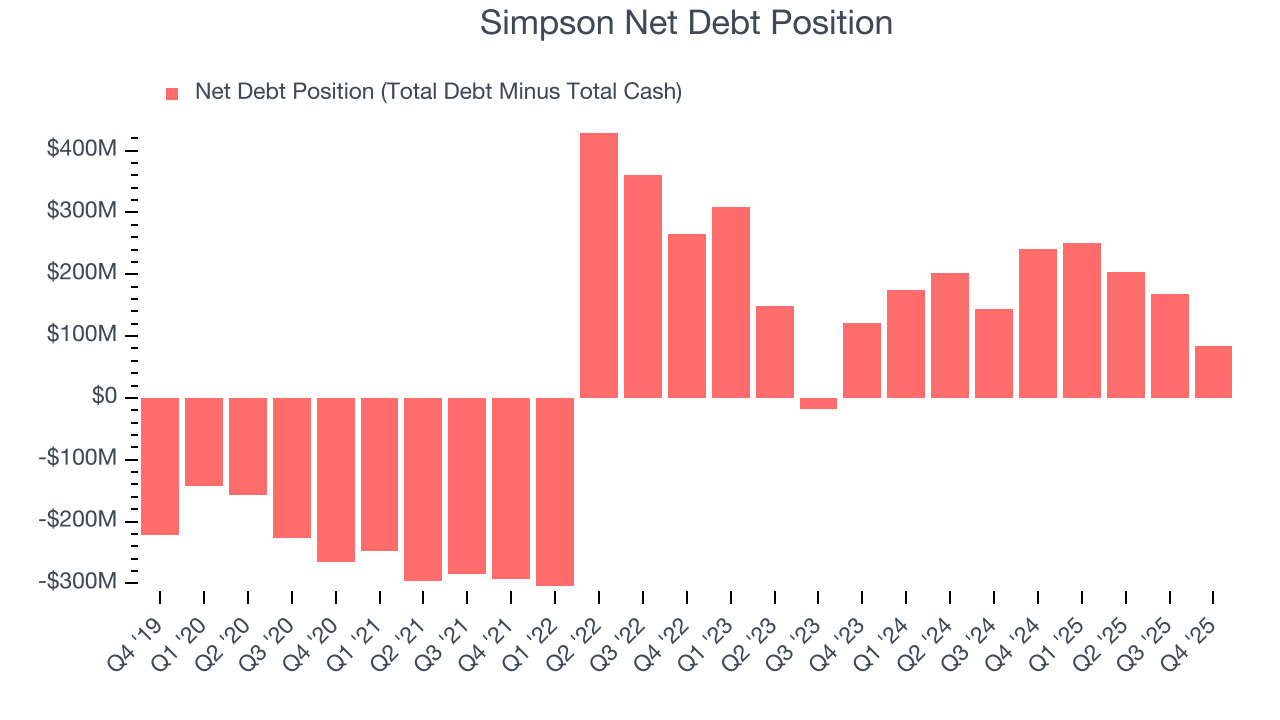
With $541.6 million of EBITDA over the last 12 months, we view Simpson’s 0.2× net-debt-to-EBITDA ratio as safe. We also see its $5.21 million of annual interest expenses as appropriate. The company’s profits give it plenty of breathing room, allowing it to continue investing in growth initiatives.
12. Key Takeaways from Simpson’s Q4 Results
We were impressed by how significantly Simpson blew past analysts’ EBITDA expectations this quarter. We were also happy its revenue outperformed Wall Street’s estimates. Zooming out, we think this quarter featured some important positives. The stock remained flat at $196.25 immediately following the results.
13. Is Now The Time To Buy Simpson?
Updated: March 20, 2026 at 10:08 PM EDT
The latest quarterly earnings matters, sure, but we actually think longer-term fundamentals and valuation matter more. Investors should consider all these pieces before deciding whether or not to invest in Simpson.
Simpson isn’t a terrible business, but it isn’t one of our picks. Although its revenue growth was impressive over the last five years, it’s expected to deteriorate over the next 12 months and its diminishing returns show management's prior bets haven't worked out. And while the company’s admirable gross margins indicate the mission-critical nature of its offerings, the downside is its declining operating margin shows the business has become less efficient.
Simpson’s P/E ratio based on the next 12 months is 19.2x. This valuation multiple is fair, but we don’t have much faith in the company. We're pretty confident there are superior stocks to buy right now.
Wall Street analysts have a consensus one-year price target of $213 on the company (compared to the current share price of $166.65).
Although the price target is bullish, readers should exercise caution because analysts tend to be overly optimistic. The firms they work for, often big banks, have relationships with companies that extend into fundraising, M&A advisory, and other rewarding business lines. As a result, they typically hesitate to say bad things for fear they will lose out. We at StockStory do not suffer from such conflicts of interest, so we’ll always tell it like it is.