Constellation Brands (STZ)
We’re cautious of Constellation Brands. Its low returns on capital and plummeting sales suggest it struggles to generate demand and profits, a red flag.― StockStory Analyst Team
1. News
2. Summary
Why We Think Constellation Brands Will Underperform
With a presence in more than 100 countries, Constellation Brands (NYSE:STZ) is a globally renowned producer and marketer of beer, wine, and spirits.
- Flat sales over the last three years suggest it must innovate and find new ways to grow
- Estimated sales decline of 3.1% for the next 12 months implies an even more challenging demand environment
- On the bright side, its impressive free cash flow profitability enables the company to fund new investments or reward investors with share buybacks/dividends, and its rising cash conversion increases its margin of safety


Constellation Brands fails to meet our quality criteria. Better businesses are for sale in the market.
Why There Are Better Opportunities Than Constellation Brands
High Quality
Investable
Underperform
Why There Are Better Opportunities Than Constellation Brands
Constellation Brands is trading at $160.48 per share, or 12.9x forward P/E. This multiple is cheaper than most consumer staples peers, but we think this is justified.
We’d rather pay up for companies with elite fundamentals than get a bargain on weak ones. Cheap stocks can be value traps, and as their performance deteriorates, they will stay cheap or get even cheaper.
3. Constellation Brands (STZ) Research Report: Q4 CY2025 Update
Beer, wine, and spirits company Constellation Brands (NYSE:STZ) reported Q4 CY2025 results exceeding the market’s revenue expectations, but sales fell by 9.8% year on year to $2.22 billion. Its non-GAAP profit of $3.06 per share was 16.2% above analysts’ consensus estimates.
Constellation Brands (STZ) Q4 CY2025 Highlights:
- Revenue: $2.22 billion vs analyst estimates of $2.16 billion (9.8% year-on-year decline, 2.9% beat)
- Adjusted EPS: $3.06 vs analyst estimates of $2.63 (16.2% beat)
- Adjusted EBITDA: $807.2 million vs analyst estimates of $790.1 million (36.3% margin, 2.2% beat)
- Management reiterated its full-year Adjusted EPS guidance of $11.45 at the midpoint
- Operating Margin: 31.1%, down from 32.2% in the same quarter last year
- Free Cash Flow Margin: 16.7%, down from 18.5% in the same quarter last year
- Organic Revenue fell 2% year on year vs analyst estimates of 4.4% declines (243.4 basis point beat)
- Market Capitalization: $25 billion
Company Overview
With a presence in more than 100 countries, Constellation Brands (NYSE:STZ) is a globally renowned producer and marketer of beer, wine, and spirits.
The company was founded in 1945 by Marvin Sands, originally selling bulk wine to bottlers in the eastern United States. Since then, it’s evolved into a beverage industry powerhouse by acquiring numerous brands.
Today, Constellation Brands boasts a diverse and impressive portfolio of labels including Corona Extra and Modelo Especial in beer, Kim Crawford and Meiomi in wine, and Svedka Vodka and Casa Noble Tequila in spirits. These brands cater to various consumer tastes and preferences, providing a broad spectrum of high-quality options.
Beyond its core brands, Constellation Brands is recognized for pioneering new trends and categories, such as premium imported beers, craft spirits, and ready-to-drink cocktails. It was also the first Fortune 500 company and major alcoholic beverage maker to invest in a marijuana business (Canopy Growth in 2017), a bold move speaking to the company’s corporate culture.
The company places a strong emphasis on premiumization, offering high-quality products that often command higher price points. Given its sheer size, Constellation Brands has a robust global presence, and this extensive reach enables it to tap into diverse international markets and cater to a wide range of consumer tastes, making it a recognized and trusted name worldwide.
4. Beverages, Alcohol, and Tobacco
These companies' performance is influenced by brand strength, marketing strategies, and shifts in consumer preferences. Changing consumption patterns are particularly relevant and can be seen in the rise of cannabis, craft beer, and vaping or the steady decline of soda and cigarettes. Companies that spend on innovation to meet consumers where they are with regards to trends can reap huge demand benefits while those who ignore trends can see stagnant volumes. Finally, with the advent of the social media, the cost of starting a brand from scratch is much lower, meaning that new entrants can chip away at the market shares of established players.
Competitors include Anheuser-Busch Inbev (NYSE:BUD), Boston Beer (NYSE:SAM), and Molson Coors (NYSE:TAP) along with international companies such as Asahi, Carlsberg, and Heineken.
5. Revenue Growth
A company’s long-term sales performance is one signal of its overall quality. Even a bad business can shine for one or two quarters, but a top-tier one grows for years.
With $9.38 billion in revenue over the past 12 months, Constellation Brands is one of the larger consumer staples companies and benefits from a well-known brand that influences purchasing decisions. However, its scale is a double-edged sword because it’s harder to find incremental growth when your existing brands have penetrated most of the market. To expand meaningfully, Constellation Brands likely needs to tweak its prices, innovate with new products, or enter new markets.
As you can see below, Constellation Brands struggled to increase demand as its $9.38 billion of sales for the trailing 12 months was close to its revenue three years ago. This shows demand was soft, a tough starting point for our analysis.
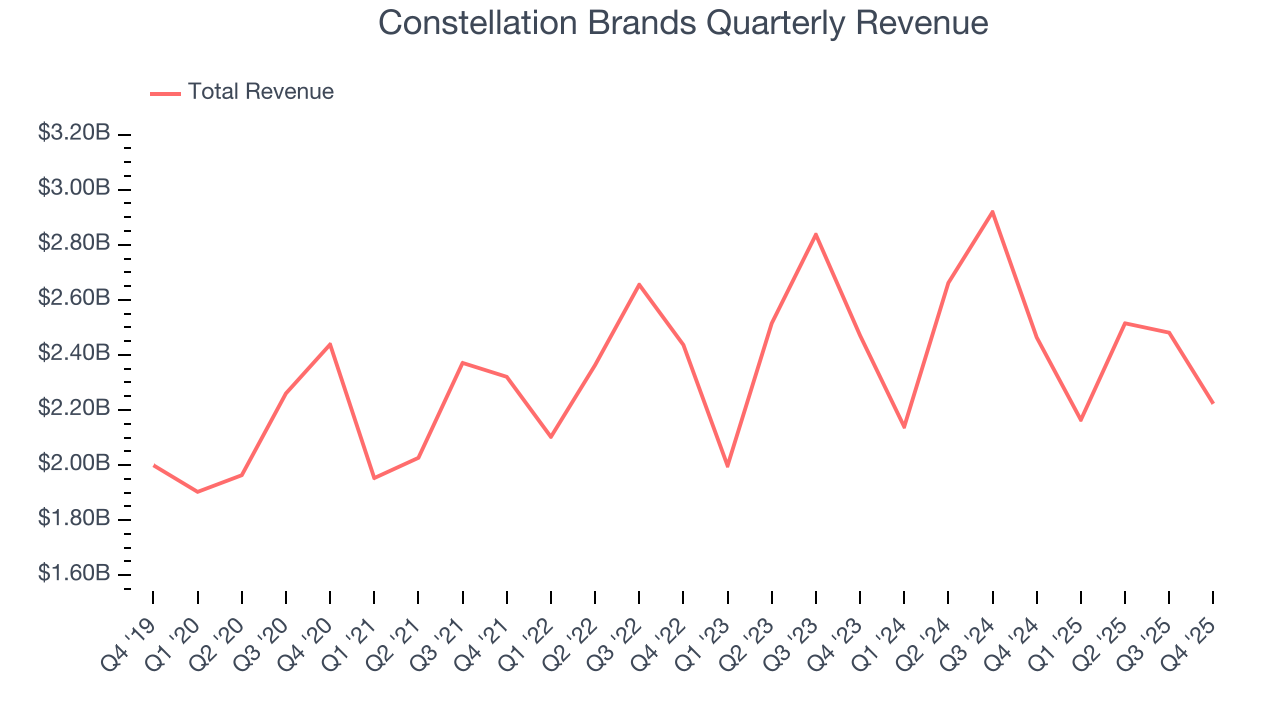
This quarter, Constellation Brands’s revenue fell by 9.8% year on year to $2.22 billion but beat Wall Street’s estimates by 2.9%.
Looking ahead, sell-side analysts expect revenue to decline by 3.6% over the next 12 months, a deceleration versus the last three years. This projection doesn't excite us and suggests its products will see some demand headwinds.
6. Organic Revenue Growth
When analyzing revenue growth, we care most about organic revenue growth. This metric captures a business’s performance excluding one-time events such as mergers, acquisitions, and divestitures as well as foreign currency fluctuations.
The demand for Constellation Brands’s products has barely risen over the last eight quarters. On average, the company’s organic sales have been flat. 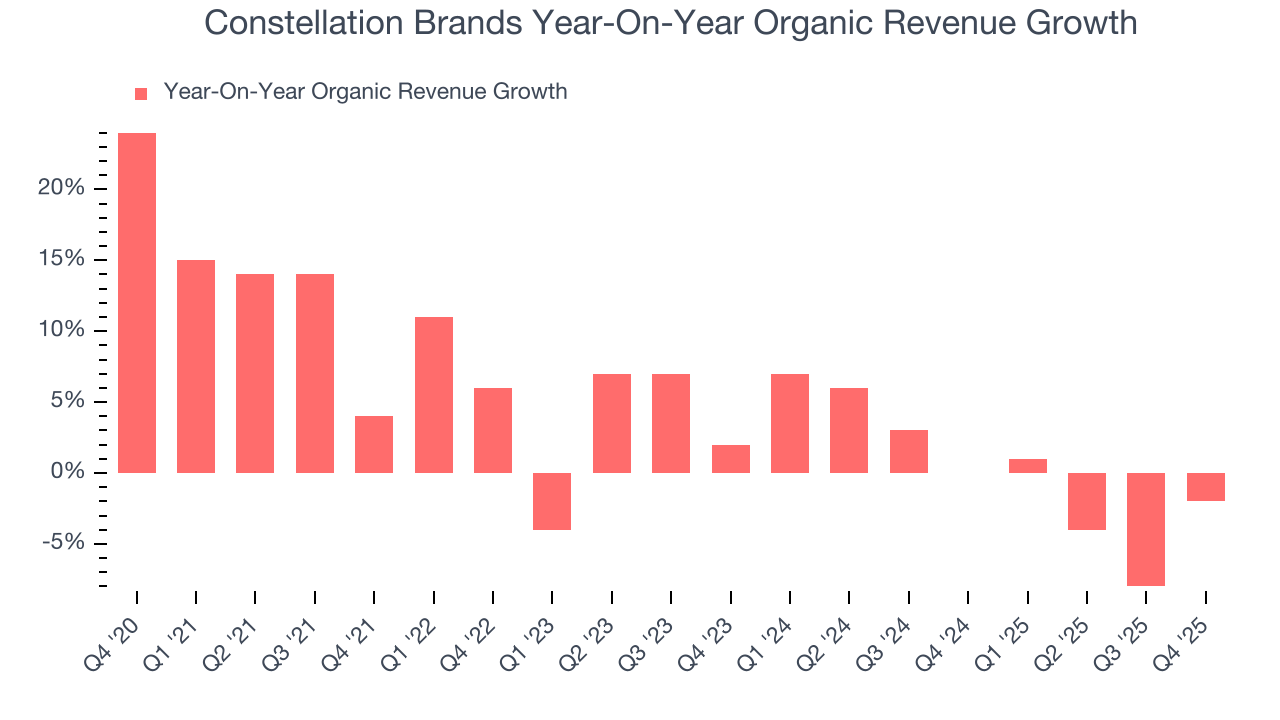
In the latest quarter, Constellation Brands’s organic sales fell by 2% year on year. This decline was a reversal from its historical levels. We’ll keep a close eye on the company to see if this turns into a longer-term trend.
7. Gross Margin & Pricing Power
Constellation Brands has great unit economics for a consumer staples company, giving it ample room to invest in areas such as marketing and talent to grow its brand. As you can see below, it averaged an excellent 51.8% gross margin over the last two years. That means for every $100 in revenue, only $48.18 went towards paying for raw materials, production of goods, transportation, and distribution. 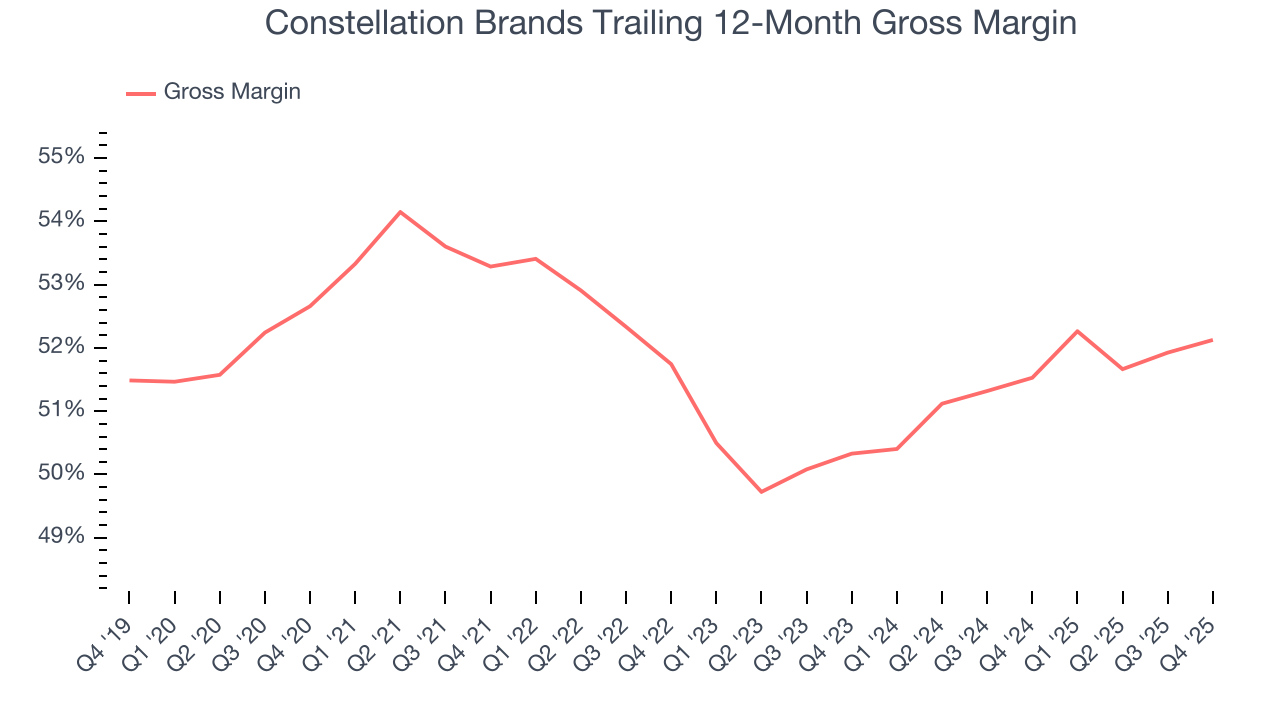
Constellation Brands produced a 53.2% gross profit margin in Q4, in line with the same quarter last year. On a wider time horizon, the company’s full-year margin has remained steady over the past four quarters, suggesting its input costs (such as raw materials and manufacturing expenses) have been stable and it isn’t under pressure to lower prices.
8. Operating Margin
Operating margin is an important measure of profitability as it shows the portion of revenue left after accounting for all core expenses – everything from the cost of goods sold to advertising and wages. It’s also useful for comparing profitability across companies with different levels of debt and tax rates because it excludes interest and taxes.
Constellation Brands has been an efficient company over the last two years. It was one of the more profitable businesses in the consumer staples sector, boasting an average operating margin of 16.7%. This result isn’t surprising as its high gross margin gives it a favorable starting point.
Analyzing the trend in its profitability, Constellation Brands’s operating margin rose by 11.6 percentage points over the last year, showing its efficiency has meaningfully improved.
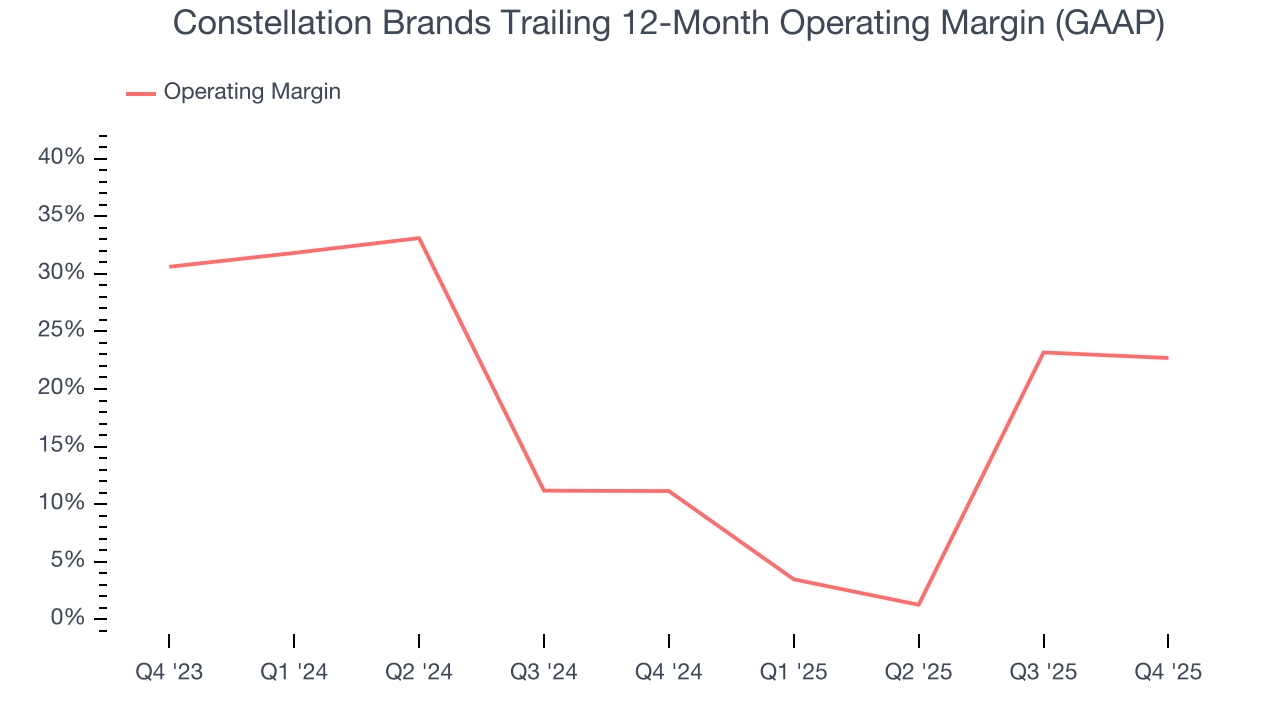
In Q4, Constellation Brands generated an operating margin profit margin of 31.1%, down 1.1 percentage points year on year. Since Constellation Brands’s operating margin decreased more than its gross margin, we can assume it was less efficient because expenses such as marketing, and administrative overhead increased.
9. Earnings Per Share
We track the long-term change in earnings per share (EPS) for the same reason as long-term revenue growth. Compared to revenue, however, EPS highlights whether a company’s growth is profitable.
Constellation Brands’s EPS grew at an unimpressive 4.4% compounded annual growth rate over the last three years. This performance was better than its flat revenue but doesn’t tell us much about its business quality because its operating margin didn’t improve.
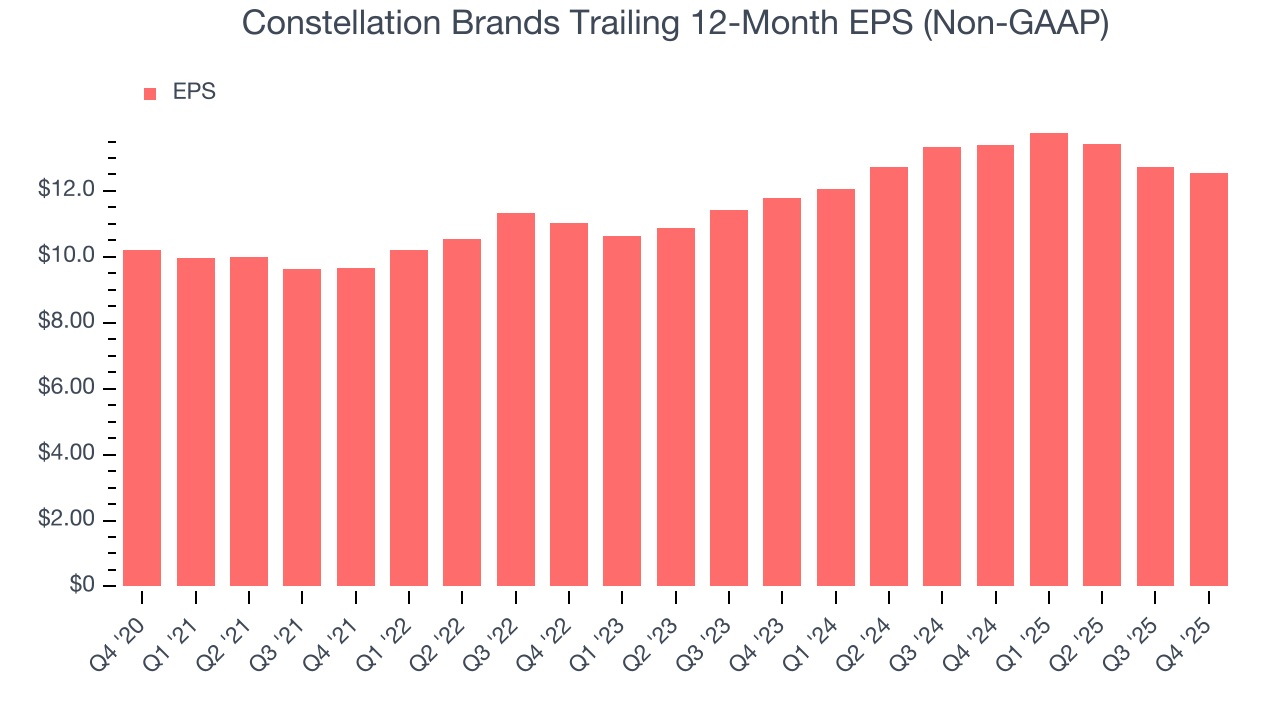
In Q4, Constellation Brands reported adjusted EPS of $3.06, down from $3.25 in the same quarter last year. Despite falling year on year, this print easily cleared analysts’ estimates. Over the next 12 months, Wall Street expects Constellation Brands’s full-year EPS of $12.54 to shrink by 3.9%.
10. Cash Is King
Free cash flow isn't a prominently featured metric in company financials and earnings releases, but we think it's telling because it accounts for all operating and capital expenses, making it tough to manipulate. Cash is king.
Constellation Brands has shown terrific cash profitability, driven by its lucrative business model that enables it to reinvest, return capital to investors, and stay ahead of the competition. The company’s free cash flow margin was among the best in the consumer staples sector, averaging 17.7% over the last two years.
Taking a step back, we can see that Constellation Brands’s margin expanded by 2.1 percentage points over the last year. This is encouraging because it gives the company more optionality.
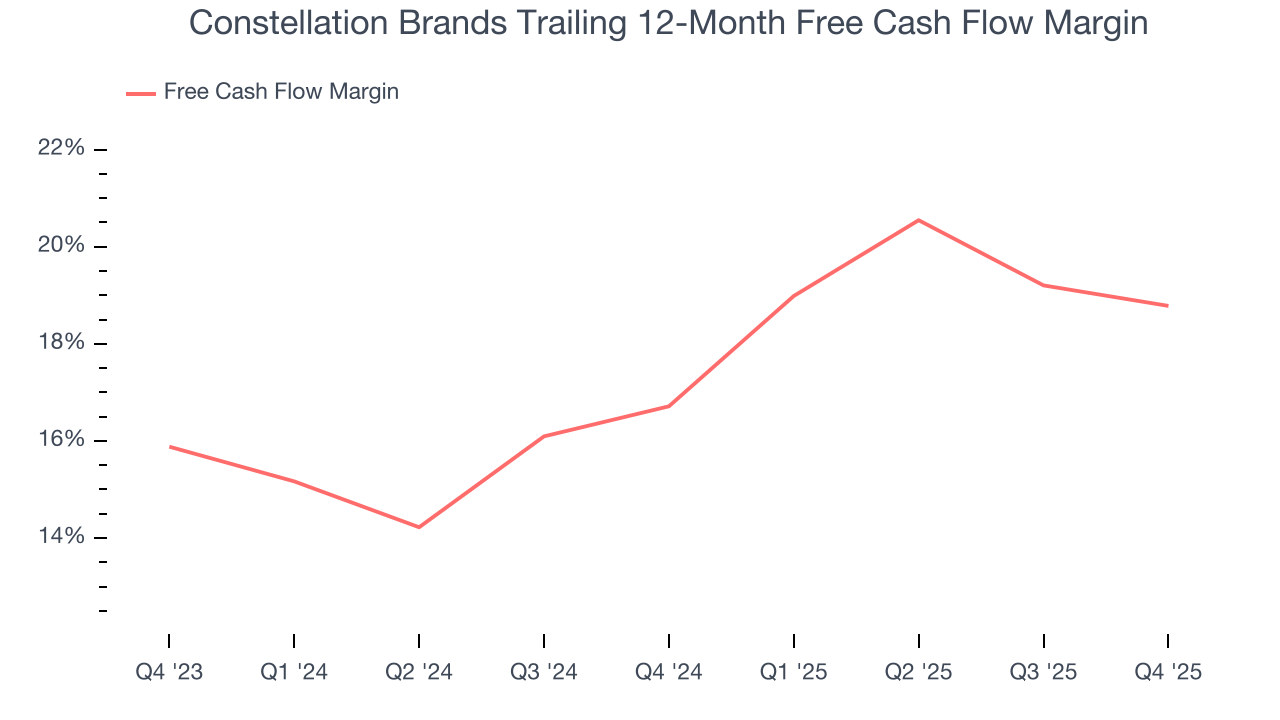
Constellation Brands’s free cash flow clocked in at $370.9 million in Q4, equivalent to a 16.7% margin. The company’s cash profitability regressed as it was 1.9 percentage points lower than in the same quarter last year. This warrants extra attention because consumer staples companies typically produce more consistent and defensive performance.
11. Return on Invested Capital (ROIC)
EPS and free cash flow tell us whether a company was profitable while growing its revenue. But was it capital-efficient? Enter ROIC, a metric showing how much operating profit a company generates relative to the money it has raised (debt and equity).
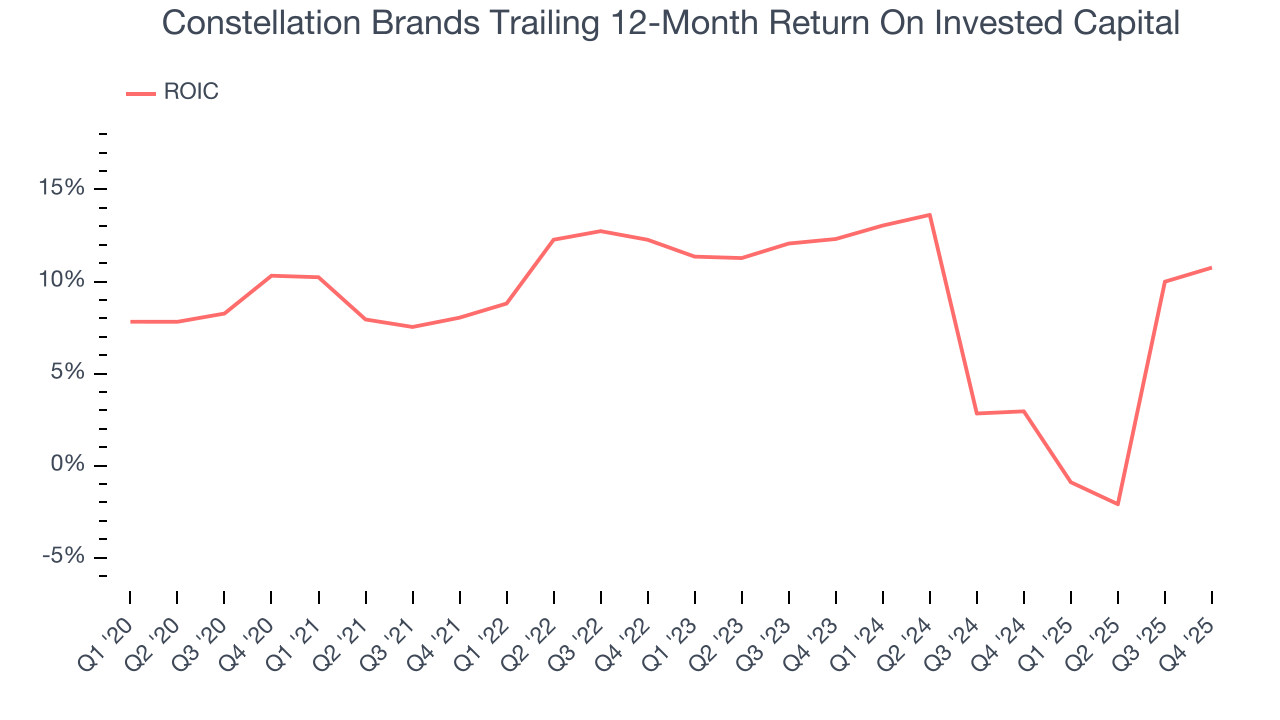
Constellation Brands historically did a mediocre job investing in profitable growth initiatives. Its five-year average ROIC was 9.3%, somewhat low compared to the best consumer staples companies that consistently pump out 20%+.
12. Balance Sheet Assessment
Constellation Brands reported $152.4 million of cash and $10.66 billion of debt on its balance sheet in the most recent quarter. As investors in high-quality companies, we primarily focus on two things: 1) that a company’s debt level isn’t too high and 2) that its interest payments are not excessively burdening the business.
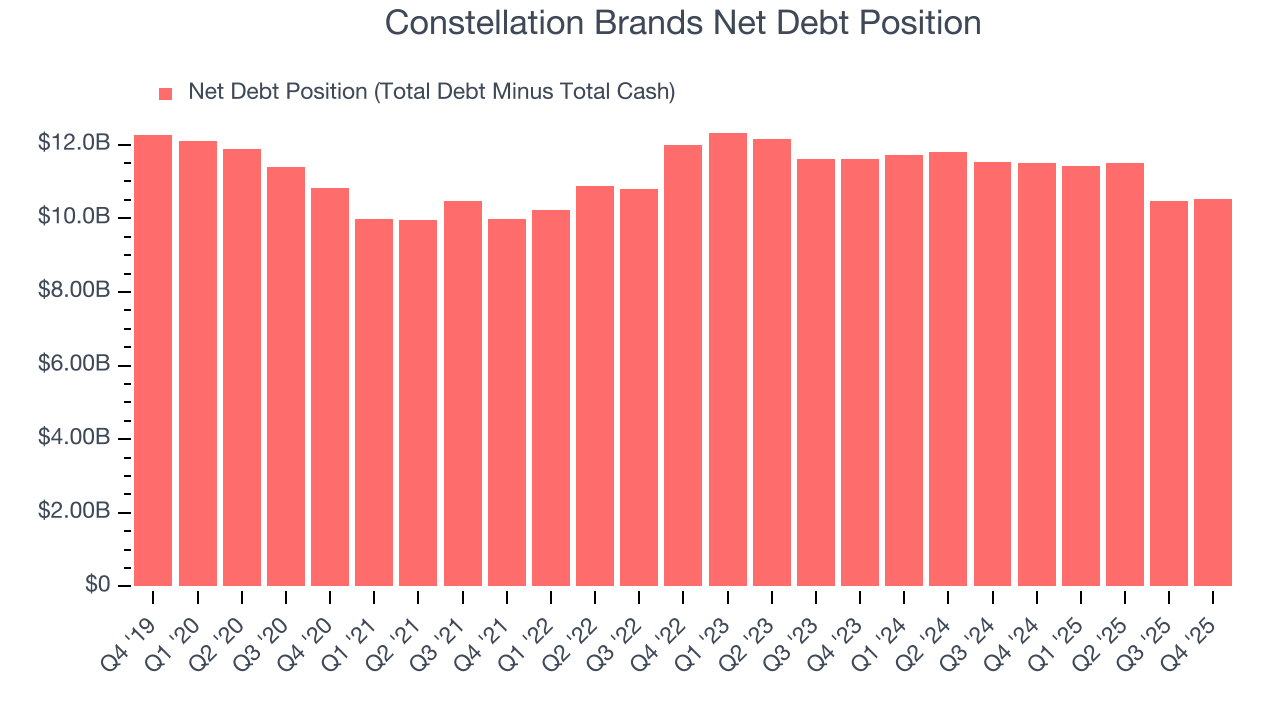
With $3.48 billion of EBITDA over the last 12 months, we view Constellation Brands’s 3.0× net-debt-to-EBITDA ratio as safe. We also see its $368.9 million of annual interest expenses as appropriate. The company’s profits give it plenty of breathing room, allowing it to continue investing in growth initiatives.
13. Key Takeaways from Constellation Brands’s Q4 Results
We enjoyed seeing Constellation Brands beat analysts’ organic revenue expectations this quarter. We were also glad its gross margin outperformed Wall Street’s estimates. Overall, we think this was a decent quarter with some key metrics above expectations. The stock traded up 1.9% to $144.20 immediately following the results.
14. Is Now The Time To Buy Constellation Brands?
Updated: February 3, 2026 at 9:56 PM EST
A common mistake we notice when investors are deciding whether to buy a stock or not is that they simply look at the latest earnings results. Business quality and valuation matter more, so we urge you to understand these dynamics as well.
Constellation Brands’s business quality ultimately falls short of our standards. For starters, its revenue has declined over the last three years, and analysts expect its demand to deteriorate over the next 12 months. And while Constellation Brands’s powerful free cash flow generation enables it to stay ahead of the competition through consistent reinvestment of profits, its projected EPS for the next year is lacking.
Constellation Brands’s P/E ratio based on the next 12 months is 12.9x. While this valuation is fair, the upside isn’t great compared to the potential downside. We're fairly confident there are better investments elsewhere.
Wall Street analysts have a consensus one-year price target of $170.73 on the company (compared to the current share price of $160.48).


