
Synchrony Financial (SYF)
Synchrony Financial is in a league of its own. Its eye-popping 32.5% annualized EPS growth over the last five years has significantly outpaced its peers.― StockStory Analyst Team
1. News


2. Summary
Why We Like Synchrony Financial
Powering over 73 million active accounts and partnerships with major brands like Amazon, PayPal, and Lowe's, Synchrony Financial (NYSE:SYF) provides credit cards, installment loans, and banking products through partnerships with retailers, healthcare providers, and digital platforms.
- Additional sales over the last five years increased its profitability as the 32.5% annual growth in its earnings per share outpaced its revenue
- Annual tangible book value per share growth of 20.8% over the past two years was outstanding, reflecting strong capital accumulation this cycle
- Industry-leading 23.1% return on equity demonstrates management’s skill in finding high-return investments


Synchrony Financial sets the bar. The valuation looks reasonable relative to its quality, and we think now is a favorable time to invest.
Why Is Now The Time To Buy Synchrony Financial?


Synchrony Financial’s stock price of $76.06 implies a valuation ratio of 8.5x forward P/E. This valuation is attractive, and we think the stock is likely trading below its intrinsic value when considering its fundamentals.
Our eyes light up when companies with elite fundamentals trade at bargain prices because shareholders can benefit from both earnings growth and a positive re-rating - a powerful one-two punch.
3. Synchrony Financial (SYF) Research Report: Q3 CY2025 Update
Consumer financial services company Synchrony Financial (NYSE:SYF) reported Q3 CY2025 results exceeding the market’s revenue expectations, but sales were flat year on year at $3.82 billion. Its GAAP profit of $2.86 per share was 28.9% above analysts’ consensus estimates.
Synchrony Financial (SYF) Q3 CY2025 Highlights:
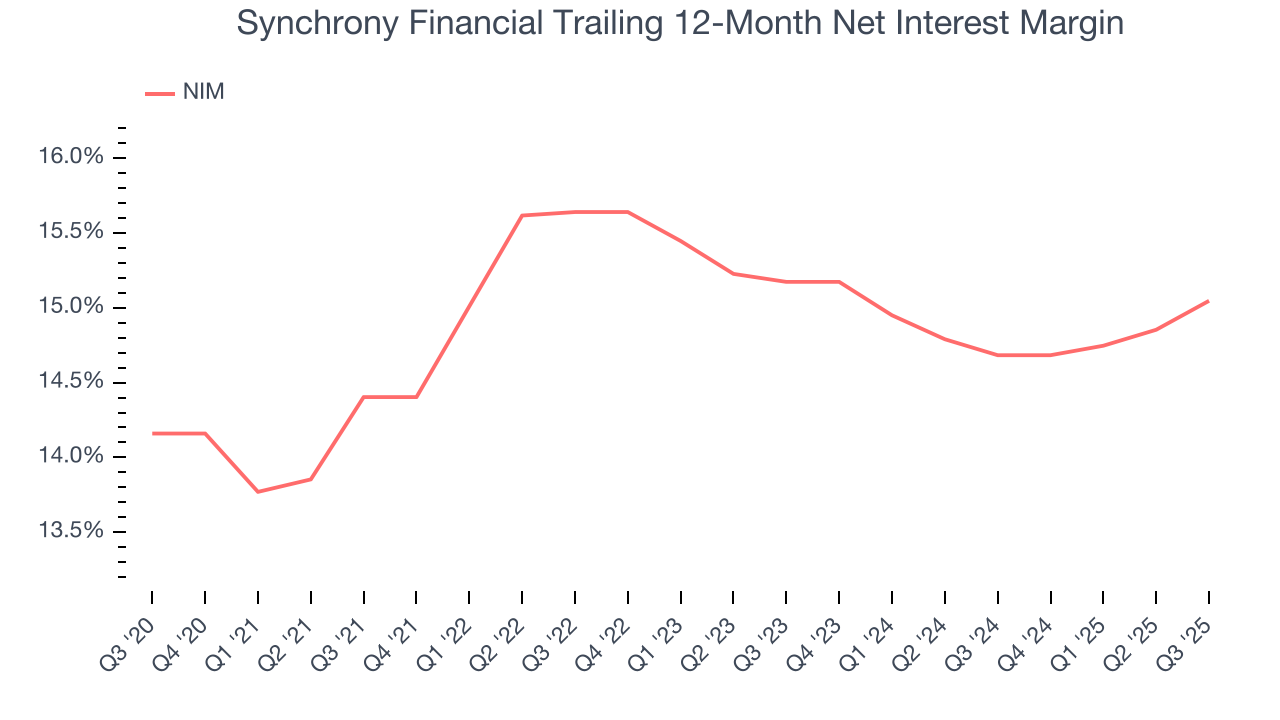
- Net Interest Margin: 15.6% vs analyst estimates of 15.3% (27.2 basis point beat)
- Revenue: $3.82 billion vs analyst estimates of $3.79 billion (flat year on year, 0.9% beat)
- Efficiency Ratio: 32.6% vs analyst estimates of 32% (59.9 basis point miss)
- EPS (GAAP): $2.86 vs analyst estimates of $2.22 (28.9% beat)
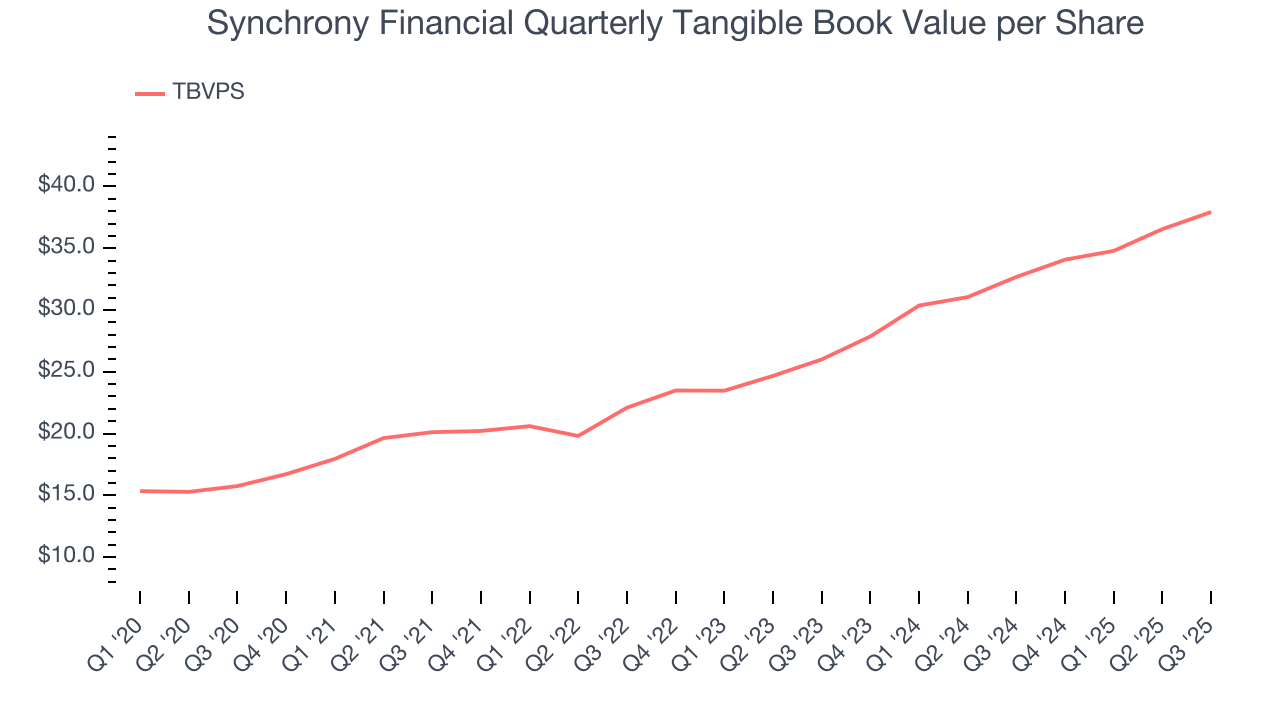
- Tangible Book Value per Share: $37.93 vs analyst estimates of $38.19 (16.1% year-on-year growth, 0.7% miss)
- Market Capitalization: $27.1 billion
Company Overview
Powering over 73 million active accounts and partnerships with major brands like Amazon, PayPal, and Lowe's, Synchrony Financial (NYSE:SYF) provides credit cards, installment loans, and banking products through partnerships with retailers, healthcare providers, and digital platforms.
Synchrony operates through five sales platforms: Home & Auto, Digital, Diversified & Value, Health & Wellness, and Lifestyle. Each platform serves specific industry segments, allowing Synchrony to tailor its credit solutions to particular consumer needs. The company's credit products include private label credit cards that can only be used at specific retailers, dual cards that function as both private label and general purpose credit cards, and installment loans for larger purchases.
The company's business model revolves around establishing long-term partnerships with retailers and service providers. These partners—which include major brands like Lowe's, Amazon, PayPal, Sam's Club, and Walgreens—promote Synchrony's credit products because they help increase sales and strengthen customer loyalty. When consumers use Synchrony's credit products, the company earns interest income from the balances carried on these accounts, as well as fees. For dual cards used outside partner networks, Synchrony also earns interchange fees.
Synchrony's CareCredit platform represents a significant specialized offering, providing healthcare financing through a network of over 270,000 provider locations. This allows patients to finance medical procedures, dental work, veterinary care, and other health-related expenses that may not be fully covered by insurance.
The company also operates a direct banking business, offering FDIC-insured deposit products including certificates of deposit, IRAs, money market accounts, and savings accounts. These deposits provide a stable, low-cost funding source for Synchrony's lending activities. The online banking platform allows Synchrony to expand its deposit base without relying on traditional branch networks.
Synchrony invests heavily in digital capabilities, with approximately 58% of consumer revolving credit applications processed through digital channels. The company's technology infrastructure enables seamless integration with partner systems, allowing for instant credit decisions at the point of sale, both in-store and online.
4. Credit Card
Credit card companies facilitate electronic payments and extend revolving credit to consumers. Growth comes from increasing digital payment adoption, cross-border transaction growth, and value-added services for cardholders and merchants. Challenges include regulatory scrutiny of fees and practices, competition from alternative payment methods, and potential credit losses during economic downturns.
Synchrony's primary competitors include major financial institutions that offer similar credit products, such as American Express, Bread Financial, Capital One, JPMorgan Chase, Citibank, TD Bank, and Wells Fargo. In the direct banking space, Synchrony competes for deposits with traditional banks and online-focused institutions like Ally Financial, Marcus by Goldman Sachs, and Discover.
5. Revenue Growth
A company’s long-term performance is an indicator of its overall quality. Any business can have short-term success, but a top-tier one grows for years. Over the last five years, Synchrony Financial grew its revenue at a tepid 5.3% compounded annual growth rate. This wasn’t a great result compared to the rest of the financials sector, but there are still things to like about Synchrony Financial.
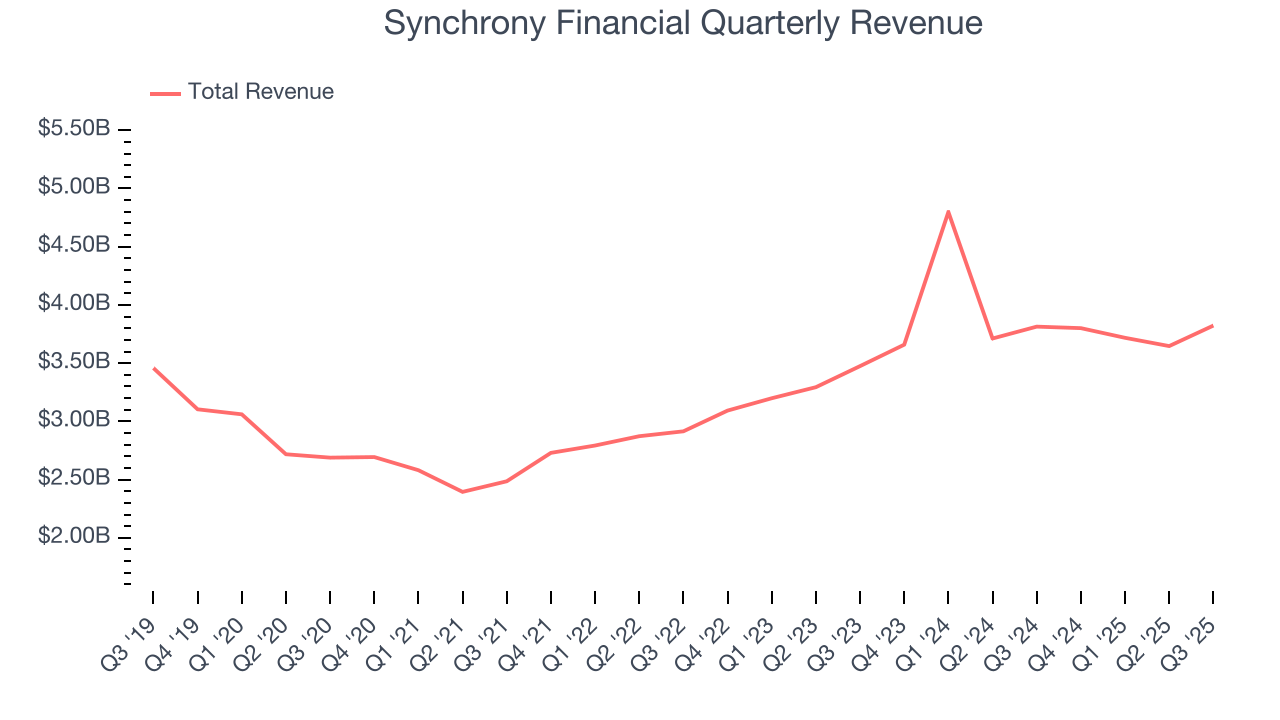
We at StockStory place the most emphasis on long-term growth, but within financials, a half-decade historical view may miss recent interest rate changes, market returns, and industry trends. Synchrony Financial’s annualized revenue growth of 7.1% over the last two years is above its five-year trend, but we were still disappointed by the results. 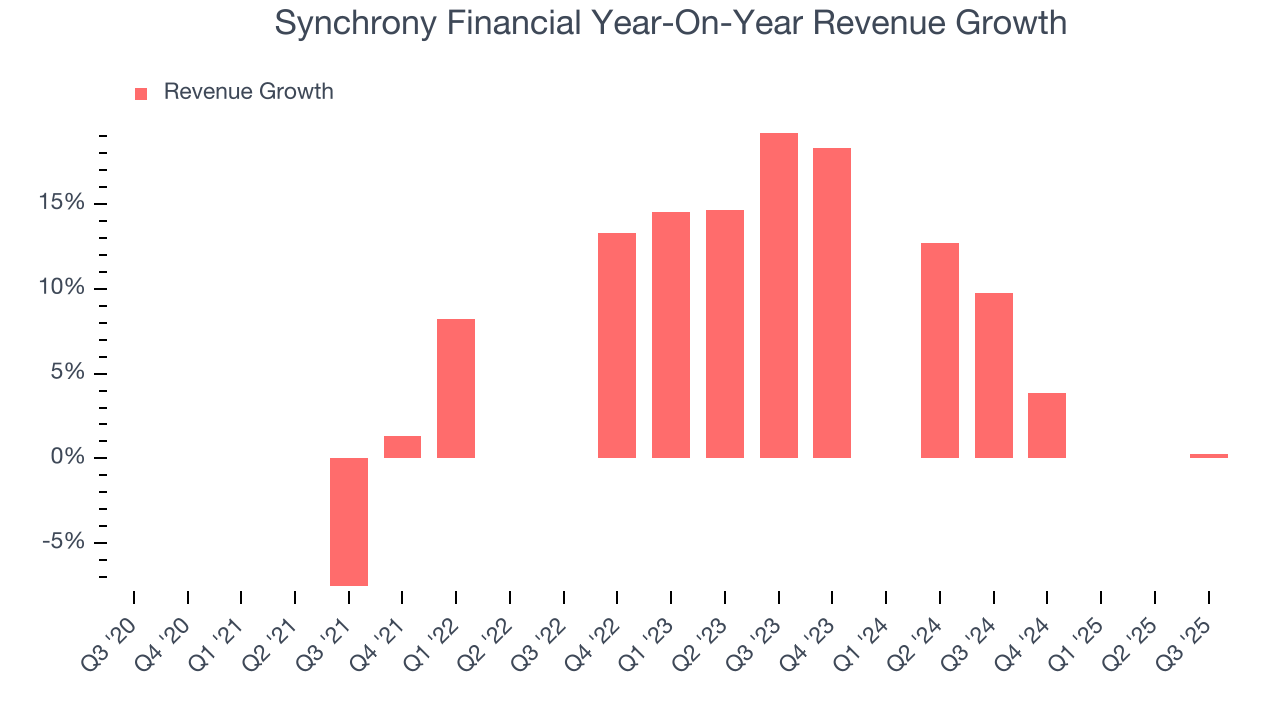 Note: Quarters not shown were determined to be outliers, impacted by outsized investment gains/losses that are not indicative of the recurring fundamentals of the business.
This quarter, Synchrony Financial’s $3.82 billion of revenue was flat year on year but beat Wall Street’s estimates by 0.9%.
6. Net Interest Margin
The net interest margin (NIM) is a key profitability indicator that measures the difference between what a financial institution earns on its loans and what it pays on its deposits. This metric measures how efficiently one can generate income from its core lending activities.
Synchrony Financial’s net interest margin has increased by 88.7 basis points (100 basis points = 1 percentage point) over the last five years but decreased by 12.7 basis points on a two-year basis. Although the longer-term change is reassuring, the two-year result was worse than the financials industry. The firm’s NIM for the trailing 12 months was 15%.
7. Efficiency Ratio
The underlying profitability of top-line growth determines the actual bottom-line impact. Credit Card companies measure this dynamic using the efficiency ratio, which is calculated by dividing non-interest expenses like personnel, facilities, technology, and marketing by total revenue.
Markets understand that a lender’s expense base depends on its revenue mix and what mostly drives share price performance is the change in this ratio, rather than its absolute value. It’s somewhat counterintuitive, but a lower efficiency ratio is better.
Over the last five years, Synchrony Financial’s efficiency ratio has swelled by 2.9 percentage points, going from 38.1% to 33.4%. It has also improved by 1.2 percentage points on a two-year basis, showing its expenses have consistently grown at a slower rate than revenue. This typically signals prudent management.
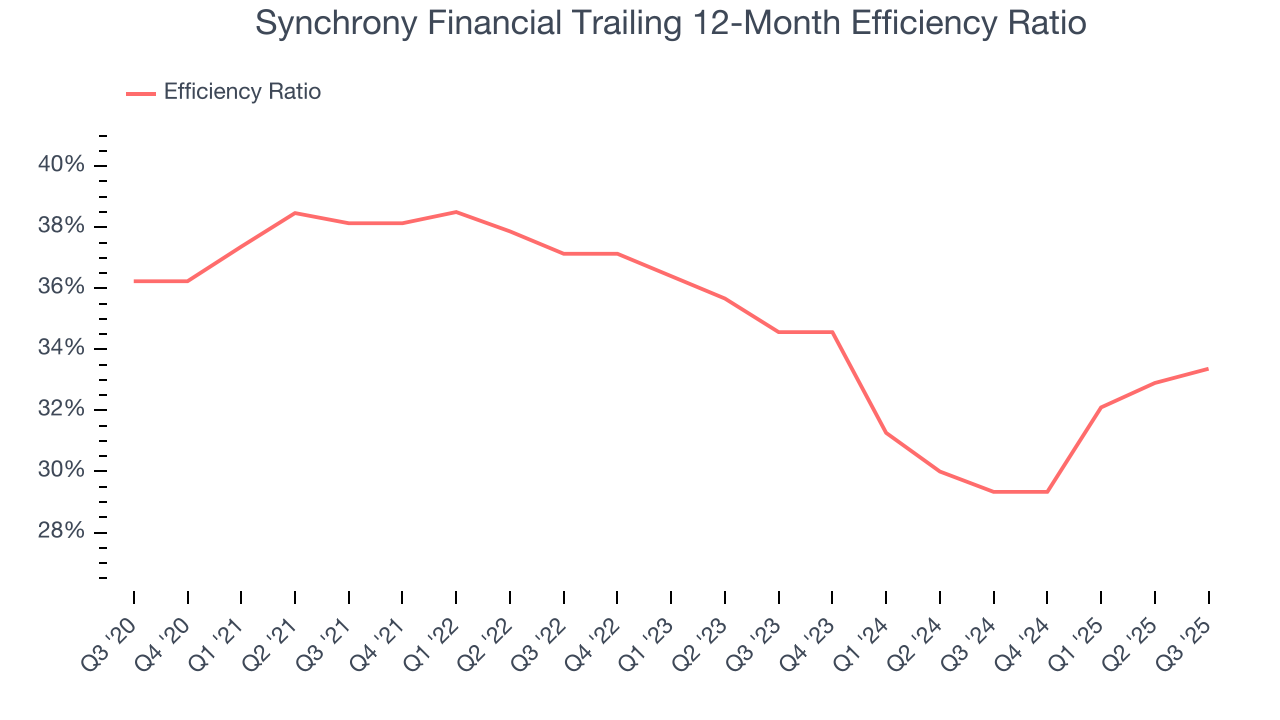
In Q3, Synchrony Financial’s efficiency ratio was 32.6%, falling short of analysts’ expectations by 59.9 basis points (100 basis points = 1 percentage point). This result was 1.4 percentage points worse than the same quarter last year.
8. Earnings Per Share
Revenue trends explain a company’s historical growth, but the long-term change in earnings per share (EPS) points to the profitability of that growth – for example, a company could inflate its sales through excessive spending on advertising and promotions.
Synchrony Financial’s EPS grew at an astounding 33.3% compounded annual growth rate over the last five years, higher than its 5.3% annualized revenue growth. This tells us the company became more profitable on a per-share basis as it expanded.
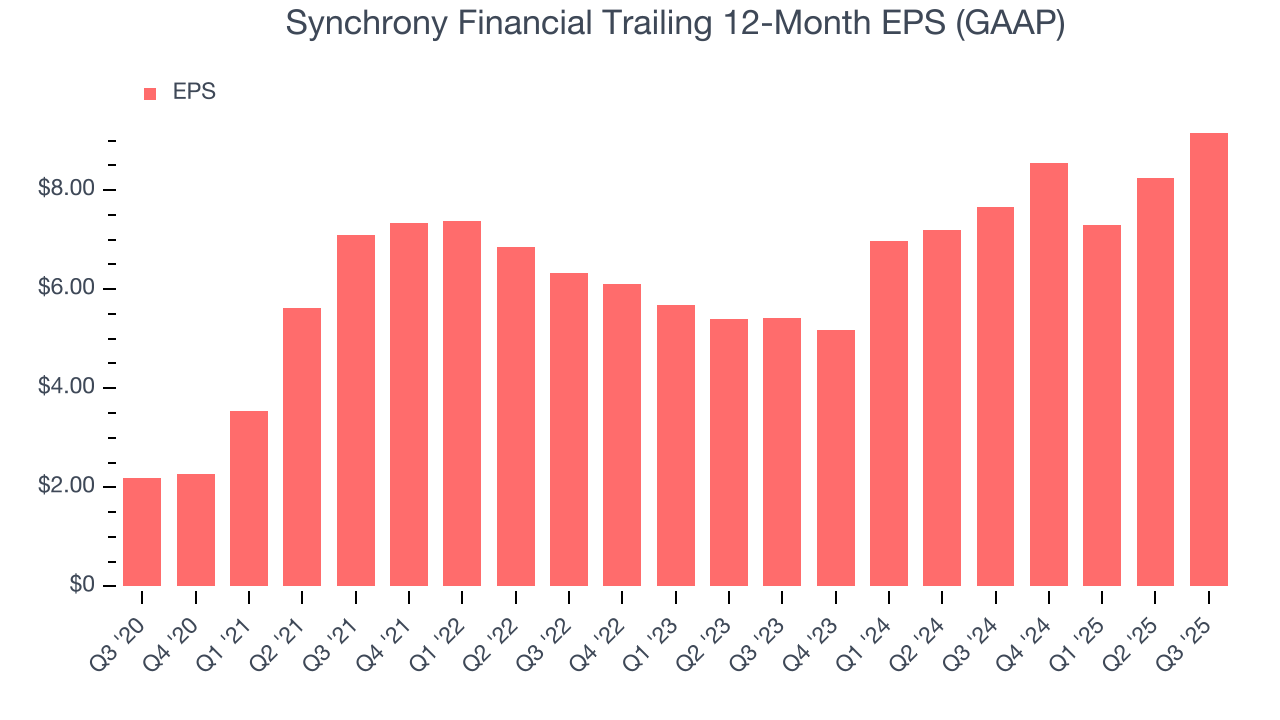
Like with revenue, we analyze EPS over a shorter period to see if we are missing a change in the business.
For Synchrony Financial, its two-year annual EPS growth of 30.1% was lower than its five-year trend. We still think its growth was good and hope it can accelerate in the future.
In Q3, Synchrony Financial reported EPS of $2.86, up from $1.94 in the same quarter last year. This print easily cleared analysts’ estimates, and shareholders should be content with the results. Over the next 12 months, Wall Street expects Synchrony Financial’s full-year EPS of $9.16 to stay about the same.
9. Tangible Book Value Per Share (TBVPS)
Financial firms are valued based on their balance sheet strength and ability to compound book value across diverse business lines.
This explains why tangible book value per share (TBVPS) is a premier metric for the sector. TBVPS provides concrete per-share net worth that investors can trust when evaluating companies with complex, multi-faceted business models. On the other hand, EPS is often distorted by the diverse nature of operations, mergers, and various accounting treatments across different business units. Book value provides clearer performance insights.
Synchrony Financial’s TBVPS grew at an exceptional 19.2% annual clip over the last five years. TBVPS growth has also accelerated recently, growing by 20.8% annually over the last two years from $26.00 to $37.93 per share.
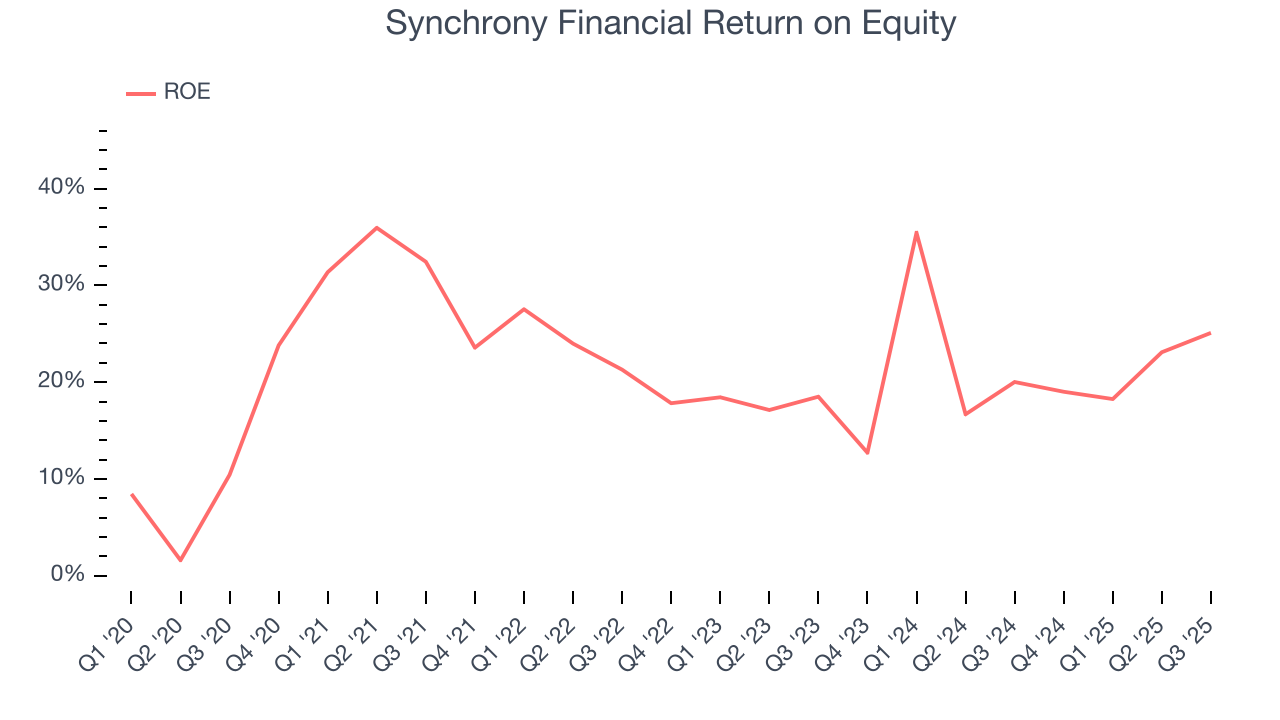
10. Return on Equity
Return on equity (ROE) measures how effectively banks generate profit from each dollar of shareholder equity - a critical funding source. High-ROE institutions typically compound shareholder wealth faster over time through retained earnings, share repurchases, and dividend payments.
Over the last five years, Synchrony Financial has averaged an ROE of 23.1%, exceptional for a company operating in a sector where the average shakes out around 10% and those putting up 25%+ are greatly admired. This shows Synchrony Financial has a strong competitive moat.
11. Balance Sheet Assessment
The debt-to-equity ratio is a widely used measure to assess a company's balance sheet health. A higher ratio means that a business aggressively financed its growth with debt. This can result in higher earnings (if the borrowed funds are invested profitably) but also increases risk.
If debt levels are too high, there could be difficulties in meeting obligations, especially during economic downturns or periods of rising interest rates if the debt has variable-rate payments.
Synchrony Financial has no debt, so leverage is not an issue here.
12. Key Takeaways from Synchrony Financial’s Q3 Results
It was good to see Synchrony Financial beat analysts’ EPS expectations this quarter. We were also excited its net interest margin outperformed Wall Street’s estimates by a wide margin. On the other hand, efficiency ratio and tangible book value per share fell short. Zooming out, we think this quarter was mixed. The market seemed to be hoping for more, and the stock traded down 1.2% to $71.90 immediately following the results.
13. Is Now The Time To Buy Synchrony Financial?
Updated: January 23, 2026 at 11:02 PM EST
The latest quarterly earnings matters, sure, but we actually think longer-term fundamentals and valuation matter more. Investors should consider all these pieces before deciding whether or not to invest in Synchrony Financial.
Synchrony Financial is an amazing business ranking highly on our list. Although its revenue growth was uninspiring over the last five years with analysts expecting growth to slow even further from here, its astounding EPS growth over the last five years shows its profits are trickling down to shareholders. On top of that, Synchrony Financial’s expanding net interest margin shows its loan book is becoming more profitable.
Synchrony Financial’s P/E ratio based on the next 12 months is 8.5x. Analyzing the financials landscape today, Synchrony Financial’s positive attributes shine bright. We think it’s one of the best businesses in our coverage and love the stock at this bargain price.
Wall Street analysts have a consensus one-year price target of $92.61 on the company (compared to the current share price of $76.06), implying they see 21.8% upside in buying Synchrony Financial in the short term.