Sysco (SYY)
Sysco is in for a bumpy ride. Its sales have underperformed and its low returns on capital show it has few growth opportunities.― StockStory Analyst Team
1. News
2. Summary
Why We Think Sysco Will Underperform
Powering more than 730,000 commercial kitchens across North America and Europe, Sysco (NYSE:SYY) is a global food distributor that supplies restaurants, healthcare facilities, schools, hotels, and other foodservice establishments with food products and related services.
- Sizable revenue base leads to growth challenges as its 10.7% annual revenue increases over the last five years fell short of other consumer discretionary companies
- Poor expense management has led to an operating margin that is below the industry average
- Low free cash flow margin gives it little breathing room, constraining its ability to self-fund growth or return capital to shareholders


Sysco’s quality is not up to our standards. We believe there are better businesses elsewhere.
Why There Are Better Opportunities Than Sysco

Sysco is trading at $78.50 per share, or 16.6x forward P/E. This multiple is lower than most consumer discretionary companies, but for good reason.
It’s better to pay up for high-quality businesses with higher long-term earnings potential rather than to buy lower-quality stocks because they appear cheap. These challenged businesses often don’t re-rate, a phenomenon known as a “value trap”.
3. Sysco (SYY) Research Report: Q3 CY2025 Update
Food distribution giant Sysco (NYSE:SYY) met Wall Streets revenue expectations in Q3 CY2025, with sales up 3.2% year on year to $21.15 billion. Its non-GAAP profit of $1.15 per share was 2.6% above analysts’ consensus estimates.
Sysco (SYY) Q3 CY2025 Highlights:
- Revenue: $21.15 billion vs analyst estimates of $21.07 billion (3.2% year-on-year growth, in line)
- Adjusted EPS: $1.15 vs analyst estimates of $1.12 (2.6% beat)
- Adjusted EBITDA: $1.07 billion vs analyst estimates of $1.11 billion (5.1% margin, 3.8% miss)
- Operating Margin: 3.8%, in line with the same quarter last year
- Free Cash Flow was -$74 million compared to -$69 million in the same quarter last year
- Sales Volumes were flat year on year (2.5% in the same quarter last year)
- Market Capitalization: $36.92 billion
Company Overview
Powering more than 730,000 commercial kitchens across North America and Europe, Sysco (NYSE:SYY) is a global food distributor that supplies restaurants, healthcare facilities, schools, hotels, and other foodservice establishments with food products and related services.
Sysco's business revolves around providing a comprehensive range of products essential to foodservice operations. These include frozen foods, fresh meats and seafood, dairy products, canned and dry goods, fresh produce, beverages, and imported specialties. Beyond food, Sysco supplies non-food items such as disposable tableware, cookware, kitchen equipment, and cleaning supplies. The company operates through three main segments: U.S. Foodservice Operations (including Broadline and Specialty operations), International Foodservice Operations (spanning Canada, Europe, and other international markets), and SYGMA (serving quick-service restaurant chains).
Foodservice professionals rely on Sysco's distribution network for consistent, timely deliveries that keep their operations running smoothly. For example, a hospital might depend on Sysco for everything from fresh produce for patient meals to disposable containers for its cafeteria. A fine dining restaurant might source specialty meats, imported cheeses, and kitchen equipment all from the same Sysco delivery truck. The company generates revenue through product markups and also offers value-added services like menu planning, inventory management, and food safety training.
Sysco enhances its product offerings with private-label brands that undergo rigorous quality assurance testing. Its distribution centers are strategically located to enable daily deliveries and quick-turn special orders, providing customers with both reliability and flexibility. Sales and marketing representatives maintain relationships with customers, introducing new products and helping them optimize their foodservice operations.
4. Distributors
Distributors serve as intermediaries connecting manufacturers with retailers or end customers, managing logistics, inventory, and fulfillment across various product categories. Tailwinds include supply chain complexity driving demand for specialized distribution expertise, e-commerce growth requiring robust fulfillment networks, and businesses outsourcing logistics to focus on core operations. Consolidation opportunities may benefit scale players. Headwinds include margin pressure from powerful suppliers and customers, competition from manufacturers selling direct, and rising transportation and labor costs. Additionally, economic downturns reduce demand volumes, while inventory management challenges and potential supply chain disruptions introduce operational risks requiring sophisticated systems.
Sysco's main competitors include US Foods Holding Corp (NYSE:USFD), Performance Food Group (NYSE:PFGC), and Gordon Food Service, along with numerous regional food distributors and wholesalers.
5. Revenue Growth
A company’s long-term performance is an indicator of its overall quality. Any business can put up a good quarter or two, but the best consistently grow over the long haul. Over the last five years, Sysco grew its sales at a 10.7% compounded annual growth rate. Although this growth is acceptable on an absolute basis, it fell short of our standards for the consumer discretionary sector, which enjoys a number of secular tailwinds.
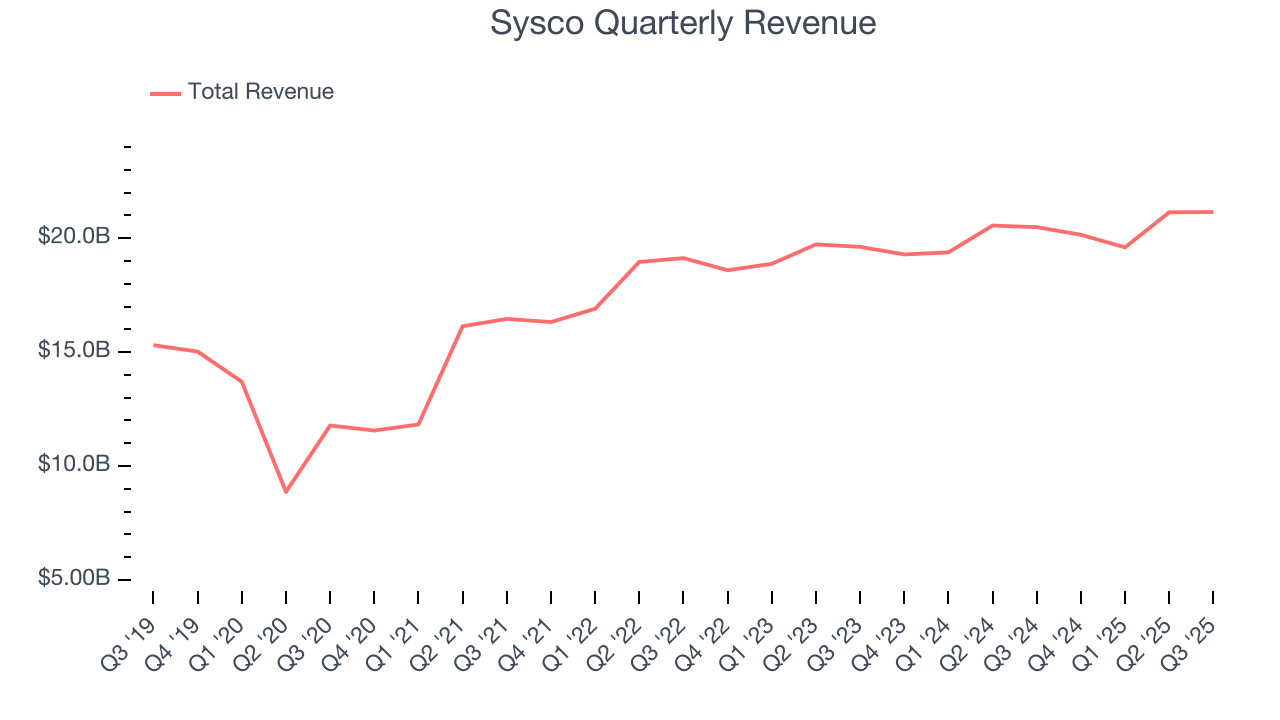
We at StockStory place the most emphasis on long-term growth, but within consumer discretionary, a stretched historical view may miss a company riding a successful new product or trend. Sysco’s recent performance shows its demand has slowed as its annualized revenue growth of 3.3% over the last two years was below its five-year trend. 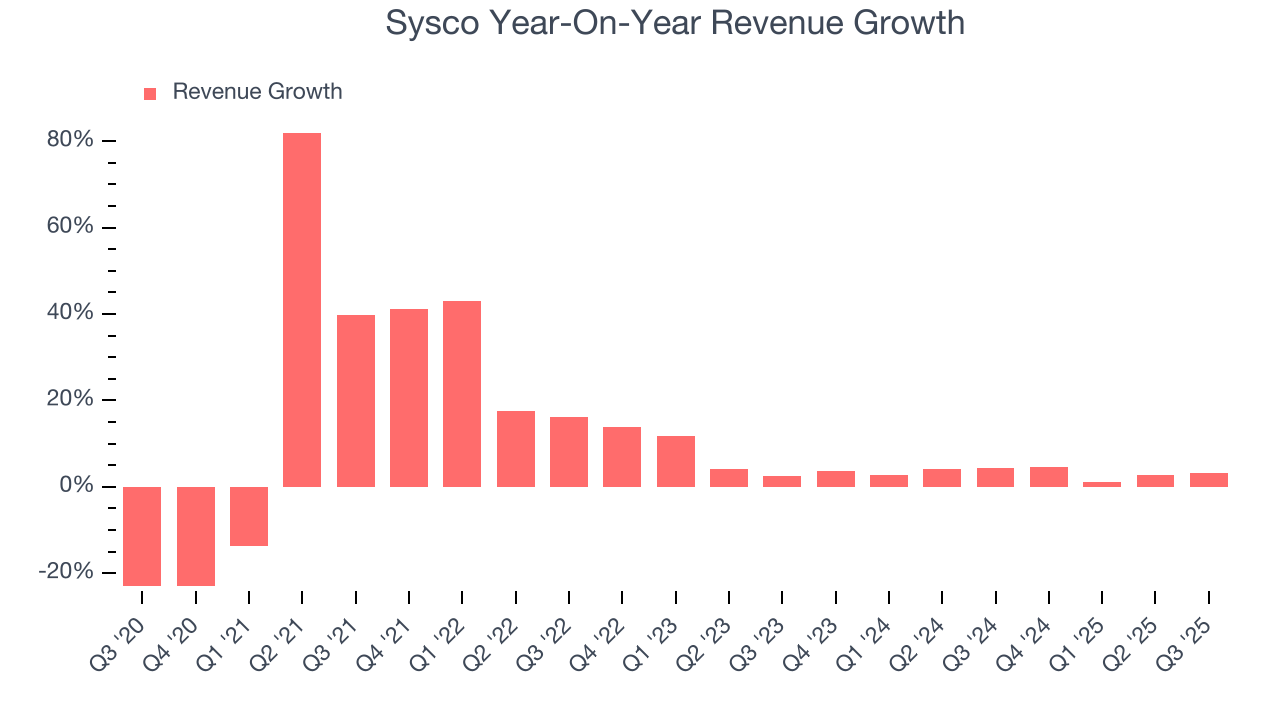
Sysco also reports its number of units sold. Over the last two years, Sysco’s units sold averaged 1.4% year-on-year growth. Because this number is lower than its revenue growth, we can see the company benefited from price increases. 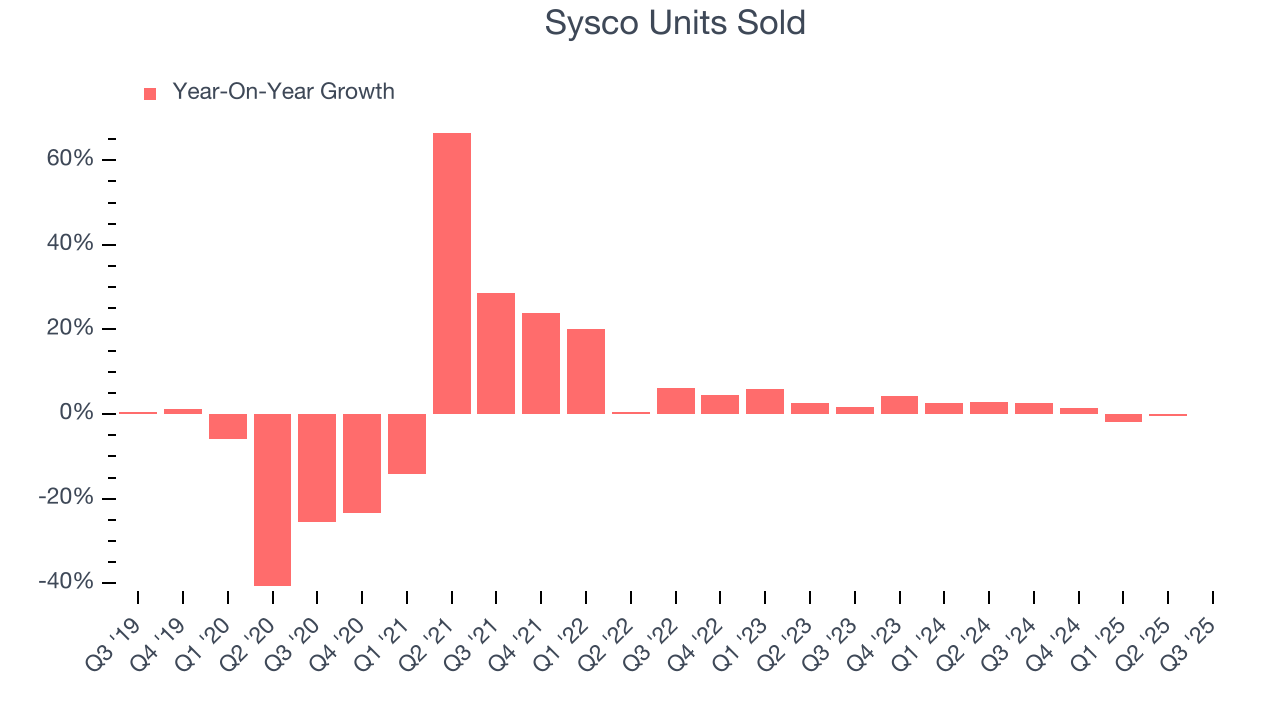
This quarter, Sysco grew its revenue by 3.2% year on year, and its $21.15 billion of revenue was in line with Wall Street’s estimates.
Looking ahead, sell-side analysts expect revenue to grow 4.1% over the next 12 months, similar to its two-year rate. This projection doesn't excite us and implies its newer products and services will not lead to better top-line performance yet.
6. Operating Margin
Operating margin is an important measure of profitability as it shows the portion of revenue left after accounting for all core expenses – everything from the cost of goods sold to advertising and wages. It’s also useful for comparing profitability across companies with different levels of debt and tax rates because it excludes interest and taxes.
Sysco’s operating margin might fluctuated slightly over the last 12 months but has remained more or less the same, averaging 3.9% over the last two years. This profitability was inadequate for a consumer discretionary business and caused by its suboptimal cost structure.
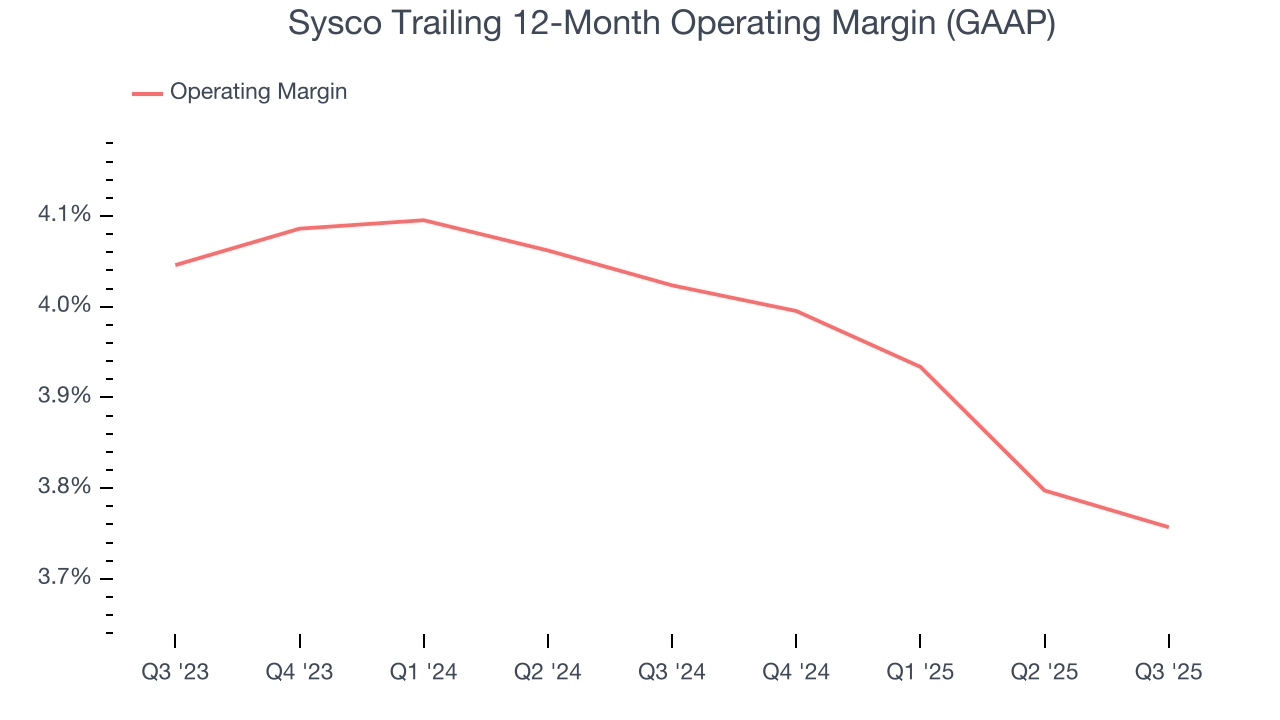
In Q3, Sysco generated an operating margin profit margin of 3.8%, in line with the same quarter last year. This indicates the company’s overall cost structure has been relatively stable.
7. Earnings Per Share
We track the long-term change in earnings per share (EPS) for the same reason as long-term revenue growth. Compared to revenue, however, EPS highlights whether a company’s growth is profitable.
Sysco’s EPS grew at an unimpressive 27.3% compounded annual growth rate over the last five years. This performance was better than its flat revenue but doesn’t tell us much about its business quality because its operating margin didn’t improve.
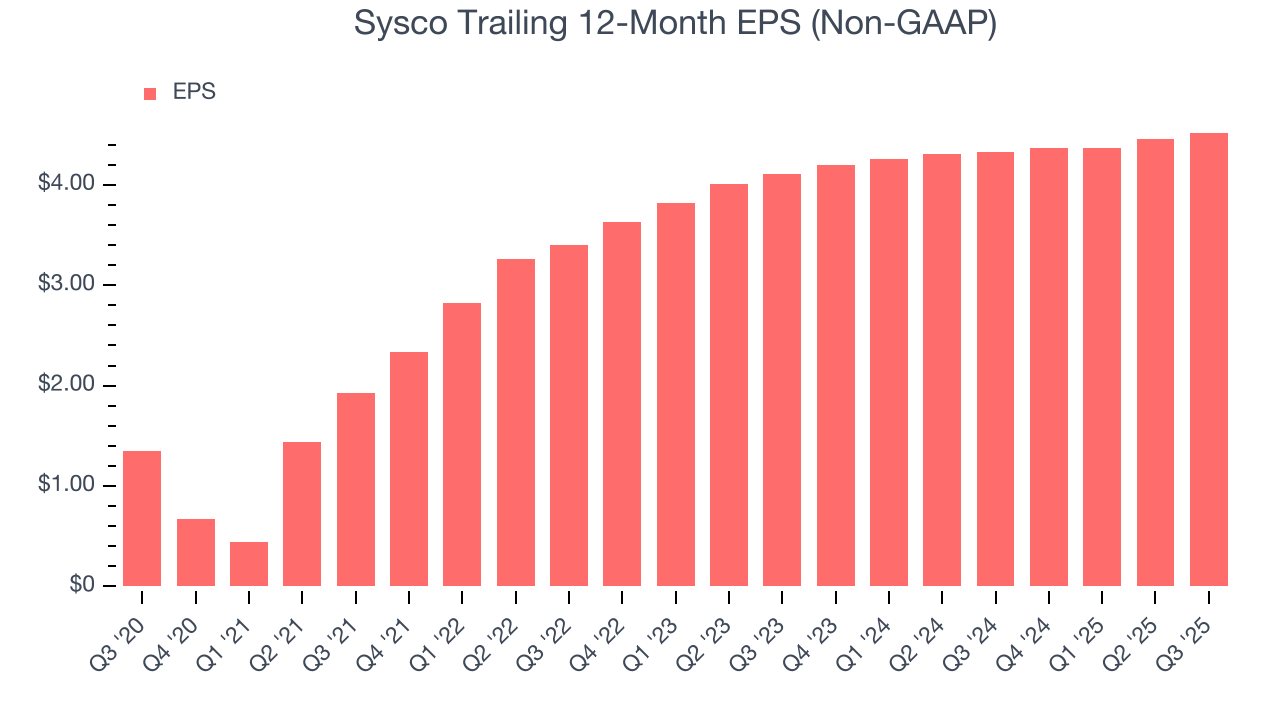
In Q3, Sysco reported adjusted EPS of $1.15, up from $1.09 in the same quarter last year. This print beat analysts’ estimates by 2.6%. Over the next 12 months, Wall Street expects Sysco’s full-year EPS of $4.52 to grow 2.7%.
8. Cash Is King
Although earnings are undoubtedly valuable for assessing company performance, we believe cash is king because you can’t use accounting profits to pay the bills.
Sysco has shown poor cash profitability over the last two years, giving the company limited opportunities to return capital to shareholders. Its free cash flow margin averaged 2.3%, lousy for a consumer discretionary business.
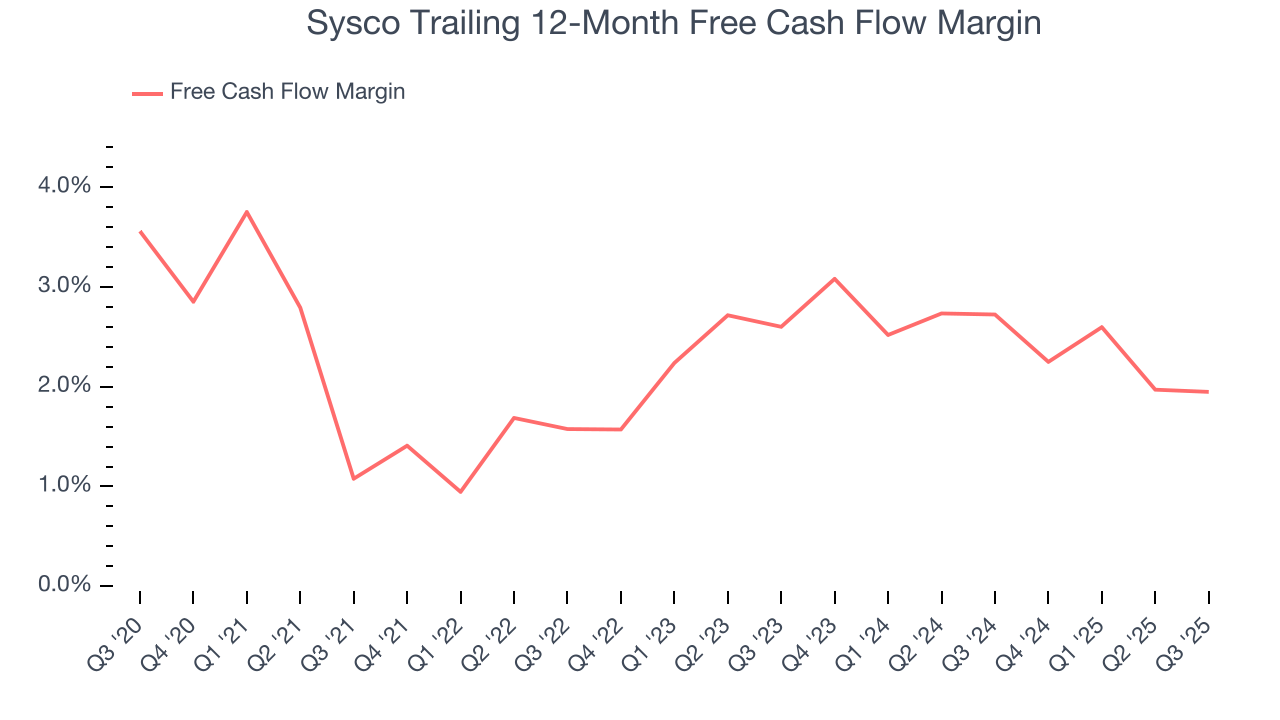
Sysco broke even from a free cash flow perspective in Q3. This cash profitability was in line with the comparable period last year but below its two-year average. In a silo, this isn’t a big deal because investment needs can be seasonal, but we’ll be watching to see if the trend extrapolates into future quarters.
Over the next year, analysts predict Sysco’s cash conversion will slightly improve. Their consensus estimates imply its free cash flow margin of 1.9% for the last 12 months will increase to 3.1%, giving it more flexibility for investments, share buybacks, and dividends.
9. Return on Invested Capital (ROIC)
EPS and free cash flow tell us whether a company was profitable while growing its revenue. But was it capital-efficient? Enter ROIC, a metric showing how much operating profit a company generates relative to the money it has raised (debt and equity).
Sysco historically did a mediocre job investing in profitable growth initiatives. Its five-year average ROIC was 18.3%, somewhat low compared to the best consumer discretionary companies that consistently pump out 25%+.
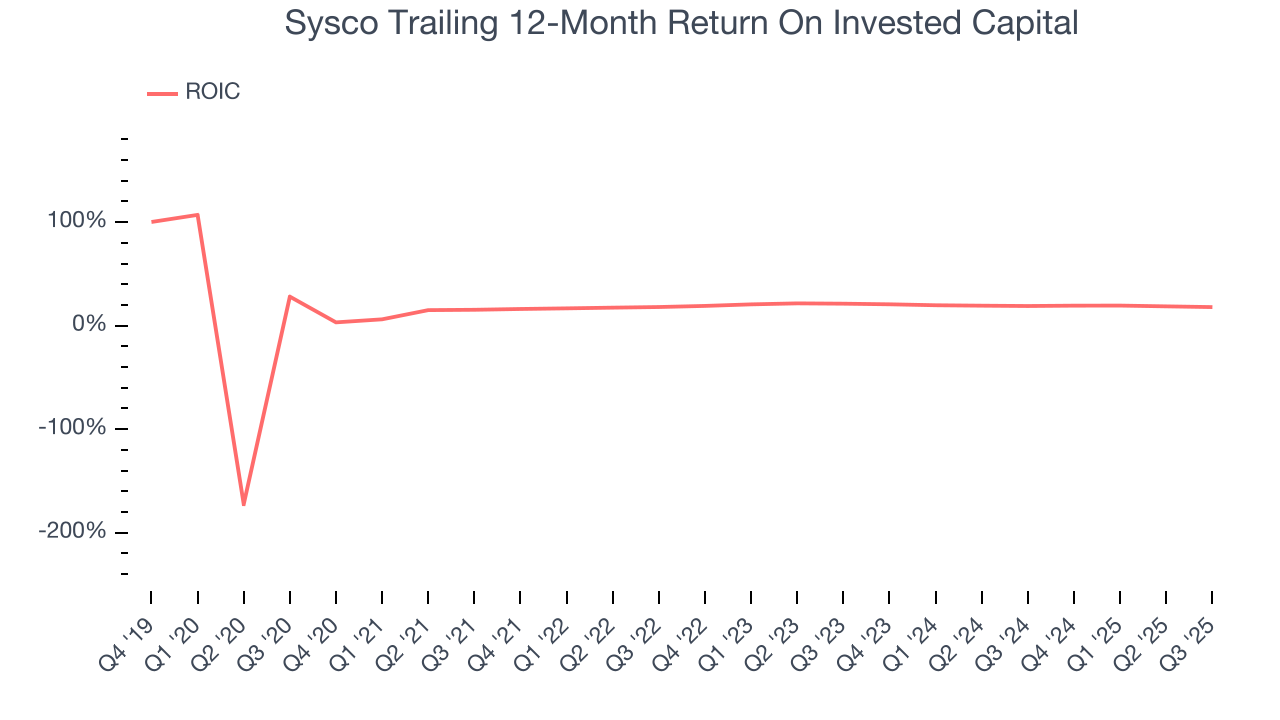
We like to invest in businesses with high returns, but the trend in a company’s ROIC is what often surprises the market and moves the stock price. Fortunately, Sysco’s ROIC averaged 1.8 percentage point increases over the last few years. This is a good sign, and we hope the company can continue improving.
10. Balance Sheet Assessment
Sysco reported $844 million of cash and $14.58 billion of debt on its balance sheet in the most recent quarter. As investors in high-quality companies, we primarily focus on two things: 1) that a company’s debt level isn’t too high and 2) that its interest payments are not excessively burdening the business.
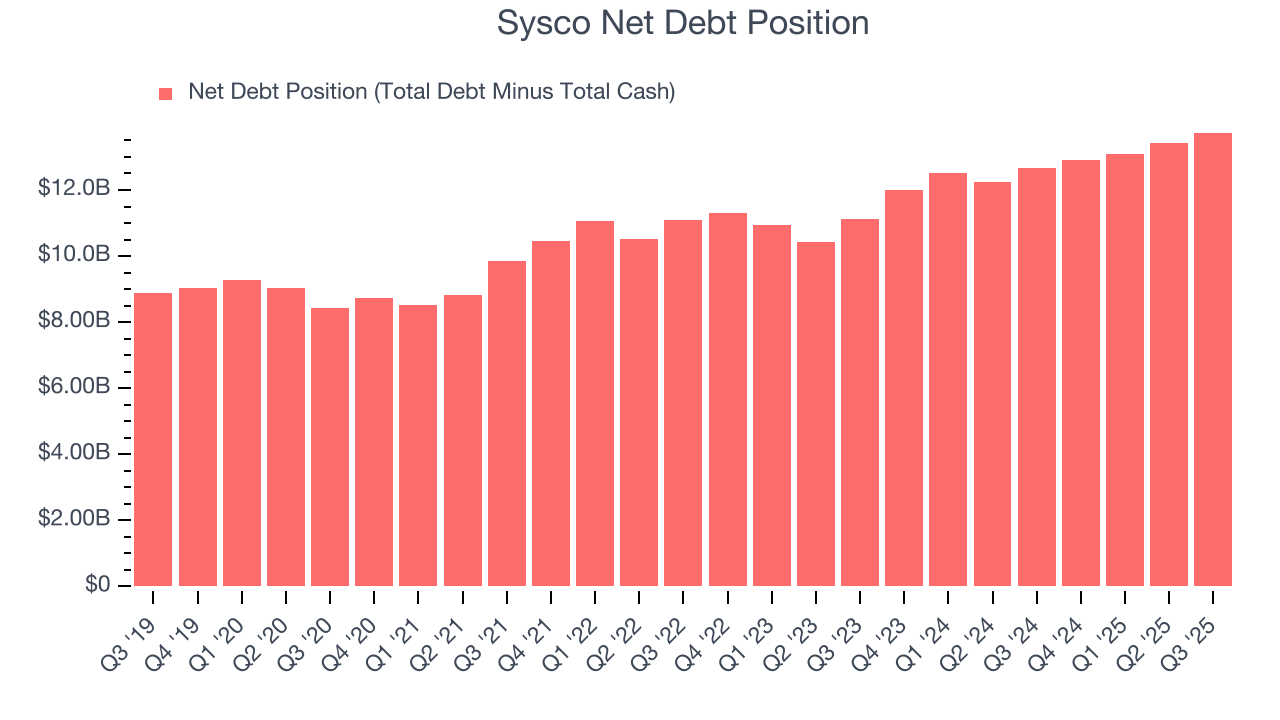
With $4.29 billion of EBITDA over the last 12 months, we view Sysco’s 3.2× net-debt-to-EBITDA ratio as safe. We also see its $303 million of annual interest expenses as appropriate. The company’s profits give it plenty of breathing room, allowing it to continue investing in growth initiatives.
11. Key Takeaways from Sysco’s Q3 Results
We struggled to find many positives in these results. Overall, this quarter could have been better. The stock traded up 2.1% to $78.70 immediately after reporting.
12. Is Now The Time To Buy Sysco?
Updated: January 16, 2026 at 11:48 PM EST
Before deciding whether to buy Sysco or pass, we urge investors to consider business quality, valuation, and the latest quarterly results.
Sysco doesn’t pass our quality test. To kick things off, its revenue growth was weak over the last five years, and analysts expect its demand to deteriorate over the next 12 months. On top of that, Sysco’s Forecasted free cash flow margin suggests the company will have more capital to invest or return to shareholders next year, and its .
Sysco’s P/E ratio based on the next 12 months is 17.1x. While this valuation is fair, the upside isn’t great compared to the potential downside. There are superior stocks to buy right now.
Wall Street analysts have a consensus one-year price target of $86.94 on the company (compared to the current share price of $78.77).