The Hanover Insurance Group (THG)
The Hanover Insurance Group doesn’t excite us. Its sales have underperformed and its low returns on capital show it has few growth opportunities.― StockStory Analyst Team
1. News


2. Summary
Why We Think The Hanover Insurance Group Will Underperform
Founded in 1852 during a time when fire insurance was crucial for protecting businesses and homes, The Hanover Insurance Group (NYSE:THG) provides property and casualty insurance products through independent agents, serving individuals, small businesses, and mid-sized companies.
- Muted 2.8% annual book value per share growth over the last five years shows its capital generation lagged behind its insurance peers
- Low return on equity reflects management’s struggle to allocate funds effectively
- On the plus side, its exciting book value per share outlook for the upcoming 12 months calls for 38.8% growth, an acceleration from its two-year trend


The Hanover Insurance Group’s quality doesn’t meet our expectations. There are more profitable opportunities elsewhere.
Why There Are Better Opportunities Than The Hanover Insurance Group


The Hanover Insurance Group is trading at $174.27 per share, or 1.5x forward P/B. This multiple is high given its weaker fundamentals.
It’s better to pay up for high-quality businesses with strong long-term earnings potential rather than to buy lower-quality companies with open questions and big downside risks.
3. The Hanover Insurance Group (THG) Research Report: Q4 CY2025 Update
Property and casualty insurer The Hanover Insurance Group (NYSE:THG) missed Wall Street’s revenue expectations in Q4 CY2025 as sales rose 3.3% year on year to $1.67 billion. Its GAAP profit of $5.47 per share was 3.6% above analysts’ consensus estimates.
The Hanover Insurance Group (THG) Q4 CY2025 Highlights:
- Net Premiums Earned: $1.56 billion vs analyst estimates of $1.58 billion (3% year-on-year growth, 1.6% miss)
- Revenue: $1.67 billion vs analyst estimates of $1.71 billion (3.3% year-on-year growth, 2.1% miss)
- Combined Ratio: 89% vs analyst estimates of 90.9% (193.3 basis point beat)
- EPS (GAAP): $5.47 vs analyst estimates of $5.28 (3.6% beat)
- Book Value per Share: $100.90 (27.5% year-on-year growth)
- Market Capitalization: $6.21 billion
Company Overview
Founded in 1852 during a time when fire insurance was crucial for protecting businesses and homes, The Hanover Insurance Group (NYSE:THG) provides property and casualty insurance products through independent agents, serving individuals, small businesses, and mid-sized companies.
The Hanover operates through three main business segments: Core Commercial, Specialty, and Personal Lines. The Core Commercial segment focuses on small and mid-sized businesses, offering coverage like commercial multiple peril, workers' compensation, and commercial automobile insurance. Small commercial typically includes businesses with annual premiums under $50,000, while middle market accounts generally range from $50,000 to $500,000.
The Specialty segment provides specialized insurance solutions through four divisions. Professional and Executive Lines offers protection for directors, officers, and professionals against liability claims. Specialty Property & Casualty includes programs for specific industry groups, industrial businesses, and excess and surplus coverage. Marine insurance protects businesses against physical losses to property like contractor's equipment and valuables. Surety coverage provides financial guarantees for construction firms and regulatory obligations.
Personal Lines, representing about 41% of Hanover's business, includes automobile insurance and homeowners coverage, with a strategic focus on "account business" – selling multiple policies to the same customer. The company maintains a strong regional presence, with significant concentration in Michigan and Massachusetts, where it underwrites approximately 7% of Michigan's total insurance market.
Hanover distributes its products primarily through a network of independent agents across the United States, maintaining 35 local offices across 23 states. The company actively markets its commercial and specialty policies in 40 states and personal lines in 20 states. This localized approach allows Hanover to respond to specific market conditions while building long-term relationships with established independent agencies.
4. Property & Casualty Insurance
Property & Casualty (P&C) insurers protect individuals and businesses against financial loss from damage to property or from legal liability. This is a cyclical industry, and the sector benefits when there is 'hard market', characterized by strong premium rate increases that outpace loss and cost inflation, resulting in robust underwriting margins. The opposite is true in a 'soft market'. Interest rates also matter, as they determine the yields earned on fixed-income portfolios. On the other hand, P&C insurers face a major secular headwind from the increasing frequency and severity of catastrophe losses due to climate change. Furthermore, the liability side of the business is pressured by 'social inflation'—the trend of rising litigation costs and larger jury awards.
The Hanover Insurance Group competes with other property and casualty insurers including The Travelers Companies (NYSE:TRV), Chubb Limited (NYSE:CB), The Hartford Financial Services Group (NYSE:HIG), and Progressive Corporation (NYSE:PGR).
5. Revenue Growth
Big picture, insurers generate revenue from three key sources. The first is the core business of underwriting policies. The second source is income from investing the “float” (premiums collected upfront not yet paid out as claims) in assets such as fixed-income assets and equities. The third is fees from various sources such as policy administration, annuities, or other value-added services. Regrettably, The Hanover Insurance Group’s revenue grew at a mediocre 6.6% compounded annual growth rate over the last five years. This was below our standard for the insurance sector and is a tough starting point for our analysis.
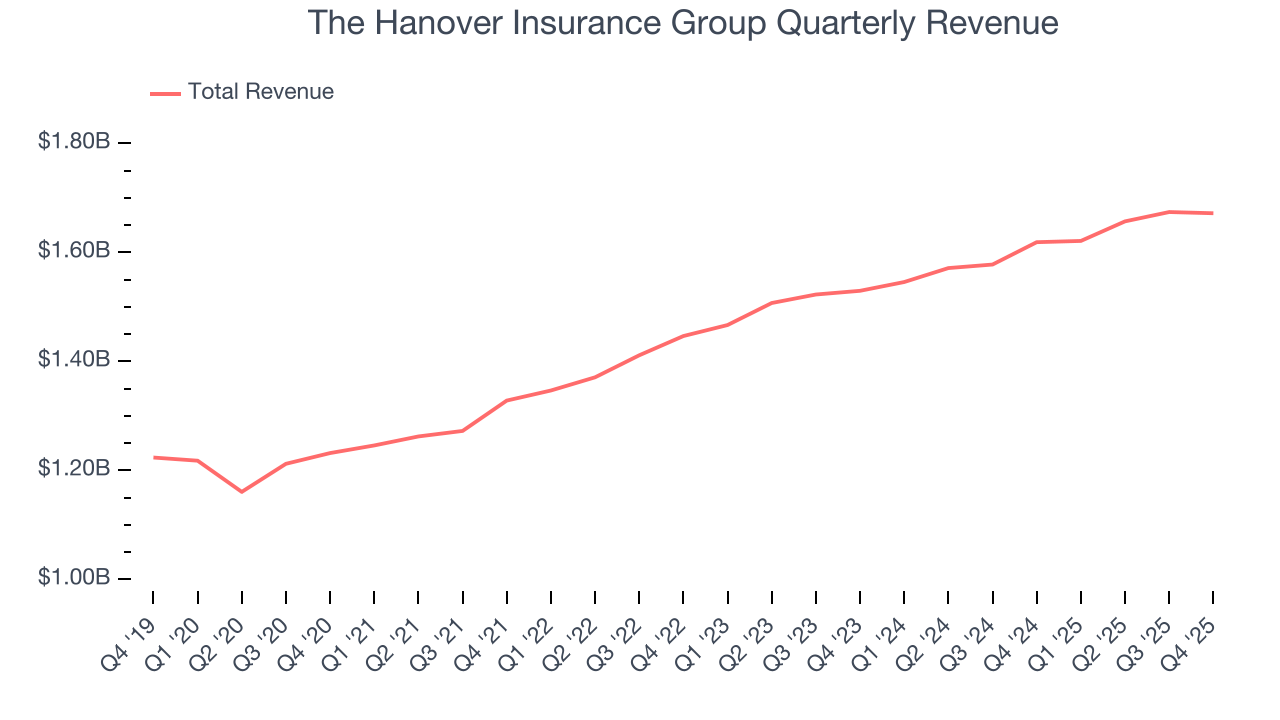
Long-term growth is the most important, but within financials, a half-decade historical view may miss recent interest rate changes and market returns. The Hanover Insurance Group’s recent performance shows its demand has slowed as its annualized revenue growth of 4.8% over the last two years was below its five-year trend. 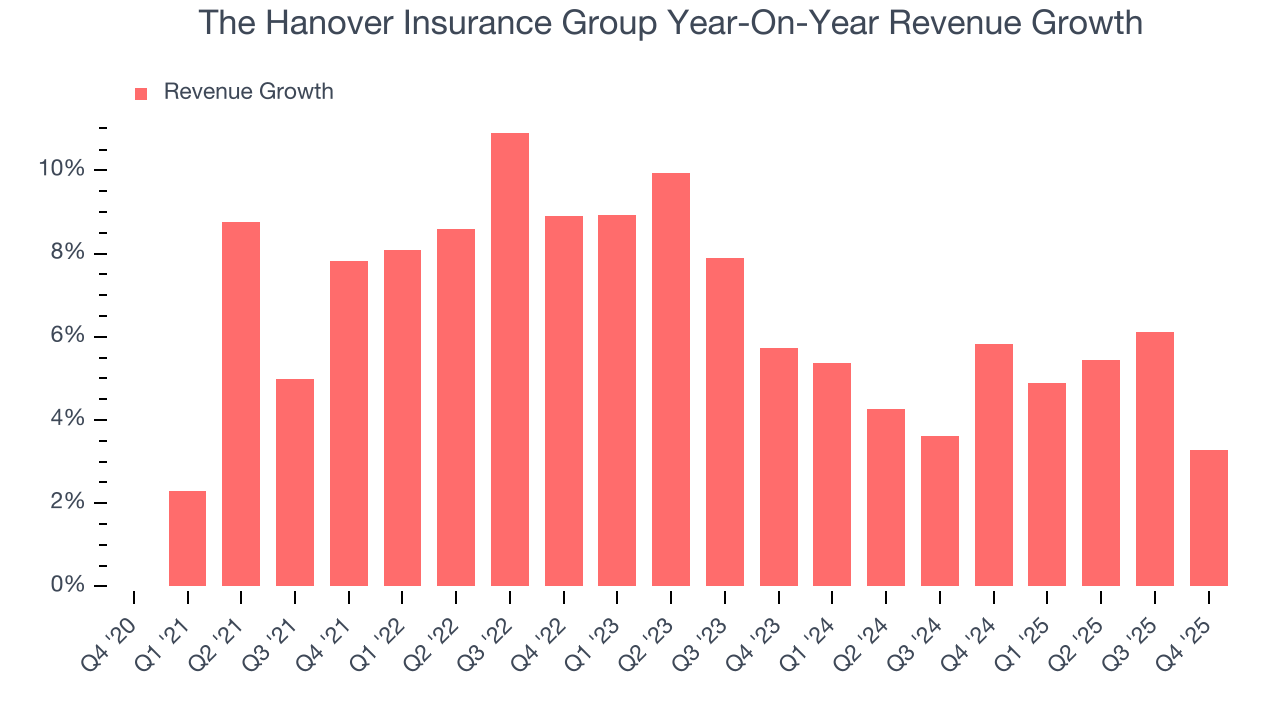 Note: Quarters not shown were determined to be outliers, impacted by outsized investment gains/losses that are not indicative of the recurring fundamentals of the business.
This quarter, The Hanover Insurance Group’s revenue grew by 3.3% year on year to $1.67 billion, falling short of Wall Street’s estimates.
Net premiums earned made up 93.6% of the company’s total revenue during the last five years, meaning The Hanover Insurance Group lives and dies by its underwriting activities because non-insurance operations barely move the needle.
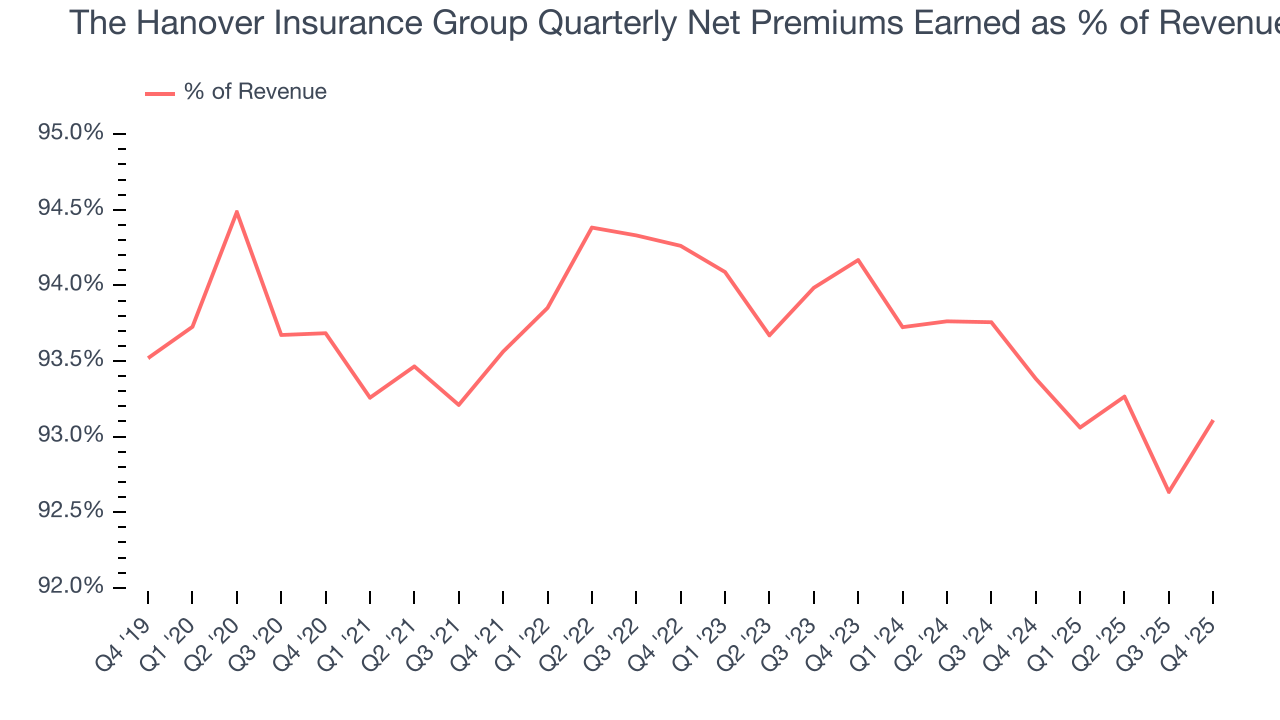
Markets consistently prioritize net premiums earned growth over investment and fee income, recognizing its superior quality as a core indicator of the company’s underwriting success and market penetration.
6. Net Premiums Earned
When insurers sell policies, they protect themselves from extremely large losses or an outsized accumulation of losses with reinsurance (insurance for insurance companies). Net premiums earned are therefore gross premiums less what’s ceded to reinsurers as a risk mitigation and transfer strategy.
The Hanover Insurance Group’s net premiums earned has grown at a 6.4% annualized rate over the last five years, slightly worse than the broader insurance industry and in line with its total revenue.
When analyzing The Hanover Insurance Group’s net premiums earned over the last two years, we can see that growth decelerated to 4.3% annually. This performance was similar to its total revenue.
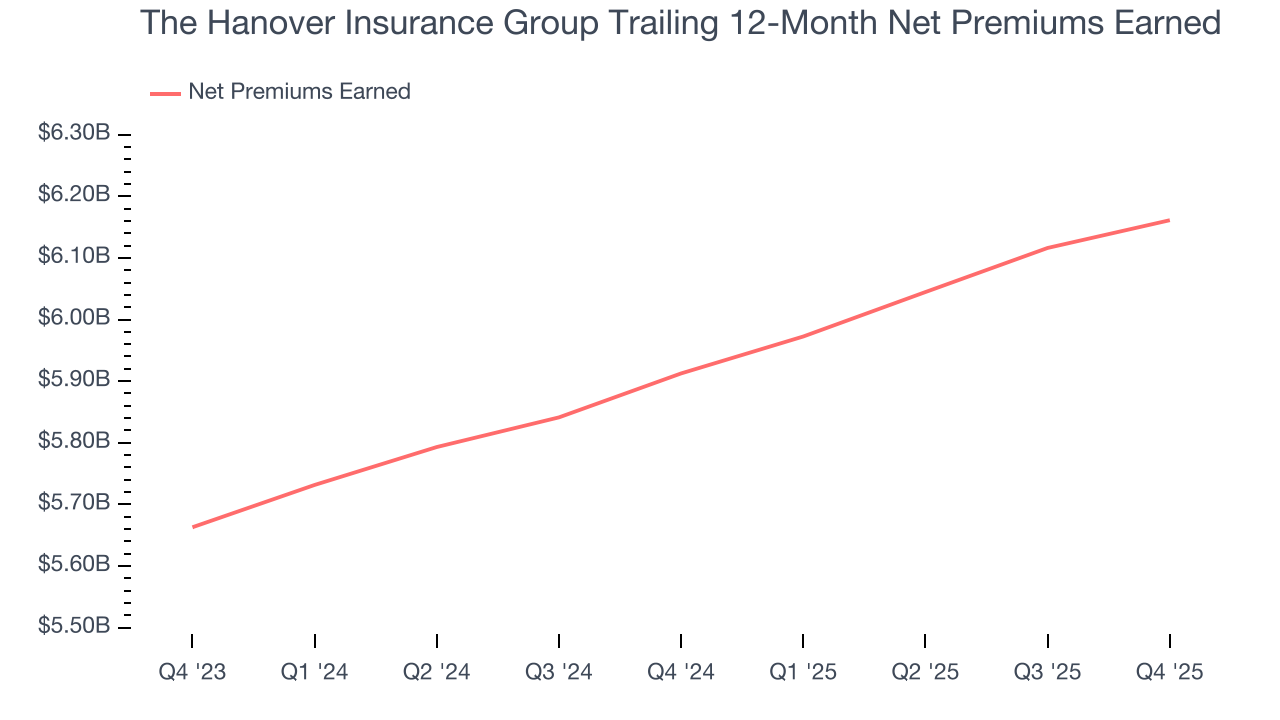
In Q4, The Hanover Insurance Group produced $1.56 billion of net premiums earned, up 3% year on year. But this wasn’t enough juice to meet Wall Street Consensus estimates.
7. Combined Ratio
Revenue growth is one major determinant of business quality, and the efficiency of operations is another. For insurance companies, we look at the combined ratio rather than the operating expenses and margins that define sectors such as consumer, tech, and industrials.
Combined ratio sums operating costs (salaries, commissions, overhead) with what is paid out in claims (losses) and divides this by net premiums earned. Combined ratios under 100% means profits while ones over 100% mean losses on its core operations of selling insurance policies.
Given the calculation, a lower expense ratio is better. Over the last five years, The Hanover Insurance Group’s combined ratio has swelled by 2.7 percentage points, going from 97.1% to 91.7%. It has also improved by 11.9 percentage points on a two-year basis, showing its expenses have consistently grown at a slower rate than revenue. This typically signals prudent management.
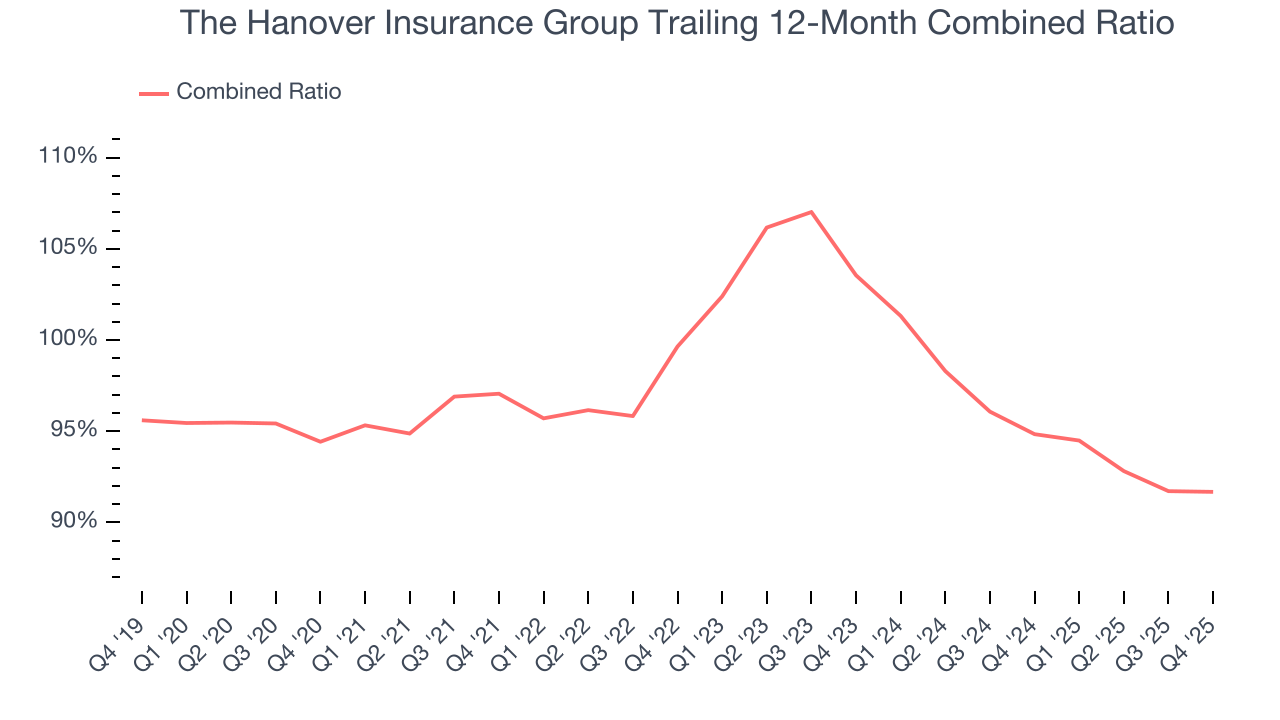
The Hanover Insurance Group’s combined ratio came in at 89% this quarter, beating analysts’ expectations by 193.3 basis points (100 basis points = 1 percentage point). This result was in line with the same quarter last year.
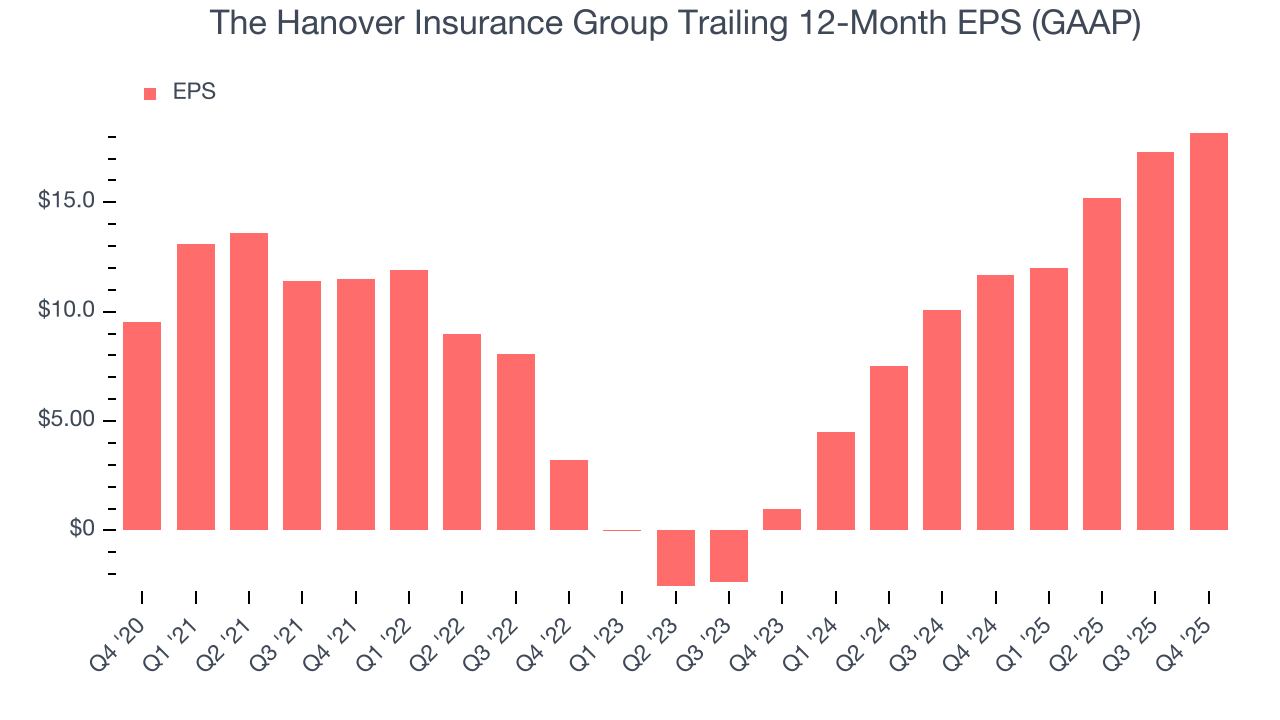
8. Earnings Per Share
We track the long-term change in earnings per share (EPS) for the same reason as long-term revenue growth. Compared to revenue, however, EPS highlights whether a company’s growth is profitable.
The Hanover Insurance Group’s EPS grew at a solid 13.8% compounded annual growth rate over the last five years, higher than its 6.6% annualized revenue growth. However, this alone doesn’t tell us much about its business quality because its combined ratio didn’t improve.
We can take a deeper look into The Hanover Insurance Group’s earnings to better understand the drivers of its performance. As we mentioned earlier, The Hanover Insurance Group’s combined ratio was flat this quarter but improved by 2.7 percentage points over the last five years. On top of that, its share count shrank by 2.2%. These are positive signs for shareholders because improving profitability and share buybacks turbocharge EPS growth relative to revenue growth. 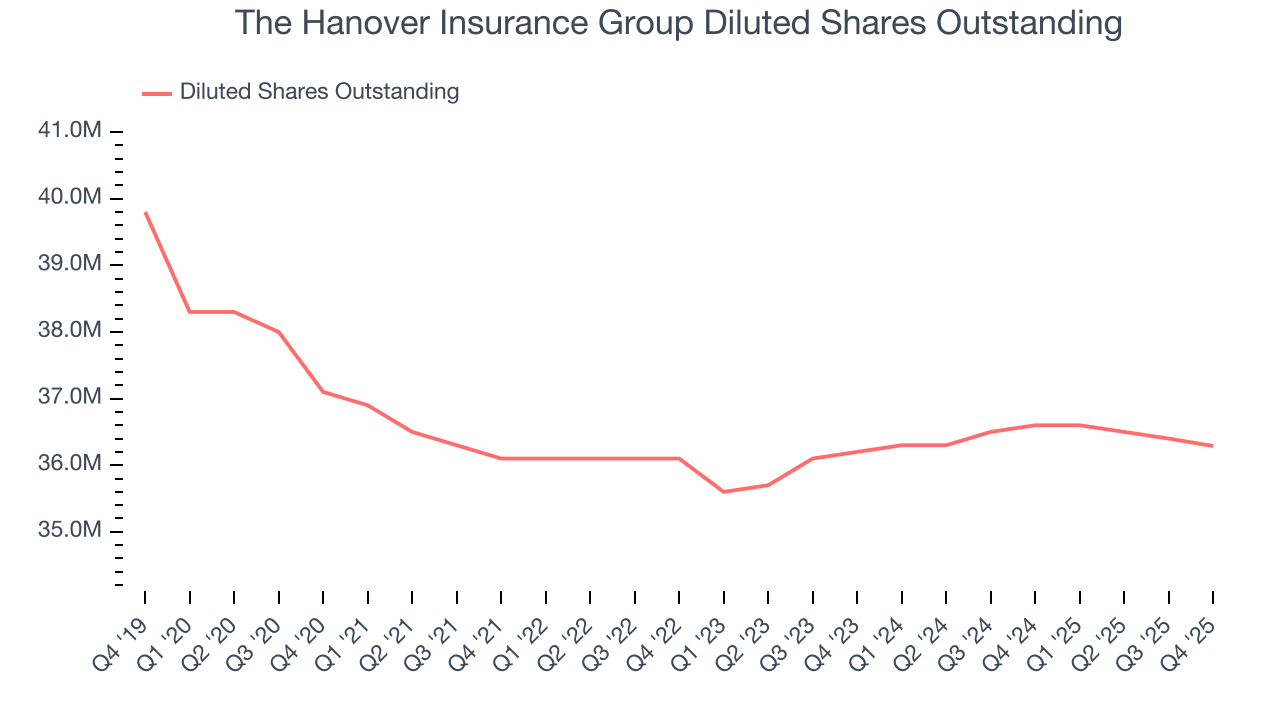
Like with revenue, we analyze EPS over a more recent period because it can provide insight into an emerging theme or development for the business.
For The Hanover Insurance Group, its two-year annual EPS growth of 334% was higher than its five-year trend. We love it when earnings growth accelerates, especially when it accelerates off an already high base.
In Q4, The Hanover Insurance Group reported EPS of $5.47, up from $4.59 in the same quarter last year. This print beat analysts’ estimates by 3.6%. Over the next 12 months, Wall Street expects The Hanover Insurance Group’s full-year EPS of $18.19 to shrink by 7.9%.
9. Book Value Per Share (BVPS)
Insurers are balance sheet businesses, collecting premiums upfront and paying out claims over time. Premiums collected but not yet paid out, often referred to as the float, are invested and create an asset base supported by a liability structure. Book value per share (BVPS) captures this dynamic by measuring these assets (investment portfolio, cash, reinsurance recoverables) less liabilities (claim reserves, debt, future policy benefits). BVPS is essentially the residual value for shareholders.
We therefore consider BVPS very important to track for insurers and a metric that sheds light on business quality. While other (and more commonly known) per-share metrics like EPS can sometimes be lumpy due to reserve releases or one-time items and can be managed or skewed while still following accounting rules, BVPS reflects long-term capital growth and is harder to manipulate.
The Hanover Insurance Group’s BVPS grew at a sluggish 2.8% annual clip over the last five years. However, BVPS growth has accelerated recently, growing by 21% annually over the last two years from $68.87 to $100.90 per share.
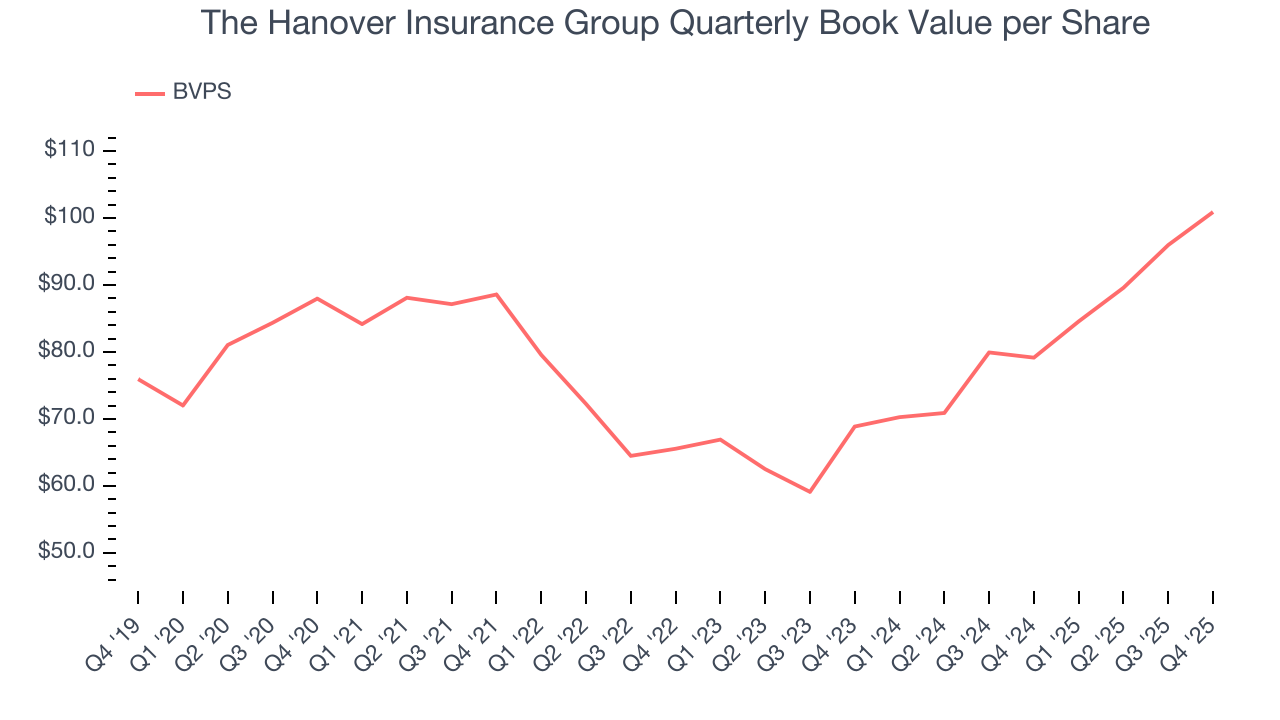
Over the next 12 months, Consensus estimates call for The Hanover Insurance Group’s BVPS to grow by 37.1%, elite growth rate.
10. Balance Sheet Assessment
The debt-to-equity ratio is a widely used measure to assess a company's balance sheet health. A higher ratio means that a business aggressively financed its growth with debt. This can result in higher earnings (if the borrowed funds are invested profitably) but also increases risk.
If debt levels are too high, there could be difficulties in meeting obligations, especially during economic downturns or periods of rising interest rates if the debt has variable-rate payments.
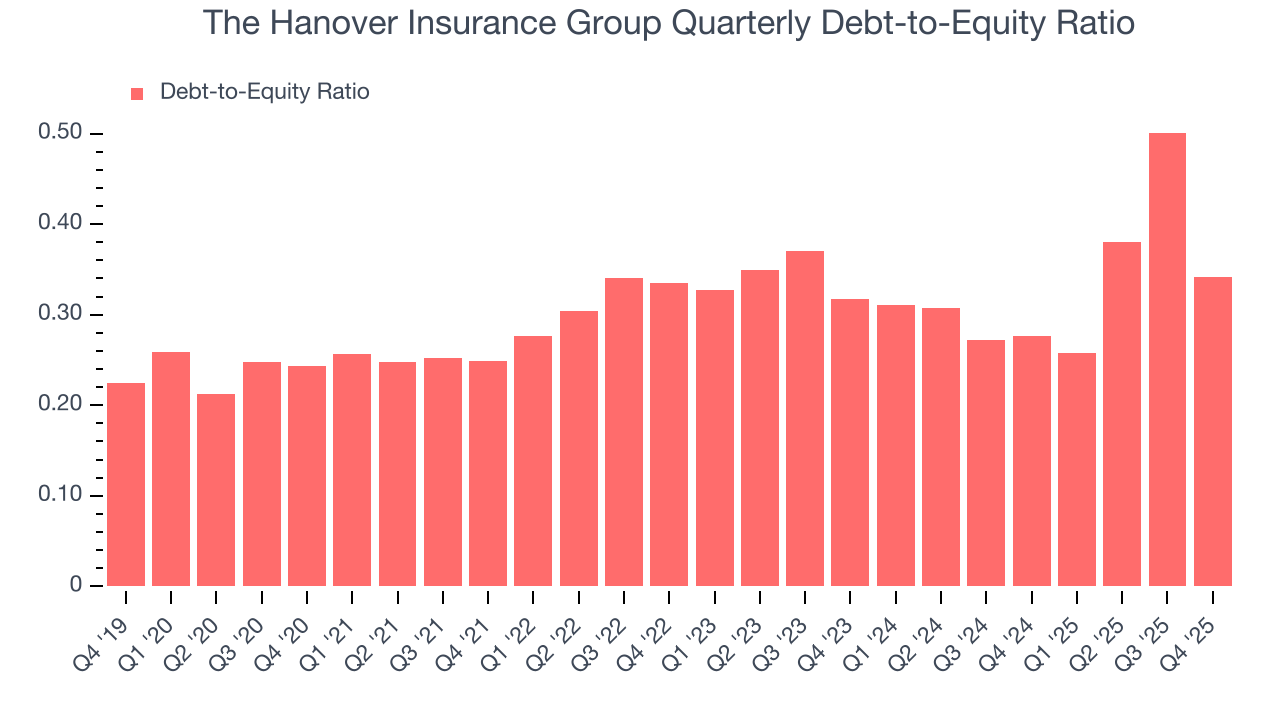
The Hanover Insurance Group currently has $1.22 billion of debt and $3.57 billion of shareholder's equity on its balance sheet, and over the past four quarters, has averaged a debt-to-equity ratio of 0.4×. We think this is safe and raises no red flags. In general, we’re comfortable with any ratio below 1.0× for an insurance business. Anything below 0.5× is a bonus.
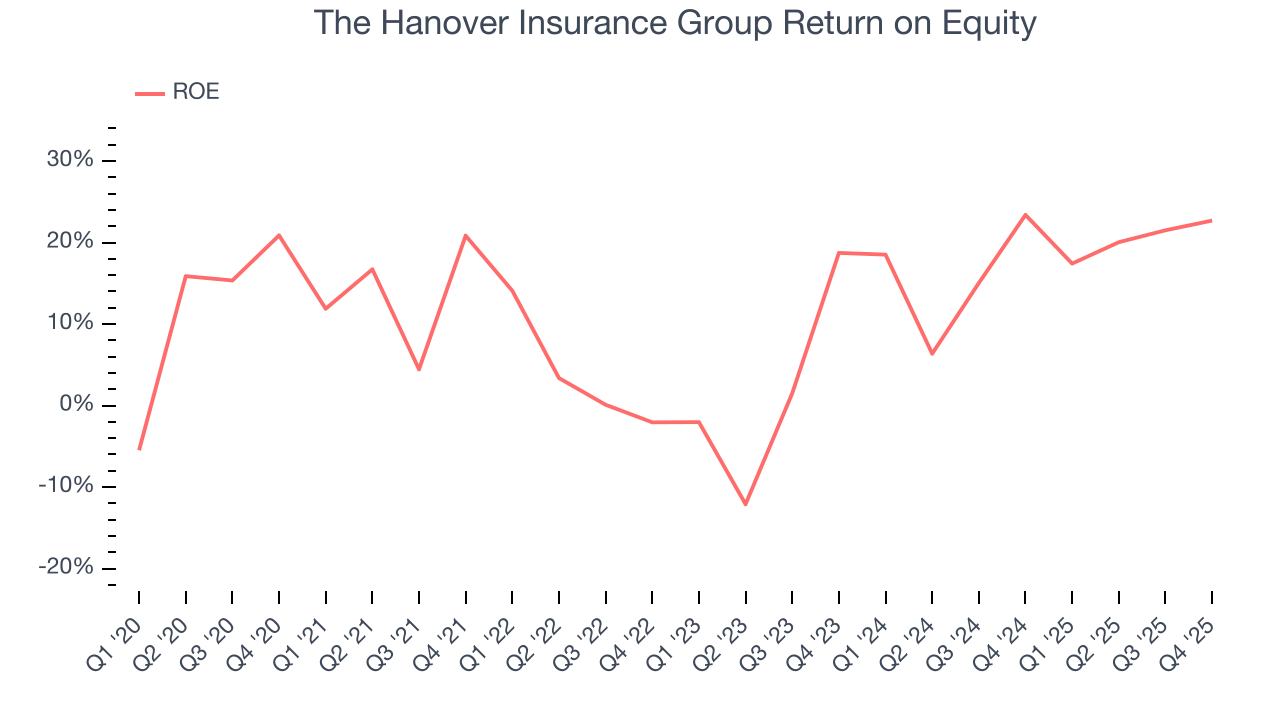
11. Return on Equity
Return on equity, or ROE, represents the ultimate measure of an insurer's effectiveness, quantifying how well it transforms shareholder investments into profits. Over the long term, insurance companies with robust ROE metrics typically deliver superior shareholder returns through a balanced approach to capital management.
Over the last five years, The Hanover Insurance Group has averaged an ROE of 11%, uninspiring for a company operating in a sector where the average shakes out around 12.5%.
12. Key Takeaways from The Hanover Insurance Group’s Q4 Results
We struggled to find many positives in these results. Its net premiums earned missed and its revenue fell short of Wall Street’s estimates. Overall, this quarter could have been better. The stock traded up 2.2% to $178.00 immediately following the results.
13. Is Now The Time To Buy The Hanover Insurance Group?
Updated: March 14, 2026 at 12:34 AM EDT
We think that the latest earnings result is only one piece of the bigger puzzle. If you’re deciding whether to own The Hanover Insurance Group, you should also grasp the company’s longer-term business quality and valuation.
The Hanover Insurance Group’s business quality ultimately falls short of our standards. To kick things off, its revenue growth was mediocre over the last five years, and analysts expect its demand to deteriorate over the next 12 months. While its estimated BVPS growth for the next 12 months is great, the downside is its projected EPS for the next year is lacking. On top of that, its BVPS growth was weak over the last five years.
The Hanover Insurance Group’s P/B ratio based on the next 12 months is 1.5x. Beauty is in the eye of the beholder, but we don’t really see a big opportunity at the moment. We're pretty confident there are superior stocks to buy right now.
Wall Street analysts have a consensus one-year price target of $199.75 on the company (compared to the current share price of $173.75).