
Thermon (THR)
Thermon is intriguing. Its rare ability to win market share while pumping out profits is a feature its competitors envy.― StockStory Analyst Team
1. News


2. Summary
Why Thermon Is Interesting
Creating the first packaged tracing systems, Thermon (NYSE:THR) is a leading provider of engineered industrial process heating solutions for process industries.
- Incremental sales significantly boosted profitability as its annual earnings per share growth of 46.1% over the last five years outstripped its revenue performance
- Offerings are mission-critical for businesses and result in a stellar gross margin of 43.2%
- One pitfall is its demand will likely be soft over the next 12 months as Wall Street’s estimates imply tepid growth of 4.6%


Thermon shows some promise. If you’ve been itching to buy the stock, the price looks fair.
Why Is Now The Time To Buy Thermon?


Thermon’s stock price of $48.52 implies a valuation ratio of 21.9x forward P/E. Compared to companies in the industrials space, we think this multiple is warranted for the revenue growth you get.
Now could be a good time to invest if you believe in the story.
3. Thermon (THR) Research Report: Q4 CY2025 Update
Industrial process heating solutions provider Thermon (NYSE:THR) reported Q4 CY2025 results beating Wall Street’s revenue expectations, with sales up 9.6% year on year to $147.3 million. The company’s full-year revenue guidance of $521 million at the midpoint came in 0.8% above analysts’ estimates. Its non-GAAP profit of $0.66 per share was 13.4% above analysts’ consensus estimates.
Thermon (THR) Q4 CY2025 Highlights:
- Revenue: $147.3 million vs analyst estimates of $138.3 million (9.6% year-on-year growth, 6.5% beat)
- Adjusted EPS: $0.66 vs analyst estimates of $0.58 (13.4% beat)
- Adjusted EBITDA: $35.6 million vs analyst estimates of $32.07 million (24.2% margin, 11% beat)
- The company slightly lifted its revenue guidance for the full year to $521 million at the midpoint from $516.5 million
- Management raised its full-year Adjusted EPS guidance to $2.12 at the midpoint, a 2.2% increase
- EBITDA guidance for the full year is $117 million at the midpoint, above analyst estimates of $115.7 million
- Operating Margin: 18.1%, in line with the same quarter last year
- Free Cash Flow Margin: 8.9%, up from 6.3% in the same quarter last year
- Market Capitalization: $1.52 billion
Company Overview
Creating the first packaged tracing systems, Thermon (NYSE:THR) is a leading provider of engineered industrial process heating solutions for process industries.
Thermon is involved in the industrial heating sector and offers products, services, and software required to deliver solutions for some of the world's largest and most complex projects. Specifically, its product portfolio includes heating units, electrode and gas-fired boilers, heating cables, industrial heating blankets, temporary power solutions, and tubing bundles. In addition to hardware, the company provides engineering, installation, and maintenance services, as well as software for wireless and network control systems.
The company operates across the United States, Canada, Latin America, Europe, the Middle East, Africa, and Asia while maintaining multiple manufacturing facilities on two continents and a network of sales and service professionals in more than 30 countries. Its main manufacturing operations are concentrated in North America, with its main heat tracing products manufactured in San Marcos, Texas.
Thermon serves a wide range of industries, with a particular focus on energy, chemical processing, and power generation sectors. The company's customer base includes many of the largest multinational oil, gas, chemical processing, power, and engineering, procurement, and construction (EPC) companies in the world. Notably, Thermon reports that no single customer represented more than 10% of total revenue in fiscal years 2024, 2023, or 2022.
4. Electrical Systems
Like many equipment and component manufacturers, electrical systems companies are buoyed by secular trends such as connectivity and industrial automation. More specific pockets of strong demand include Internet of Things (IoT) connectivity and the 5G telecom upgrade cycle, which can benefit companies whose cables and conduits fit those needs. But like the broader industrials sector, these companies are also at the whim of economic cycles. Interest rates, for example, can greatly impact projects that drive demand for these products.
Competitors of Thermon include nVent Electric (NYSE:NVT), Pentair (NYSE:PNR), and private company Chromalox.
5. Revenue Growth
Examining a company’s long-term performance can provide clues about its quality. Even a bad business can shine for one or two quarters, but a top-tier one grows for years. Luckily, Thermon’s sales grew at an excellent 12.4% compounded annual growth rate over the last five years. Its growth beat the average industrials company and shows its offerings resonate with customers.
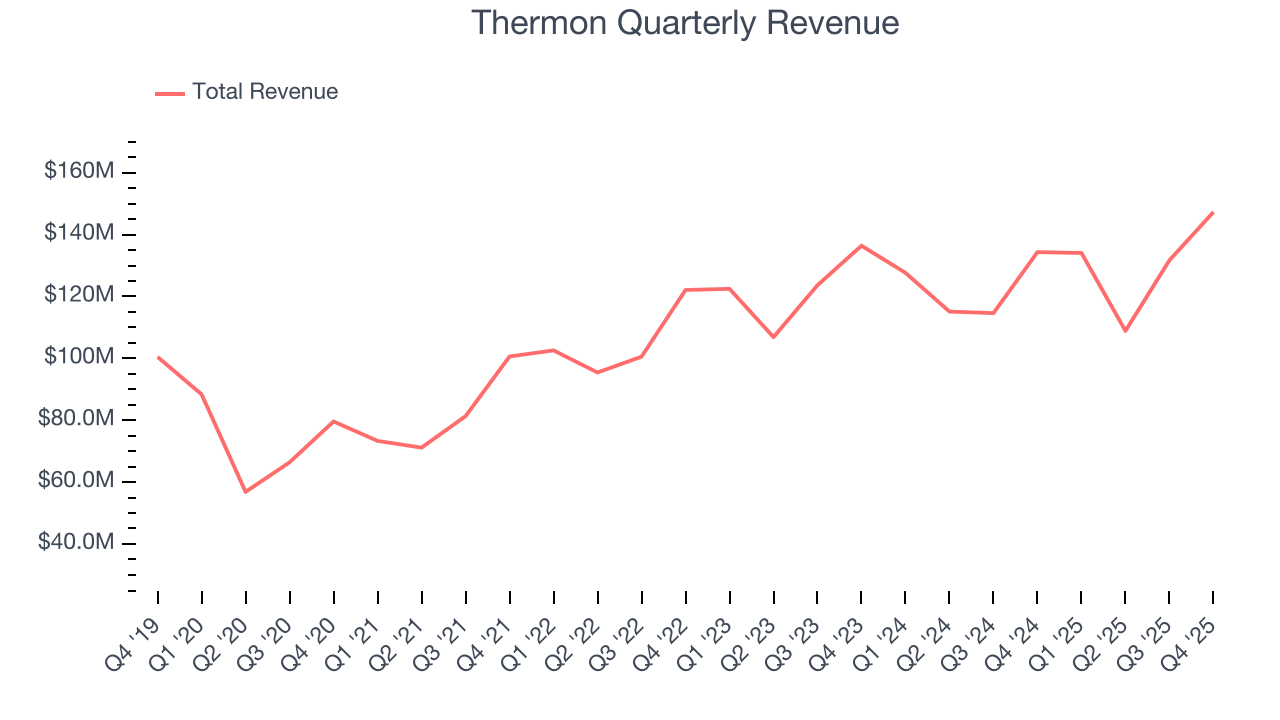
We at StockStory place the most emphasis on long-term growth, but within industrials, a half-decade historical view may miss cycles, industry trends, or a company capitalizing on catalysts such as a new contract win or a successful product line. Thermon’s recent performance shows its demand has slowed significantly as its annualized revenue growth of 3.3% over the last two years was well below its five-year trend. 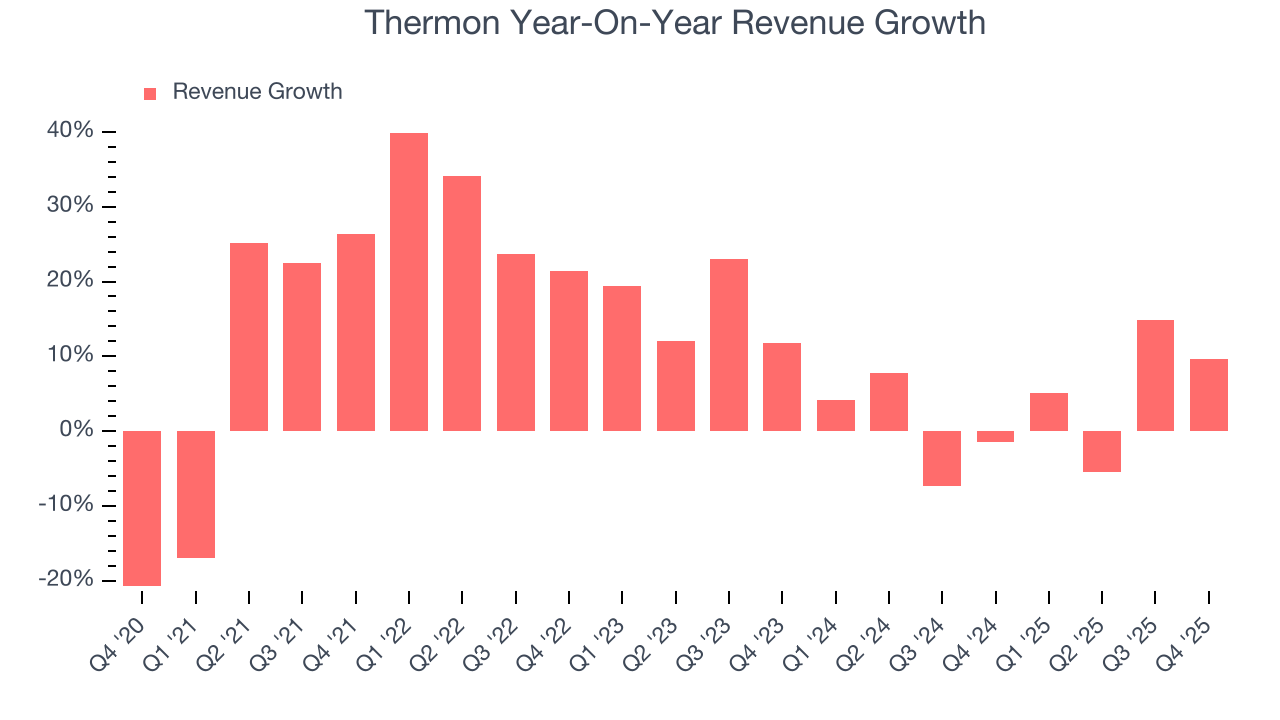
This quarter, Thermon reported year-on-year revenue growth of 9.6%, and its $147.3 million of revenue exceeded Wall Street’s estimates by 6.5%.
Looking ahead, sell-side analysts expect revenue to grow 3.5% over the next 12 months, similar to its two-year rate. This projection is underwhelming and implies its newer products and services will not lead to better top-line performance yet.
6. Gross Margin & Pricing Power
Cost of sales for an industrials business is usually comprised of the direct labor, raw materials, and supplies needed to offer a product or service. These costs can be impacted by inflation and supply chain dynamics.
Thermon has best-in-class unit economics for an industrials company, enabling it to invest in areas such as research and development. Its margin also signals it sells differentiated products, not commodities. As you can see below, it averaged an elite 43.2% gross margin over the last five years. Said differently, roughly $43.22 was left to spend on selling, marketing, R&D, and general administrative overhead for every $100 in revenue. 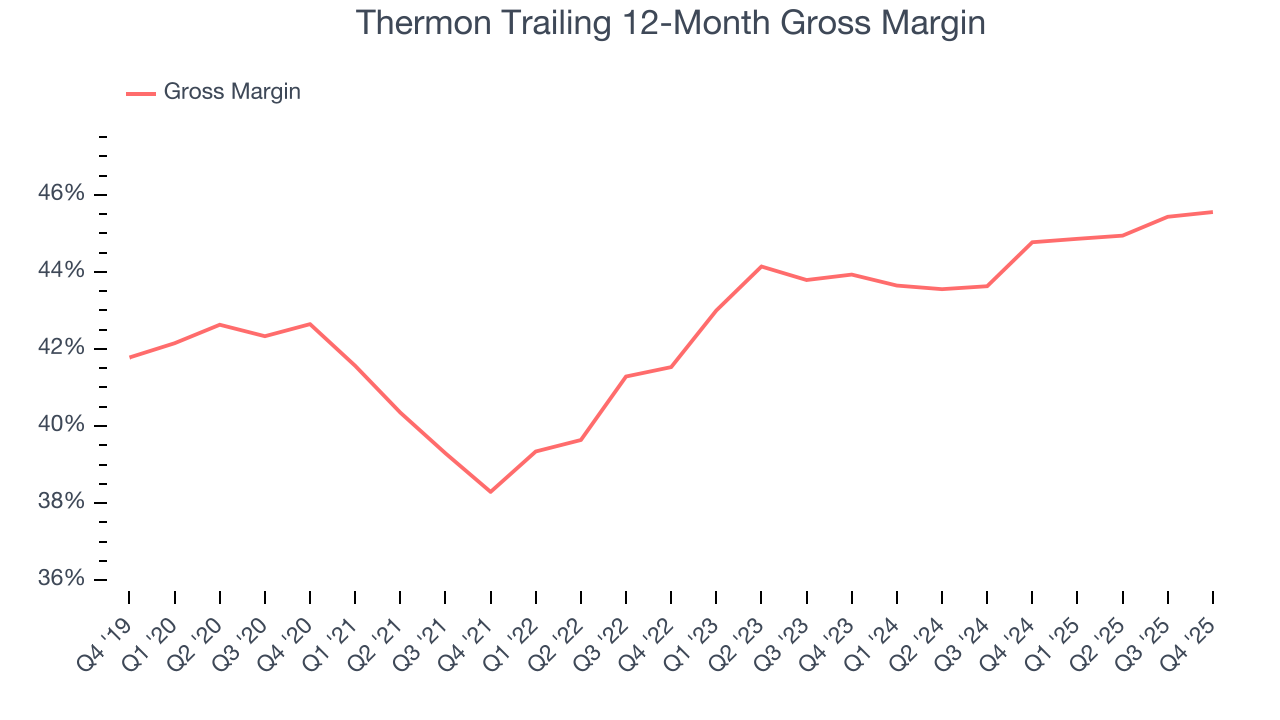
Thermon produced a 46.6% gross profit margin in Q4, in line with the same quarter last year. Zooming out, the company’s full-year margin has remained steady over the past 12 months, suggesting its input costs (such as raw materials and manufacturing expenses) have been stable and it isn’t under pressure to lower prices.
7. Operating Margin
Thermon has been an efficient company over the last five years. It was one of the more profitable businesses in the industrials sector, boasting an average operating margin of 14.6%. This result isn’t surprising as its high gross margin gives it a favorable starting point.
Looking at the trend in its profitability, Thermon’s operating margin rose by 8.8 percentage points over the last five years, as its sales growth gave it immense operating leverage.
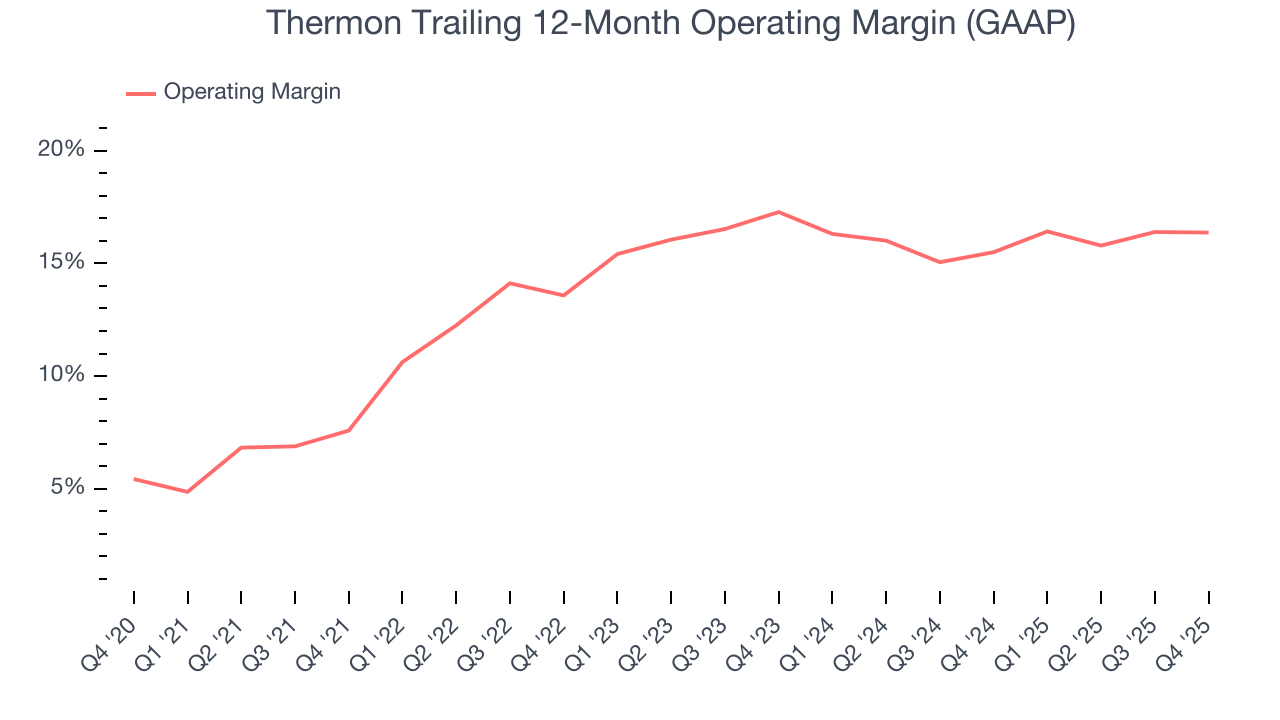
This quarter, Thermon generated an operating margin profit margin of 18.1%, in line with the same quarter last year. This indicates the company’s cost structure has recently been stable.
8. Earnings Per Share
We track the long-term change in earnings per share (EPS) for the same reason as long-term revenue growth. Compared to revenue, however, EPS highlights whether a company’s growth is profitable.
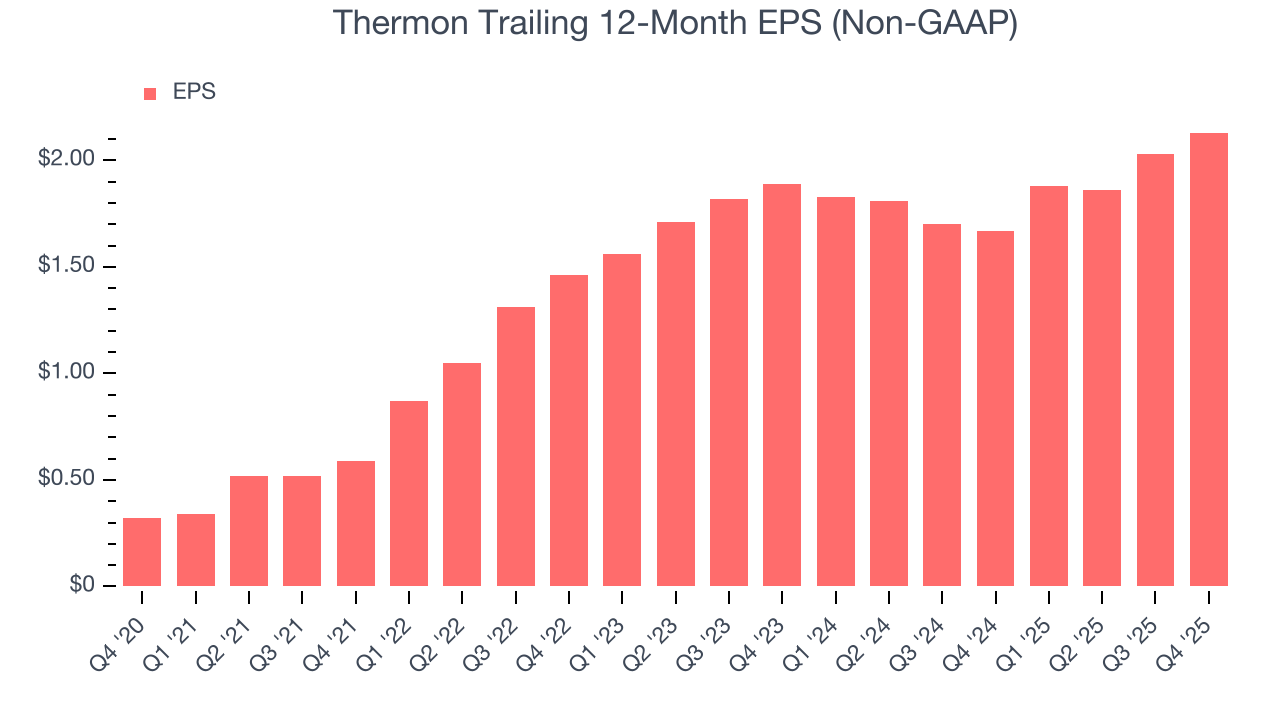
Thermon’s EPS grew at an astounding 46.1% compounded annual growth rate over the last five years, higher than its 12.4% annualized revenue growth. This tells us the company became more profitable on a per-share basis as it expanded.
We can take a deeper look into Thermon’s earnings quality to better understand the drivers of its performance. As we mentioned earlier, Thermon’s operating margin was flat this quarter but expanded by 8.8 percentage points over the last five years. This was the most relevant factor (aside from the revenue impact) behind its higher earnings; interest expenses and taxes can also affect EPS but don’t tell us as much about a company’s fundamentals.
Like with revenue, we analyze EPS over a shorter period to see if we are missing a change in the business.
For Thermon, its two-year annual EPS growth of 6.2% was lower than its five-year trend. We hope its growth can accelerate in the future.
In Q4, Thermon reported adjusted EPS of $0.66, up from $0.56 in the same quarter last year. This print easily cleared analysts’ estimates, and shareholders should be content with the results. Over the next 12 months, Wall Street expects Thermon’s full-year EPS of $2.13 to stay about the same.
9. Cash Is King
Free cash flow isn't a prominently featured metric in company financials and earnings releases, but we think it's telling because it accounts for all operating and capital expenses, making it tough to manipulate. Cash is king.
Thermon has shown robust cash profitability, enabling it to comfortably ride out cyclical downturns while investing in plenty of new offerings and returning capital to investors. The company’s free cash flow margin averaged 9.6% over the last five years, quite impressive for an industrials business.
Taking a step back, we can see that Thermon’s margin expanded by 3.7 percentage points during that time. This is encouraging because it gives the company more optionality.
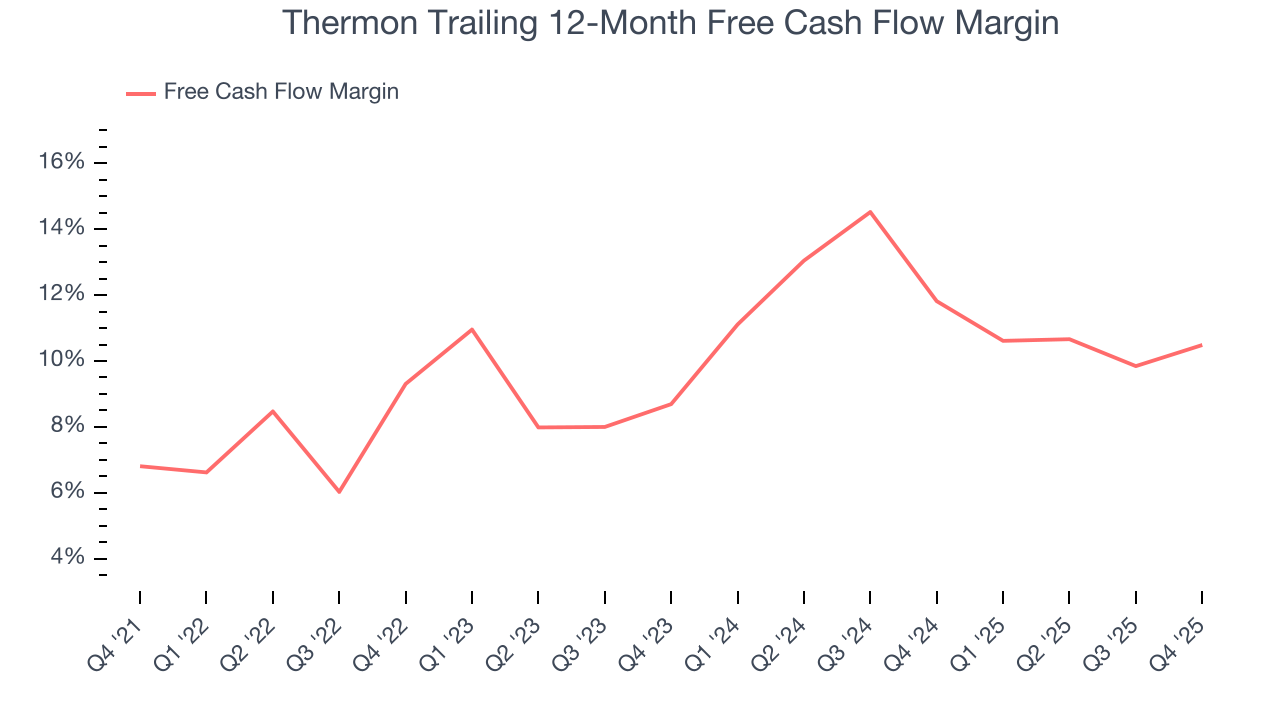
Thermon’s free cash flow clocked in at $13.06 million in Q4, equivalent to a 8.9% margin. This result was good as its margin was 2.6 percentage points higher than in the same quarter last year, building on its favorable historical trend.
10. Return on Invested Capital (ROIC)
EPS and free cash flow tell us whether a company was profitable while growing its revenue. But was it capital-efficient? A company’s ROIC explains this by showing how much operating profit it makes compared to the money it has raised (debt and equity).
Thermon historically did a mediocre job investing in profitable growth initiatives. Its five-year average ROIC was 9.3%, somewhat low compared to the best industrials companies that consistently pump out 20%+.
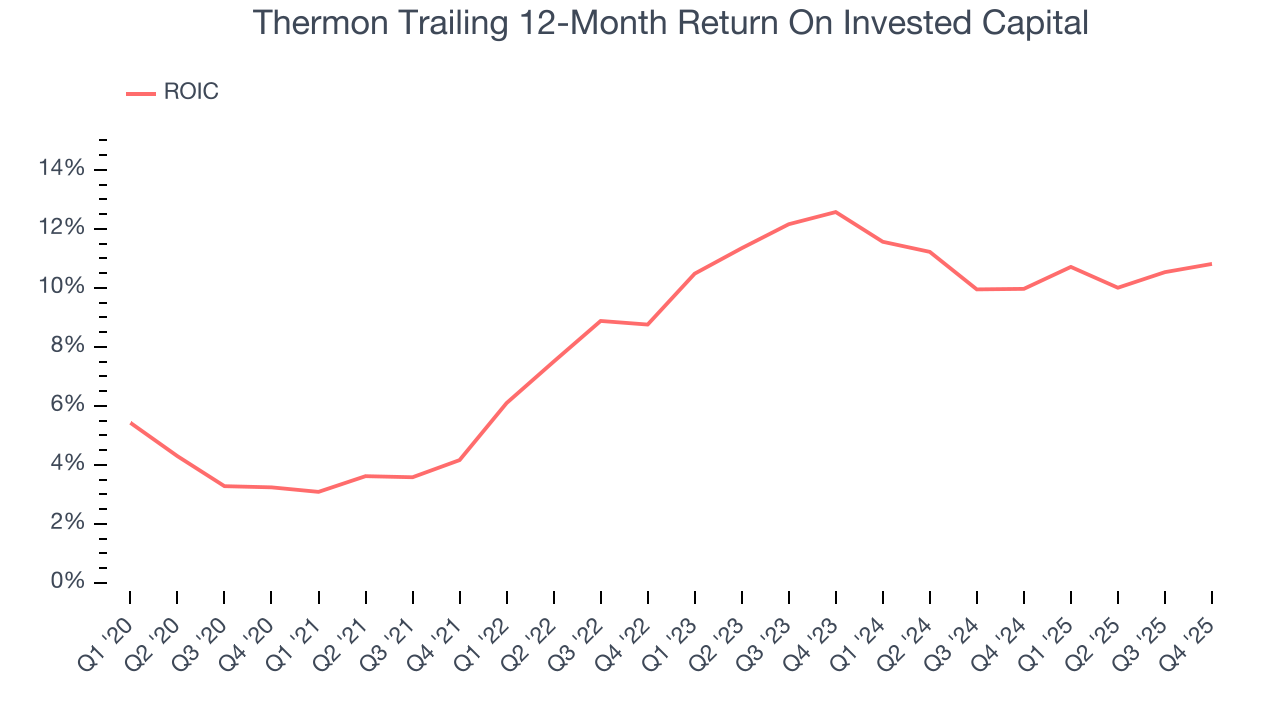
We like to invest in businesses with high returns, but the trend in a company’s ROIC is what often surprises the market and moves the stock price. Fortunately, Thermon’s ROIC averaged 3.9 percentage point increases each year over the last few years. This is a good sign, and if its returns keep rising, there’s a chance it could evolve into an investable business.
11. Balance Sheet Assessment
Thermon reported $46.86 million of cash and $140.5 million of debt on its balance sheet in the most recent quarter. As investors in high-quality companies, we primarily focus on two things: 1) that a company’s debt level isn’t too high and 2) that its interest payments are not excessively burdening the business.
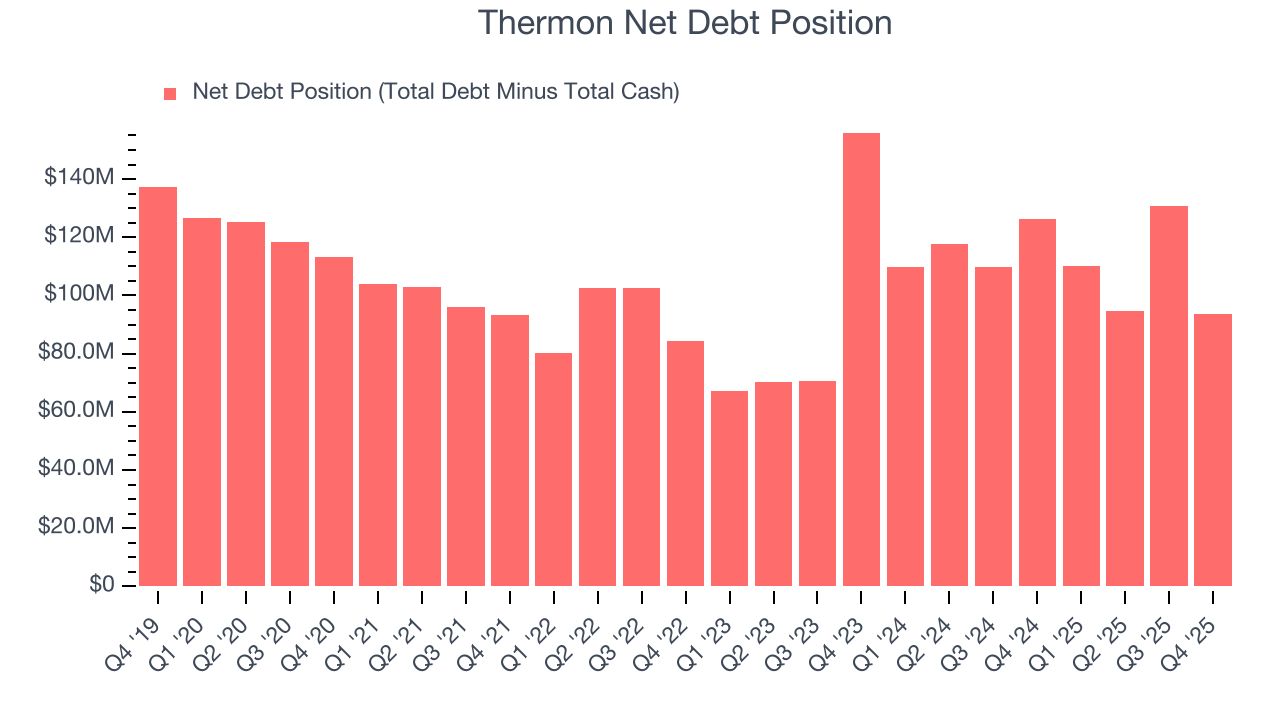
With $117.9 million of EBITDA over the last 12 months, we view Thermon’s 0.8× net-debt-to-EBITDA ratio as safe. We also see its $8.30 million of annual interest expenses as appropriate. The company’s profits give it plenty of breathing room, allowing it to continue investing in growth initiatives.
12. Key Takeaways from Thermon’s Q4 Results
We were impressed by how significantly Thermon blew past analysts’ EBITDA expectations this quarter. We were also excited its revenue outperformed Wall Street’s estimates by a wide margin. Zooming out, we think this was a good print with some key areas of upside. The stock traded up 6% to $48.95 immediately after reporting.
13. Is Now The Time To Buy Thermon?
Updated: March 19, 2026 at 11:46 PM EDT
When considering an investment in Thermon, investors should account for its valuation and business qualities as well as what’s happened in the latest quarter.
We think Thermon is a solid business. First off, its revenue growth was impressive over the last five years. And while its projected EPS for the next year is lacking, its expanding operating margin shows the business has become more efficient. On top of that, its astounding EPS growth over the last five years shows its profits are trickling down to shareholders.
Thermon’s P/E ratio based on the next 12 months is 21.9x. Looking at the industrials landscape right now, Thermon trades at a pretty interesting price. If you’re a fan of the business and management team, now is a good time to scoop up some shares.
Wall Street analysts have a consensus one-year price target of $51 on the company (compared to the current share price of $48.52), implying they see 5.1% upside in buying Thermon in the short term.