Toll Brothers (TOL)
We’re cautious of Toll Brothers. Its decelerating growth shows demand is falling and its weak gross margin indicates it has bad unit economics.― StockStory Analyst Team
1. News


2. Summary
Why Toll Brothers Is Not Exciting
Started by two brothers who started by building and selling just one home in Pennsylvania, today Toll Brothers (NYSE:TOL) is a luxury homebuilder across the United States.
- Forecasted revenue decline of 6.5% for the upcoming 12 months implies demand will fall off a cliff
- Sales pipeline suggests its future revenue growth won’t meet our standards as its backlog averaged 9.4% declines over the past two years
- One positive is that its performance over the past five years shows its incremental sales were extremely profitable, as its annual earnings per share growth of 29.8% outpaced its revenue gains


Toll Brothers’s quality isn’t great. Our attention is focused on better businesses.
Why There Are Better Opportunities Than Toll Brothers


Toll Brothers is trading at $137.41 per share, or 10.9x forward P/E. This multiple is cheaper than most industrials peers, but we think this is justified.
Cheap stocks can look like a great deal at first glance, but they can be value traps. They often have less earnings power, meaning there is more reliance on a re-rating to generate good returns - an unlikely scenario for low-quality companies.
3. Toll Brothers (TOL) Research Report: Q4 CY2025 Update
Homebuilding company Toll Brothers (NYSE:TOL) announced better-than-expected revenue in Q4 CY2025, with sales up 15.4% year on year to $2.15 billion. Its GAAP profit of $2.19 per share was 3.4% above analysts’ consensus estimates.
Toll Brothers (TOL) Q4 CY2025 Highlights:
- Revenue: $2.15 billion vs analyst estimates of $1.86 billion (15.4% year-on-year growth, 15.7% beat)
- EPS (GAAP): $2.19 vs analyst estimates of $2.12 (3.4% beat)
- Operating Margin: 10.2%, down from 12.8% in the same quarter last year
- Backlog: $6.02 billion at quarter end, down 13.3% year on year
- Market Capitalization: $15.78 billion
Company Overview
Started by two brothers who started by building and selling just one home in Pennsylvania, today Toll Brothers (NYSE:TOL) is a luxury homebuilder across the United States.
Toll Brothers, Inc., a luxury residential homebuilder incorporated in the late 1980s, designs, constructs, markets, and arranges financing for a wide array of homes across numerous states and the District of Columbia. The company caters to luxury homebuyers under various brand names, offering single-family homes, multi-family homes, retirement and second-home communities, and urban low, mid, and high-rise communities.
In recent years, Toll Brothers has delivered a significant number of homes from hundreds of communities, with an average sales price in the mid-to-high six figures. The company's marketing strategy focuses on enhancing its reputation as a builder of high-quality luxury homes, offering attractive design features and a two-step sales process.
Toll Brothers' operations span several segments, including homebuilding, apartment living, and mortgage financing. The company also invests in joint ventures to strategically manage risk, capital allocation, and geographic expansion, developing land, building homes, developing luxury for-rent residential properties, and providing financing and land banking services.
4. Home Builders
Traditionally, homebuilders have built competitive advantages with economies of scale that lead to advantaged purchasing and brand recognition among consumers. Aesthetic trends have always been important in the space, but more recently, energy efficiency and conservation are driving innovation. However, these companies are still at the whim of the macro, specifically interest rates that heavily impact new and existing home sales. In fact, homebuilders are one of the most cyclical subsectors within industrials.
Competitors of Toll Brothers include D.R. Horton (NYSE:DHI), Lennar (NYSE:LEN), and PulteGroup (NYSE:PHM).
5. Revenue Growth
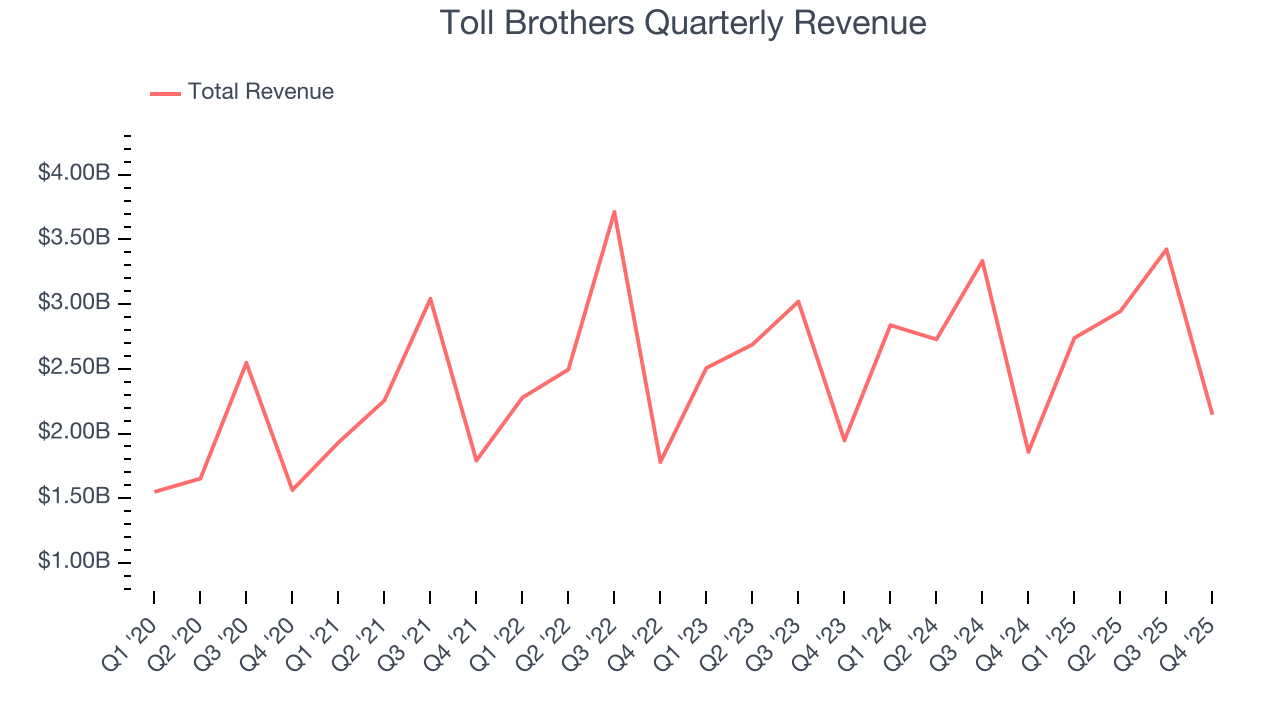
A company’s long-term sales performance can indicate its overall quality. Any business can put up a good quarter or two, but many enduring ones grow for years. Thankfully, Toll Brothers’s 9% annualized revenue growth over the last five years was solid. Its growth beat the average industrials company and shows its offerings resonate with customers.
We at StockStory place the most emphasis on long-term growth, but within industrials, a half-decade historical view may miss cycles, industry trends, or a company capitalizing on catalysts such as a new contract win or a successful product line. Toll Brothers’s recent performance shows its demand has slowed as its annualized revenue growth of 5.2% over the last two years was below its five-year trend. We’re wary when companies in the sector see decelerations in revenue growth, as it could signal changing consumer tastes aided by low switching costs. 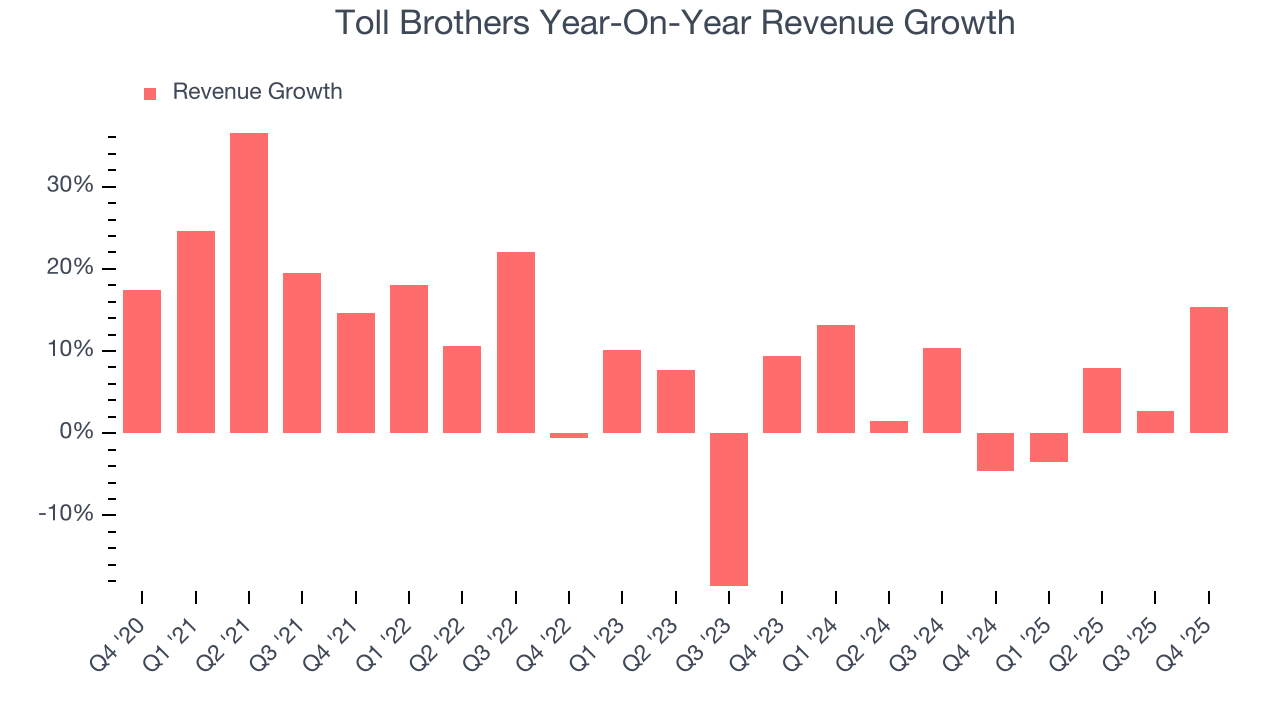
Toll Brothers also reports its backlog, or the value of its outstanding orders that have not yet been executed or delivered. Toll Brothers’s backlog reached $6.02 billion in the latest quarter and averaged 9.4% year-on-year declines over the last two years. Because this number is lower than its revenue growth, we can see the company hasn’t secured enough new orders to maintain its growth rate in the future. 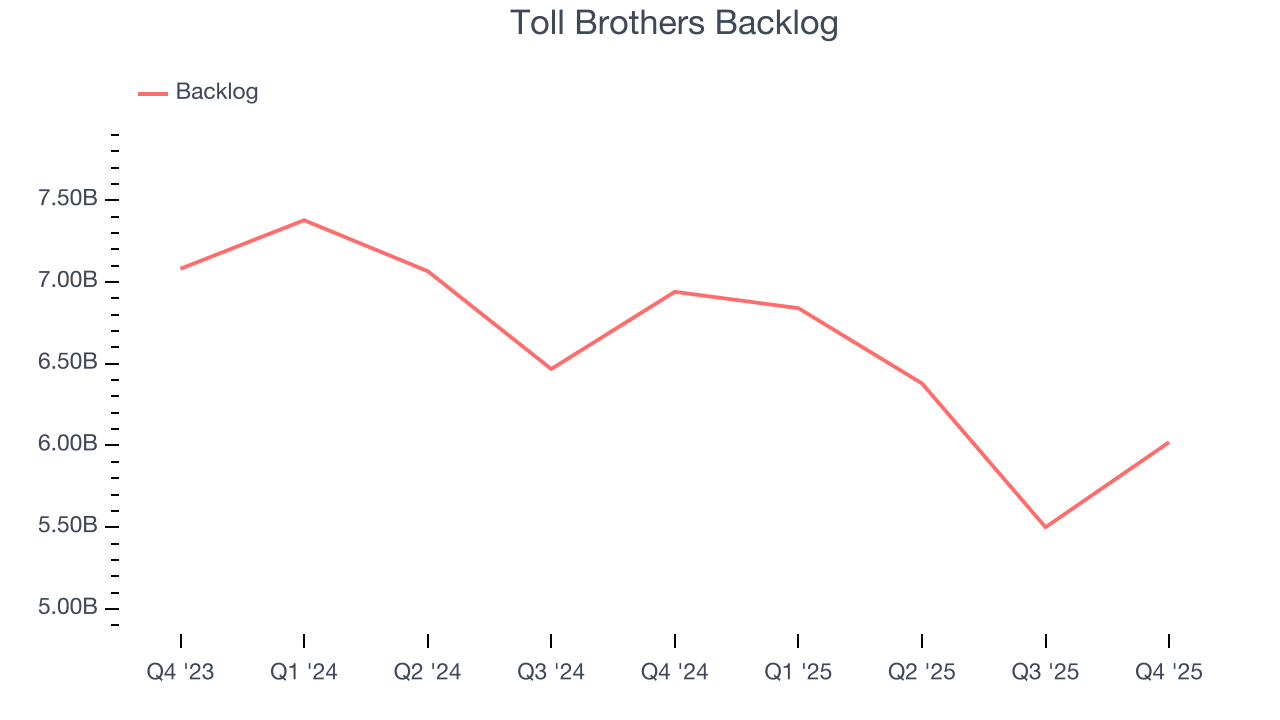
This quarter, Toll Brothers reported year-on-year revenue growth of 15.4%, and its $2.15 billion of revenue exceeded Wall Street’s estimates by 15.7%.
Looking ahead, sell-side analysts expect revenue to decline by 6.4% over the next 12 months, a deceleration versus the last two years. This projection doesn't excite us and suggests its products and services will face some demand challenges.
6. Gross Margin & Pricing Power
Gross profit margin is a critical metric to track because it sheds light on its pricing power, complexity of products, and ability to procure raw materials, equipment, and labor.
Toll Brothers has bad unit economics for an industrials company, giving it less room to reinvest and develop new offerings. As you can see below, it averaged a 25.8% gross margin over the last five years. Said differently, Toll Brothers had to pay a chunky $74.22 to its suppliers for every $100 in revenue. 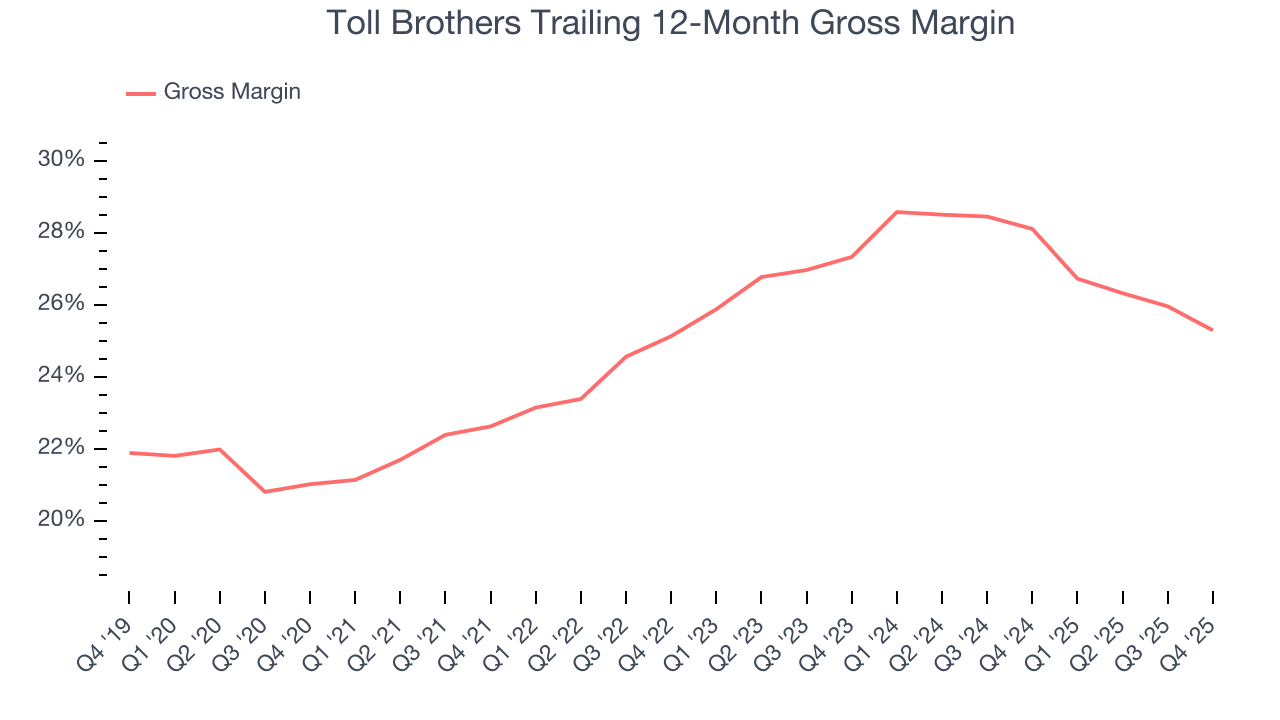
Toll Brothers’s gross profit margin came in at 22.2% this quarter , marking a 3.5 percentage point decrease from 25.7% in the same quarter last year. Toll Brothers’s full-year margin has also been trending down over the past 12 months, decreasing by 2.8 percentage points. If this move continues, it could suggest a more competitive environment with some pressure to lower prices and higher input costs (such as raw materials and manufacturing expenses).
7. Operating Margin
Toll Brothers has been a well-oiled machine over the last five years. It demonstrated elite profitability for an industrials business, boasting an average operating margin of 16.3%. This result was particularly impressive because of its low gross margin, which is mostly a factor of what it sells and takes huge shifts to move meaningfully. Companies have more control over their operating margins, and it’s a show of well-managed operations if they’re high when gross margins are low.
Looking at the trend in its profitability, Toll Brothers’s operating margin rose by 3.7 percentage points over the last five years, as its sales growth gave it operating leverage. Its expansion was impressive, especially when considering most Home Builders peers saw their margins plummet.
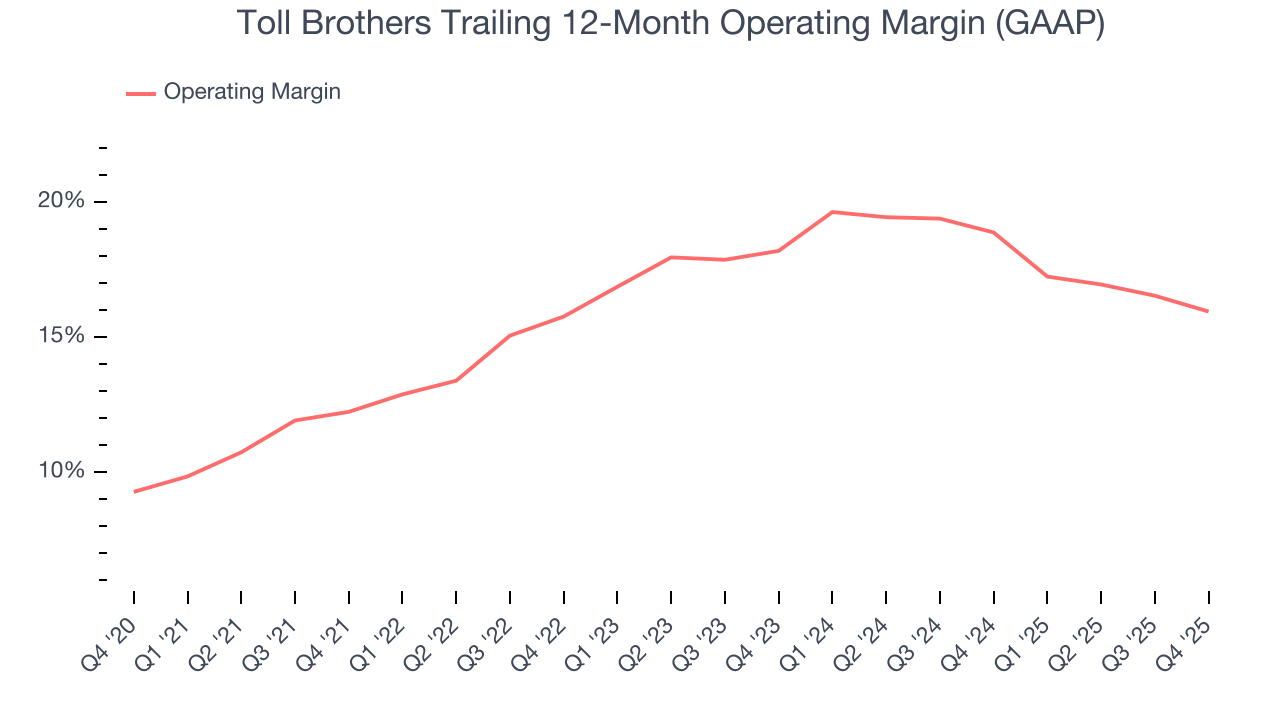
This quarter, Toll Brothers generated an operating margin profit margin of 10.2%, down 2.6 percentage points year on year. Since Toll Brothers’s gross margin decreased more than its operating margin, we can assume its recent inefficiencies were driven more by weaker leverage on its cost of sales rather than increased marketing, R&D, and administrative overhead expenses.
8. Earnings Per Share
Revenue trends explain a company’s historical growth, but the long-term change in earnings per share (EPS) points to the profitability of that growth – for example, a company could inflate its sales through excessive spending on advertising and promotions.
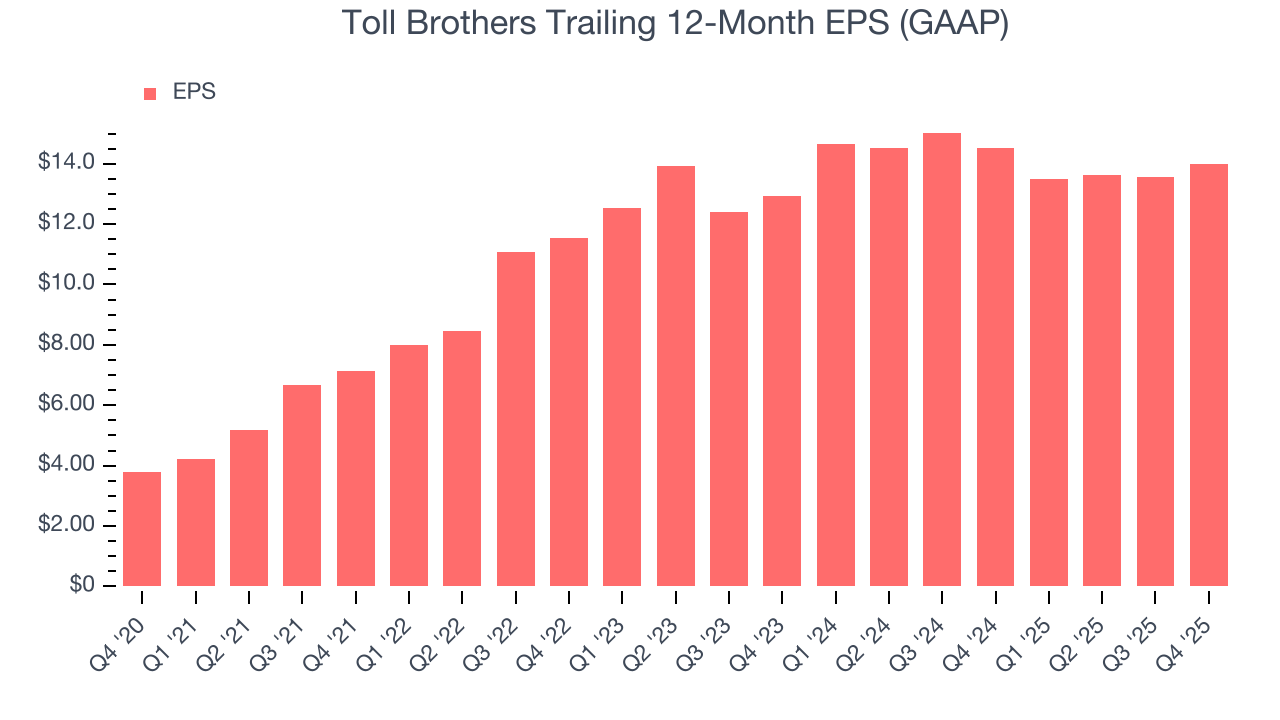
Toll Brothers’s EPS grew at an astounding 29.8% compounded annual growth rate over the last five years, higher than its 9% annualized revenue growth. This tells us the company became more profitable on a per-share basis as it expanded.
We can take a deeper look into Toll Brothers’s earnings quality to better understand the drivers of its performance. As we mentioned earlier, Toll Brothers’s operating margin declined this quarter but expanded by 3.7 percentage points over the last five years. Its share count also shrank by 24.3%, and these factors together are positive signs for shareholders because improving profitability and share buybacks turbocharge EPS growth relative to revenue growth. 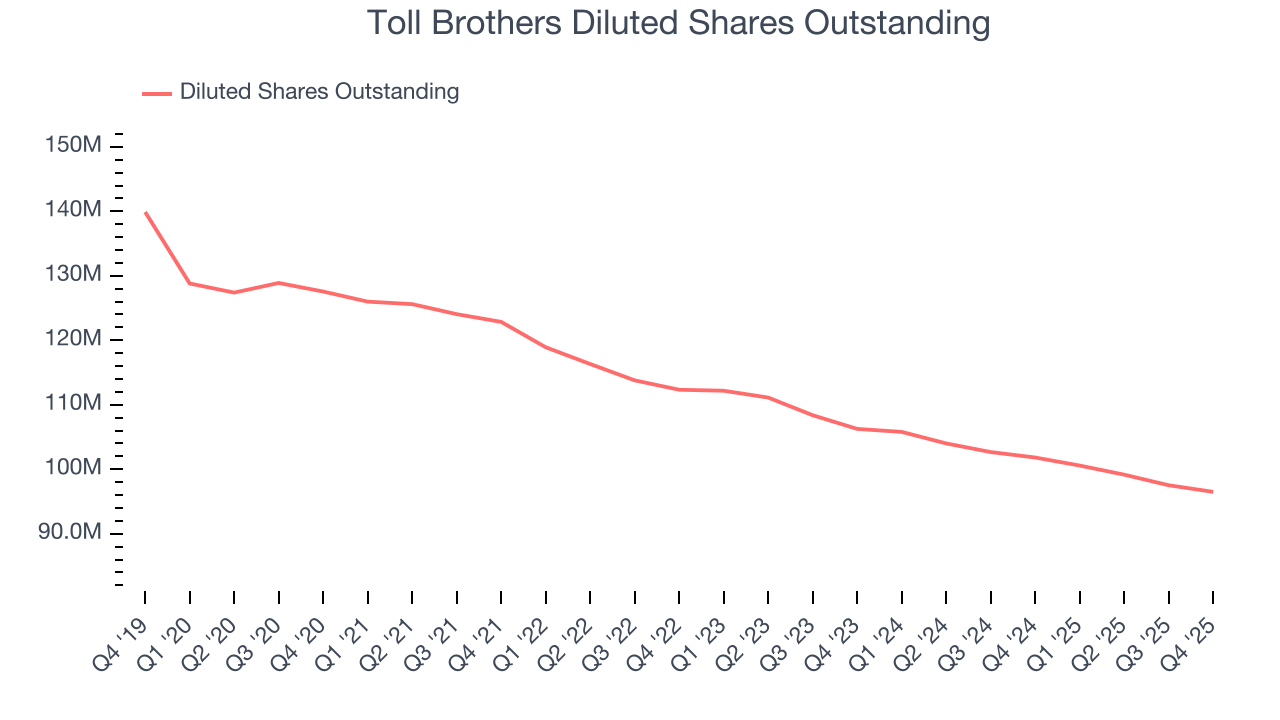
Like with revenue, we analyze EPS over a shorter period to see if we are missing a change in the business.
For Toll Brothers, its two-year annual EPS growth of 4% was lower than its five-year trend. We hope its growth can accelerate in the future.
In Q4, Toll Brothers reported EPS of $2.19, up from $1.75 in the same quarter last year. This print beat analysts’ estimates by 3.4%. Over the next 12 months, Wall Street expects Toll Brothers’s full-year EPS of $14 to shrink by 9.7%.
9. Cash Is King
Free cash flow isn't a prominently featured metric in company financials and earnings releases, but we think it's telling because it accounts for all operating and capital expenses, making it tough to manipulate. Cash is king.
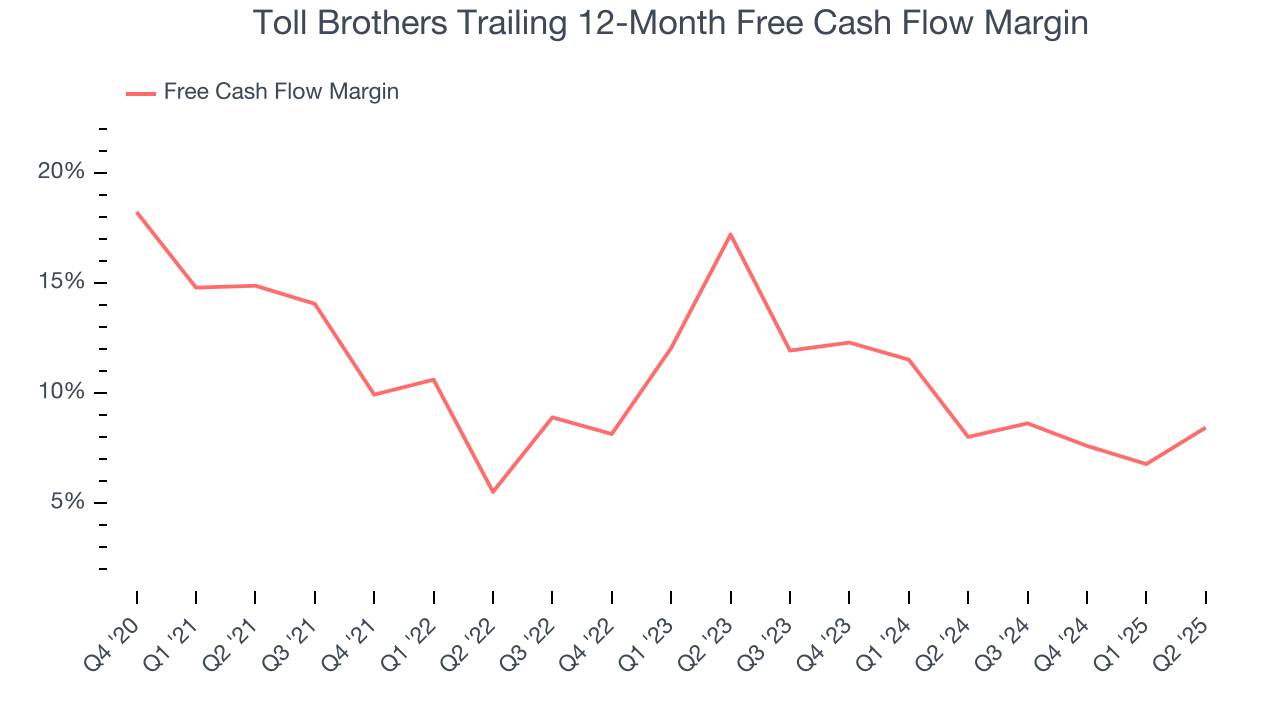
Toll Brothers has shown robust cash profitability, enabling it to comfortably ride out cyclical downturns while investing in plenty of new offerings and returning capital to investors. The company’s free cash flow margin averaged 9.8% over the last five years, quite impressive for an industrials business.
Taking a step back, we can see that Toll Brothers’s margin expanded by 3.5 percentage points during that time. This is encouraging because it gives the company more optionality.
10. Return on Invested Capital (ROIC)
EPS and free cash flow tell us whether a company was profitable while growing its revenue. But was it capital-efficient? A company’s ROIC explains this by showing how much operating profit it makes compared to the money it has raised (debt and equity).
Although Toll Brothers hasn’t been the highest-quality company lately, it historically found a few growth initiatives that worked out well. Its five-year average ROIC was 14.4%, impressive for an industrials business.
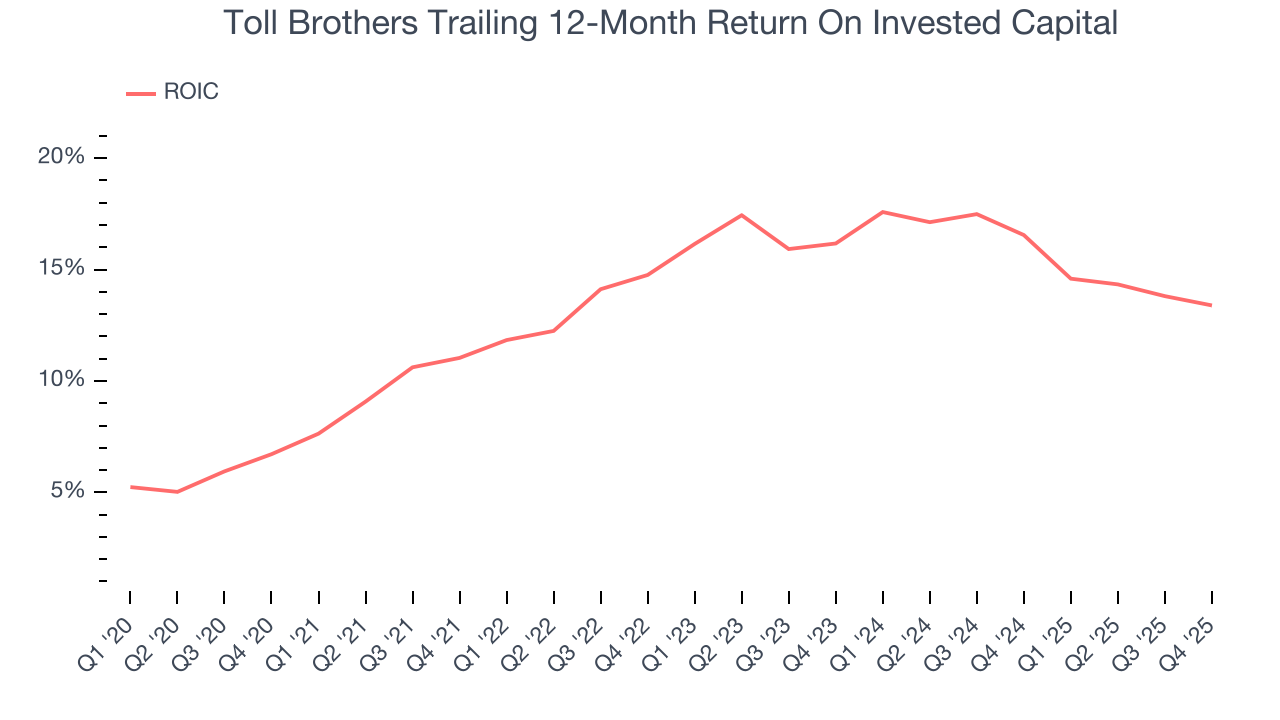
We like to invest in businesses with high returns, but the trend in a company’s ROIC is what often surprises the market and moves the stock price. On average, Toll Brothers’s ROIC increased by 2.1 percentage points annually each year over the last few years. This is a good sign, and if its returns keep rising, there’s a chance it could evolve into an investable business.
11. Balance Sheet Assessment
Toll Brothers reported $1.20 billion of cash and $2.84 billion of debt on its balance sheet in the most recent quarter. As investors in high-quality companies, we primarily focus on two things: 1) that a company’s debt level isn’t too high and 2) that its interest payments are not excessively burdening the business.
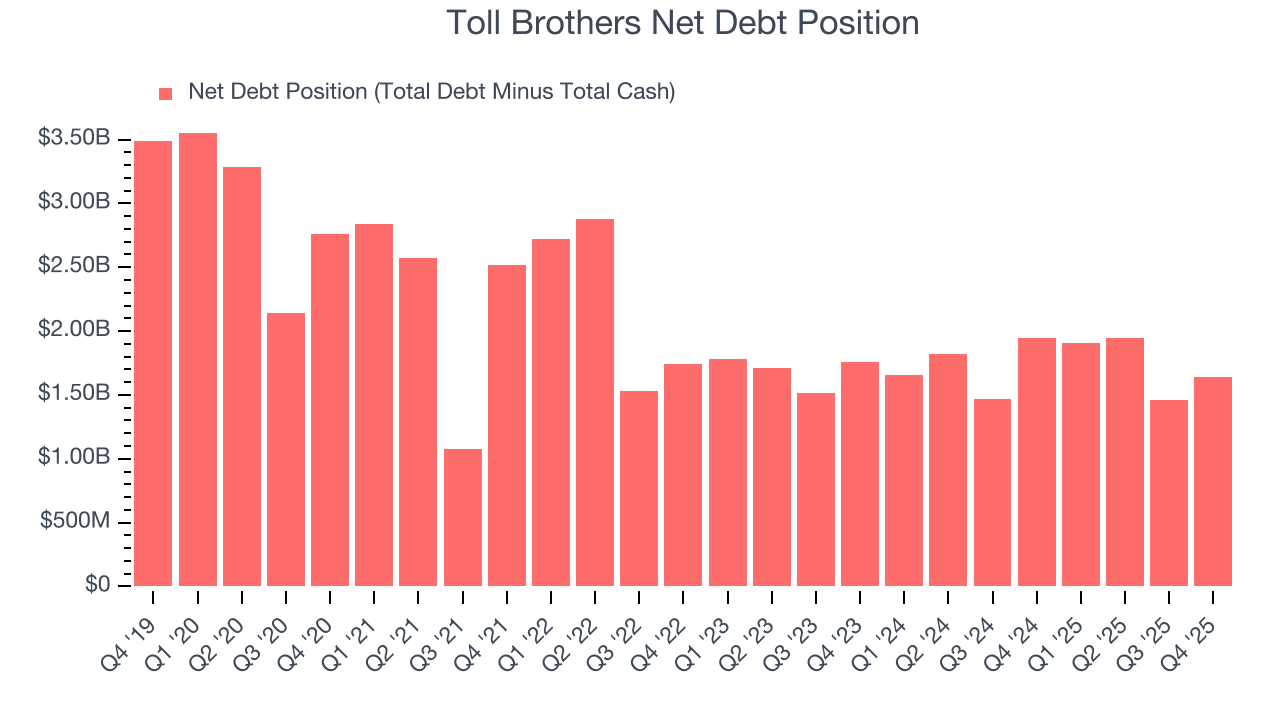
With $1.80 billion of EBITDA over the last 12 months, we view Toll Brothers’s 0.9× net-debt-to-EBITDA ratio as safe. We also see its $20.51 million of annual interest expenses as appropriate. The company’s profits give it plenty of breathing room, allowing it to continue investing in growth initiatives.
12. Key Takeaways from Toll Brothers’s Q4 Results
We were impressed by how significantly Toll Brothers blew past analysts’ revenue expectations this quarter. We were also glad its EPS outperformed Wall Street’s estimates. Zooming out, we think this was a good print with some key areas of upside. The stock remained flat at $162.69 immediately after reporting.
13. Is Now The Time To Buy Toll Brothers?
Updated: March 25, 2026 at 11:38 PM EDT
Before making an investment decision, investors should account for Toll Brothers’s business fundamentals and valuation in addition to what happened in the latest quarter.
Toll Brothers isn’t a terrible business, but it isn’t one of our picks. Although its revenue growth was solid over the last five years, it’s expected to deteriorate over the next 12 months and its projected EPS for the next year is lacking. And while the company’s astounding EPS growth over the last five years shows its profits are trickling down to shareholders, the downside is its backlog declined.
Toll Brothers’s P/E ratio based on the next 12 months is 10.8x. This valuation is reasonable, but the company’s shakier fundamentals present too much downside risk. We're pretty confident there are more exciting stocks to buy at the moment.
Wall Street analysts have a consensus one-year price target of $172.75 on the company (compared to the current share price of $136.96).
Although the price target is bullish, readers should exercise caution because analysts tend to be overly optimistic. The firms they work for, often big banks, have relationships with companies that extend into fundraising, M&A advisory, and other rewarding business lines. As a result, they typically hesitate to say bad things for fear they will lose out. We at StockStory do not suffer from such conflicts of interest, so we’ll always tell it like it is.