Tri Pointe Homes (TPH)
Tri Pointe Homes keeps us up at night. Its poor sales growth and falling returns on capital suggest its growth opportunities are shrinking.― StockStory Analyst Team
1. News


2. Summary
Why We Think Tri Pointe Homes Will Underperform
Established in 2009 in California, Tri Pointe Homes (NYSE:TPH) is a United States homebuilder recognized for its innovative and sustainable approach to creating premium, life-enhancing homes.
- Products and services are facing significant end-market challenges during this cycle as sales have declined by 3.3% annually over the last two years
- Performance over the past two years shows each sale was less profitable as its earnings per share dropped by 8.2% annually, worse than its revenue
- Projected sales decline of 11.6% over the next 12 months indicates demand will continue deteriorating


Tri Pointe Homes’s quality doesn’t meet our hurdle. We’d search for superior opportunities elsewhere.
Why There Are Better Opportunities Than Tri Pointe Homes


Tri Pointe Homes’s stock price of $46.51 implies a valuation ratio of 22.5x forward P/E. This multiple rich for the business quality. Not a great combination.
Paying a premium for high-quality companies with strong long-term earnings potential is preferable to owning challenged businesses with questionable prospects. That helps the prudent investor sleep well at night.
3. Tri Pointe Homes (TPH) Research Report: Q4 CY2025 Update
Homebuilder Tri Pointe Homes (NYSE:TPH) reported revenue ahead of Wall Street’s expectations in Q4 CY2025, but sales fell by 23.9% year on year to $954.6 million. Its GAAP profit of $0.70 per share was 10.5% below analysts’ consensus estimates.
Tri Pointe Homes (TPH) Q4 CY2025 Highlights:
- Revenue: $954.6 million vs analyst estimates of $939.1 million (23.9% year-on-year decline, 1.7% beat)
- EPS (GAAP): $0.70 vs analyst expectations of $0.78 (10.5% miss)
- Adjusted EBITDA: $147.1 million (15.4% margin, 34.4% year-on-year decline)
- Adjusted EBITDA Margin: 15.4%, down from 17.9% in the same quarter last year
- Backlog: $670.1 million at quarter end, down 42.5% year on year
- Market Capitalization: $3.92 billion
Company Overview
Established in 2009 in California, Tri Pointe Homes (NYSE:TPH) is a United States homebuilder recognized for its innovative and sustainable approach to creating premium, life-enhancing homes.
Tri Pointe Homes was founded in 2009 and is a leading homebuilder and real estate developer in the United States, offering a range of innovative single-family attached and detached homes across multiple markets.
Tri Pointe has grown from a Southern California fee homebuilder into a national player, capitalizing on high-demand markets with favorable population and employment growth. The company's strategy focuses on acquiring attractive land positions while reducing risk and expanding its market presence through organic growth and strategic acquisitions.
The company offers a variety of product offerings, from entry-level to luxury homes, allowing it to serve a broad spectrum of homebuyers and adapt to changing market conditions. In addition to homebuilding, Tri Pointe offers complementary financial services through its Tri Pointe Solutions division, which includes mortgage financing, title and escrow services, and property and casualty insurance agency operations. These services enhance the overall homebuying experience for customers and provide additional revenue streams for the company.
Tri Pointe emphasizes quality control, customer service, and warranty programs to ensure homebuyer satisfaction.Tri Pointe Homes generates revenue primarily through individual home sales, with buyers typically providing a small deposit upfront and the bulk of payment at closing. The company recognizes most revenue upon home completion and transfer of ownership, rather than using long-term contracts or milestone-based payments.
4. Home Builders
Traditionally, homebuilders have built competitive advantages with economies of scale that lead to advantaged purchasing and brand recognition among consumers. Aesthetic trends have always been important in the space, but more recently, energy efficiency and conservation are driving innovation. However, these companies are still at the whim of the macro, specifically interest rates that heavily impact new and existing home sales. In fact, homebuilders are one of the most cyclical subsectors within industrials.
Tri Pointe Homes’ main competitors include Lennar Corporation (NYSE:LEN), D.R. Horton (NYSE:DHI), PulteGroup (NYSE:PHM), and Toll Brothers (NYSE:TOL).
5. Revenue Growth
A company’s long-term sales performance is one signal of its overall quality. Any business can experience short-term success, but top-performing ones enjoy sustained growth for years. Over the last five years, Tri Pointe Homes grew its sales at a weak 1.2% compounded annual growth rate. This fell short of our benchmarks and is a rough starting point for our analysis.
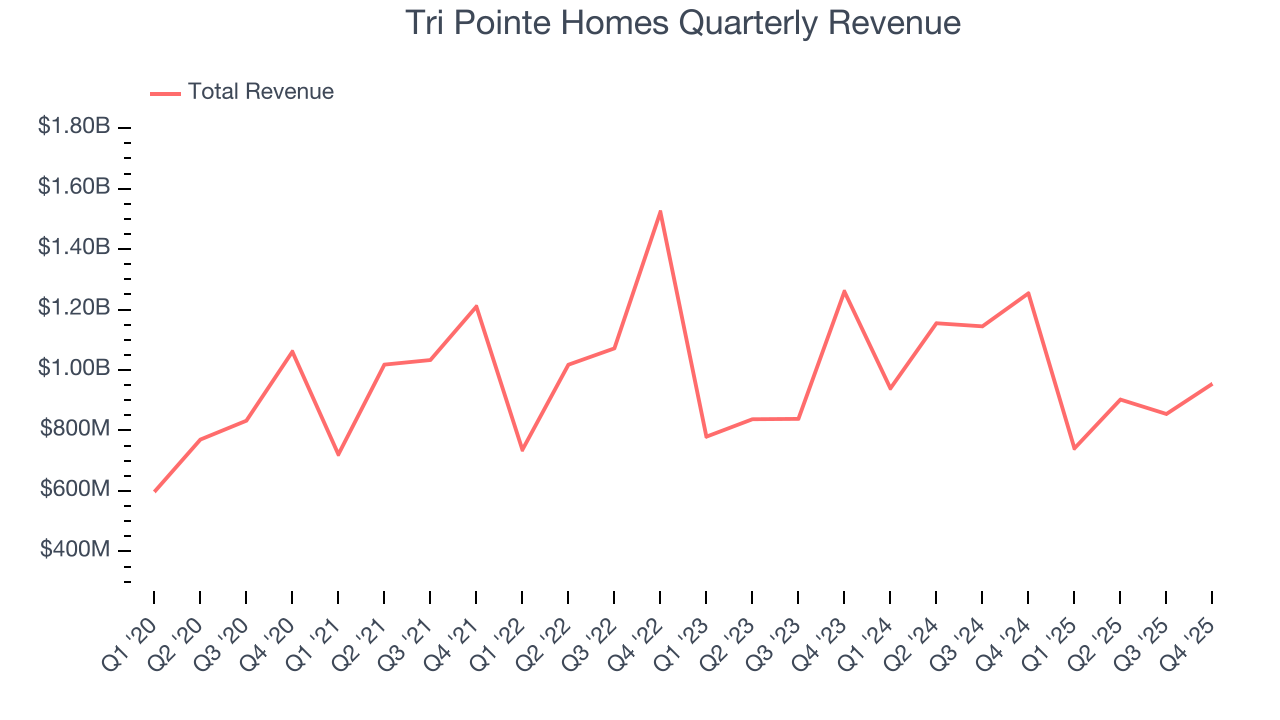
Long-term growth is the most important, but within industrials, a half-decade historical view may miss new industry trends or demand cycles. Tri Pointe Homes’s performance shows it grew in the past but relinquished its gains over the last two years, as its revenue fell by 3.6% annually. 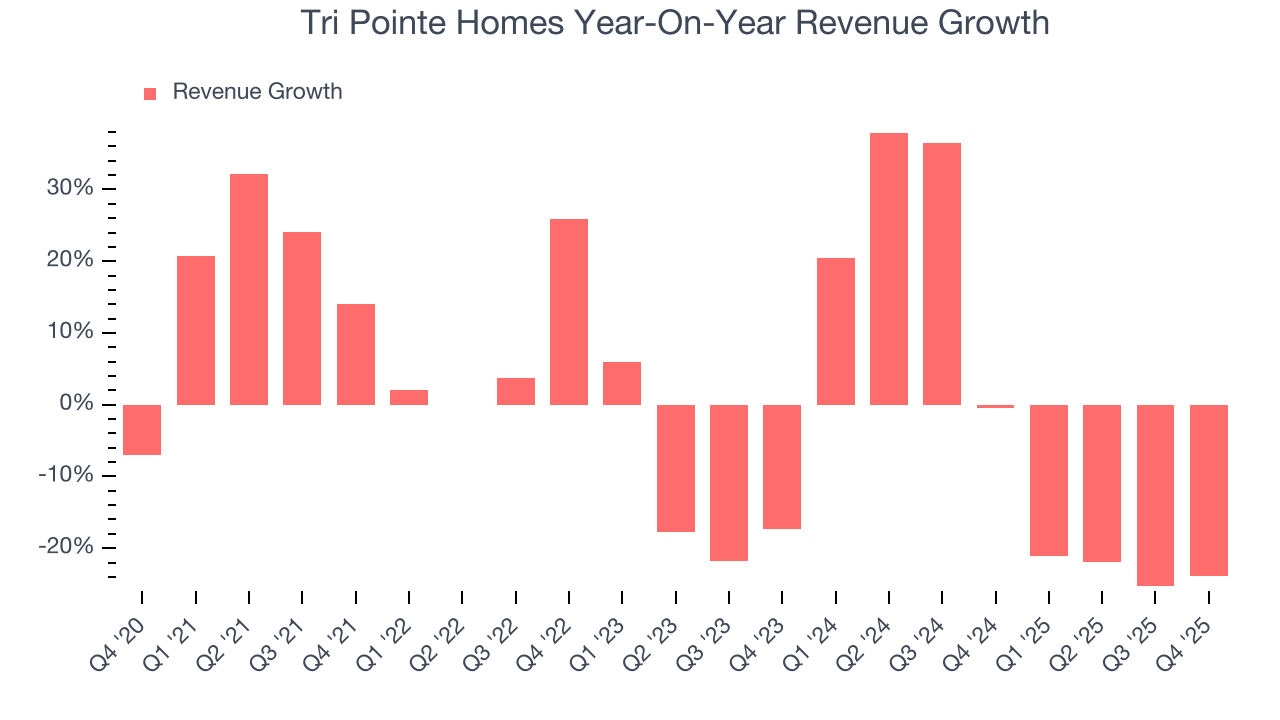
We can better understand the company’s revenue dynamics by analyzing its backlog, or the value of its outstanding orders that have not yet been executed or delivered. Tri Pointe Homes’s backlog reached $670.1 million in the latest quarter and averaged 39.5% year-on-year declines over the last two years. Because this number is lower than its revenue growth, we can see the company hasn’t secured enough new orders to maintain its growth rate in the future. 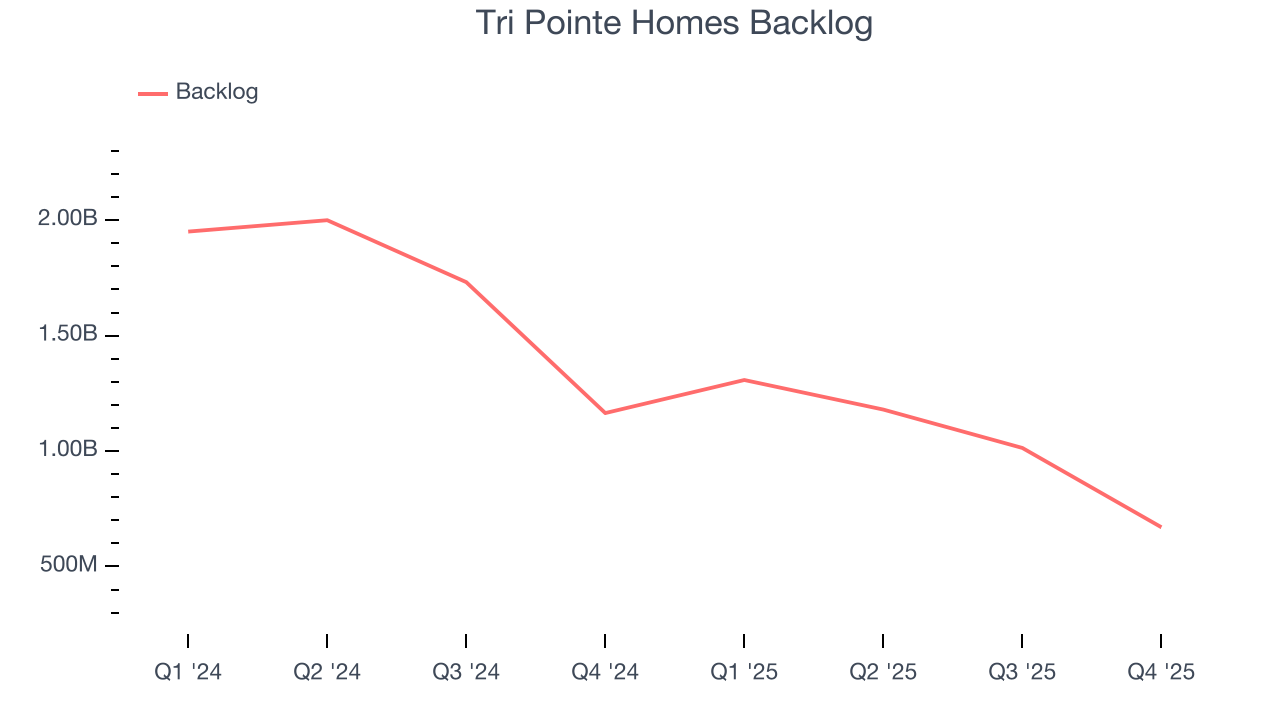
This quarter, Tri Pointe Homes’s revenue fell by 23.9% year on year to $954.6 million but beat Wall Street’s estimates by 1.7%.
Looking ahead, sell-side analysts expect revenue to decline by 6.8% over the next 12 months, a deceleration versus the last two years. This projection doesn't excite us and indicates its products and services will see some demand headwinds.
6. Gross Margin & Pricing Power
Tri Pointe Homes has bad unit economics for an industrials company, giving it less room to reinvest and develop new offerings. As you can see below, it averaged a 24.3% gross margin over the last five years. That means Tri Pointe Homes paid its suppliers a lot of money ($75.74 for every $100 in revenue) to run its business. 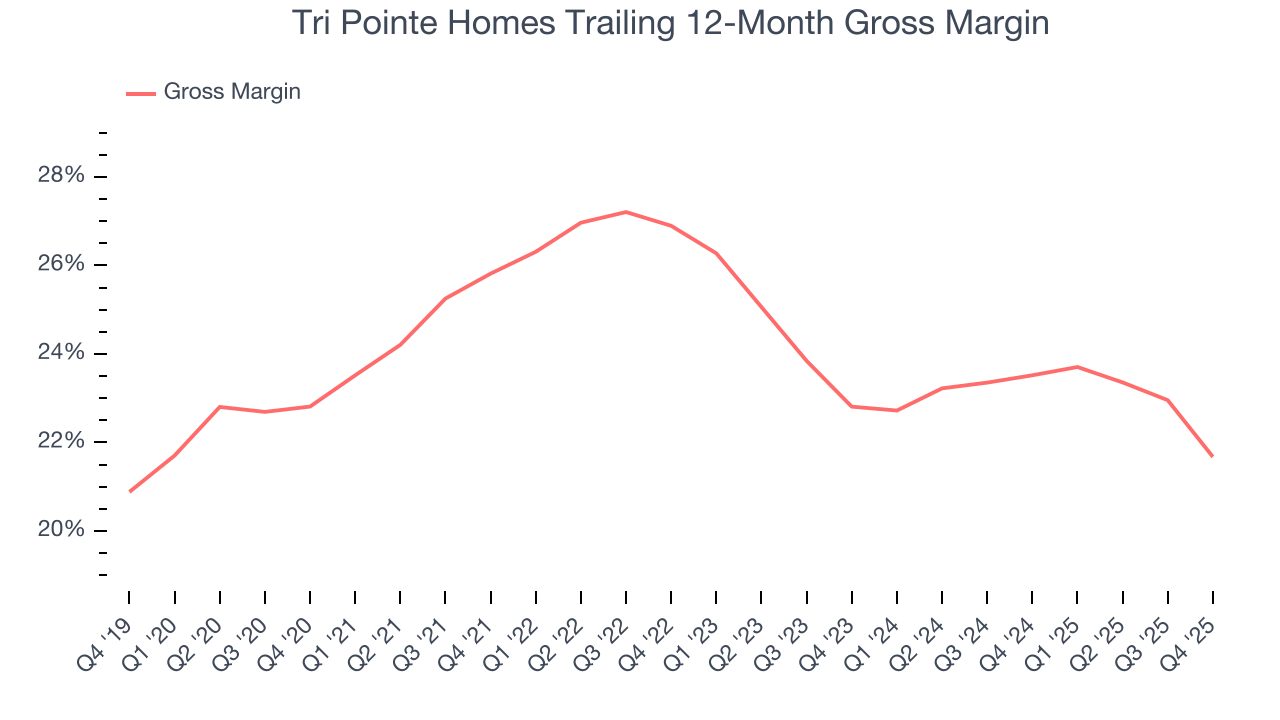
This quarter, Tri Pointe Homes’s gross profit margin was 19.2% , marking a 4.4 percentage point decrease from 23.6% in the same quarter last year. Tri Pointe Homes’s full-year margin has also been trending down over the past 12 months, decreasing by 1.8 percentage points. If this move continues, it could suggest a more competitive environment with some pressure to lower prices and higher input costs (such as raw materials and manufacturing expenses).
7. Operating Margin
Operating margin is one of the best measures of profitability because it tells us how much money a company takes home after procuring and manufacturing its products, marketing and selling those products, and most importantly, keeping them relevant through research and development.
Tri Pointe Homes has been an efficient company over the last five years. It was one of the more profitable businesses in the industrials sector, boasting an average operating margin of 13.9%. This result was particularly impressive because of its low gross margin, which is mostly a factor of what it sells and takes huge shifts to move meaningfully. Companies have more control over their operating margins, and it’s a show of well-managed operations if they’re high when gross margins are low.
Analyzing the trend in its profitability, Tri Pointe Homes’s operating margin decreased by 6.9 percentage points over the last five years. This raises questions about the company’s expense base because its revenue growth should have given it leverage on its fixed costs, resulting in better economies of scale and profitability.
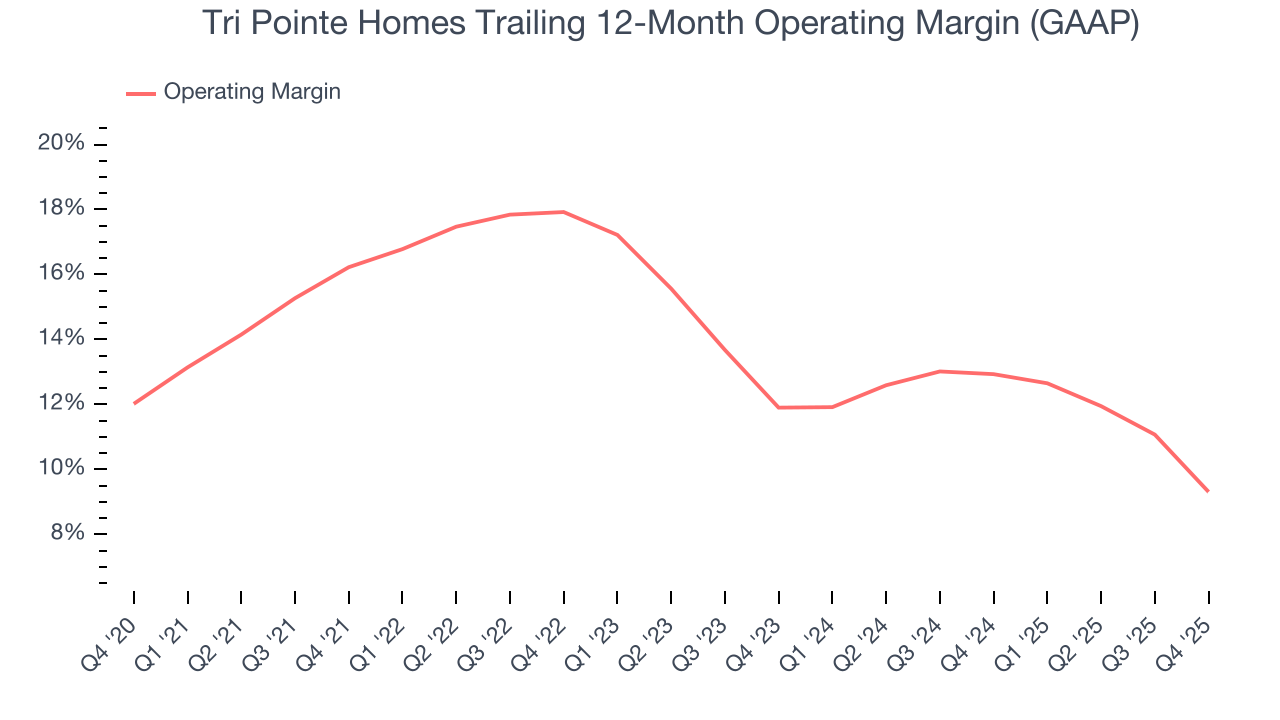
This quarter, Tri Pointe Homes generated an operating margin profit margin of 7.9%, down 5.6 percentage points year on year. Since Tri Pointe Homes’s operating margin decreased more than its gross margin, we can assume it was less efficient because expenses such as marketing, R&D, and administrative overhead increased.
8. Earnings Per Share
Revenue trends explain a company’s historical growth, but the long-term change in earnings per share (EPS) points to the profitability of that growth – for example, a company could inflate its sales through excessive spending on advertising and promotions.
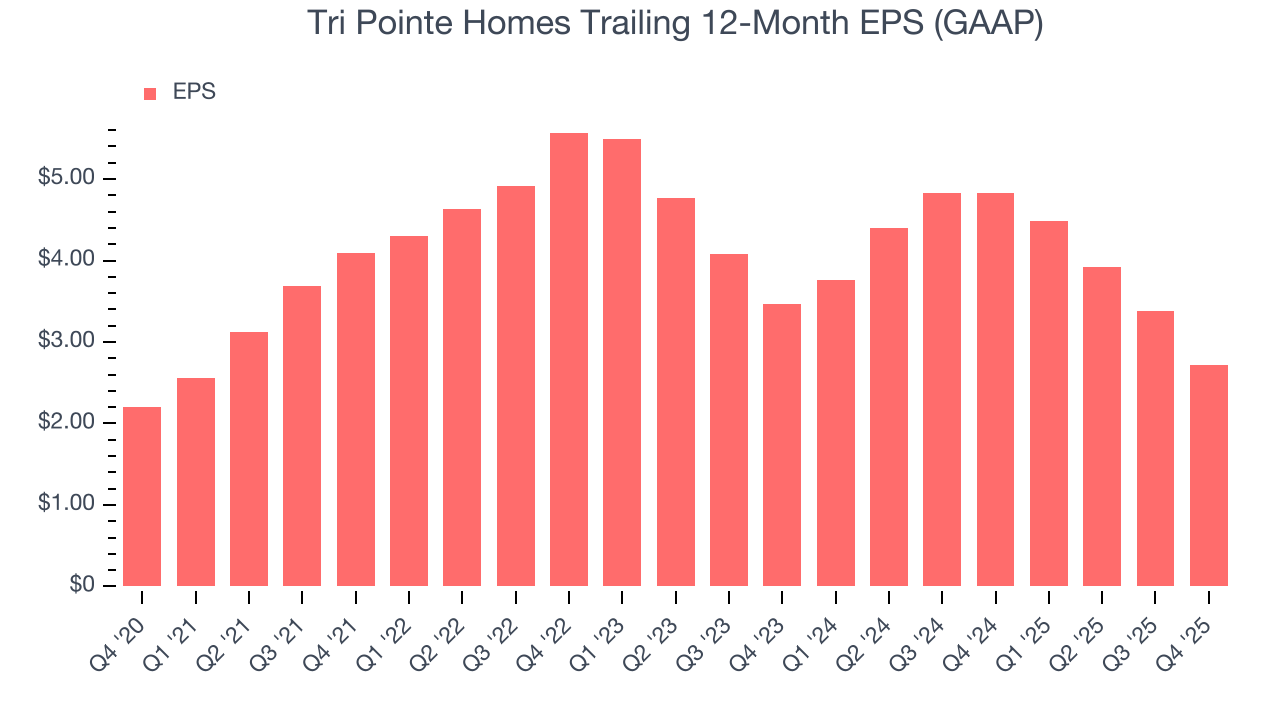
Tri Pointe Homes’s EPS grew at an unimpressive 4.3% compounded annual growth rate over the last five years. This performance was better than its flat revenue but doesn’t tell us much about its business quality because its operating margin didn’t improve.
Diving into the nuances of Tri Pointe Homes’s earnings can give us a better understanding of its performance. A five-year view shows that Tri Pointe Homes has repurchased its stock, shrinking its share count by 31.1%. This tells us its EPS outperformed its revenue not because of increased operational efficiency but financial engineering, as buybacks boost per share earnings. 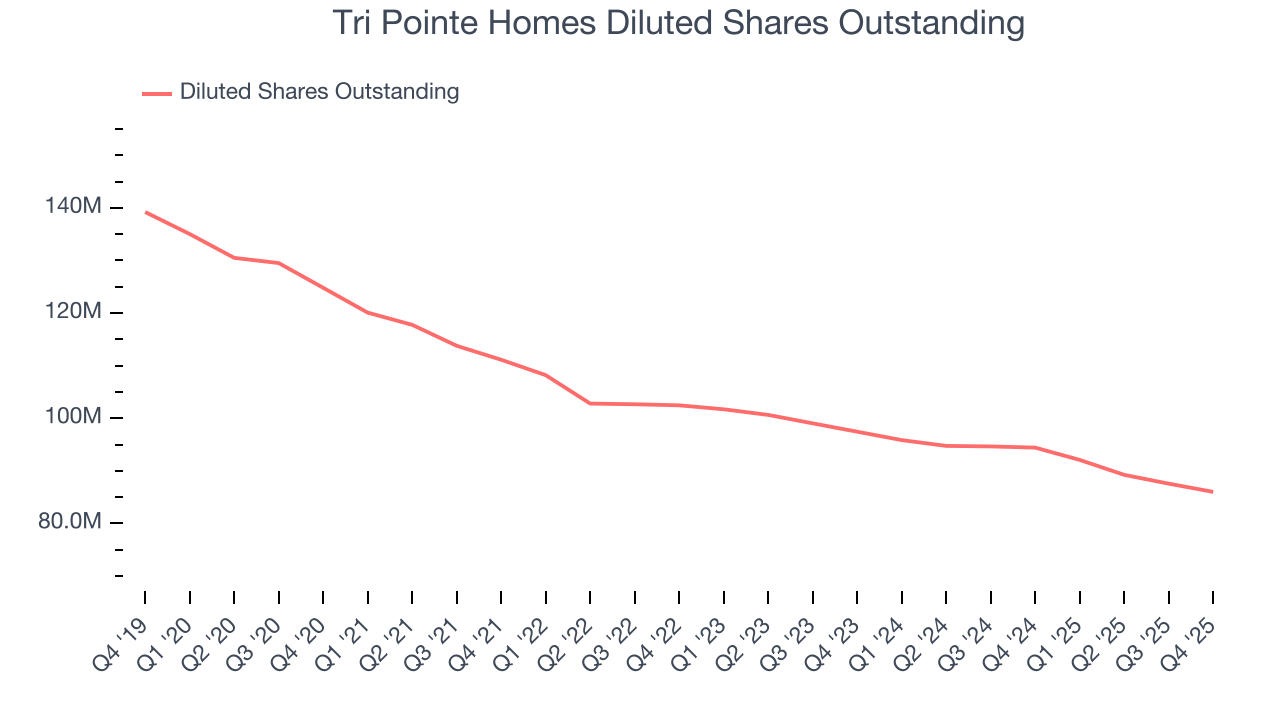
Like with revenue, we analyze EPS over a more recent period because it can provide insight into an emerging theme or development for the business.
For Tri Pointe Homes, its two-year annual EPS declines of 11.4% show it’s continued to underperform. These results were bad no matter how you slice the data.
In Q4, Tri Pointe Homes reported EPS of $0.70, down from $1.37 in the same quarter last year. This print missed analysts’ estimates. Over the next 12 months, Wall Street expects Tri Pointe Homes’s full-year EPS of $2.72 to shrink by 17.7%.
9. Cash Is King
If you’ve followed StockStory for a while, you know we emphasize free cash flow. Why, you ask? We believe that in the end, cash is king, and you can’t use accounting profits to pay the bills.
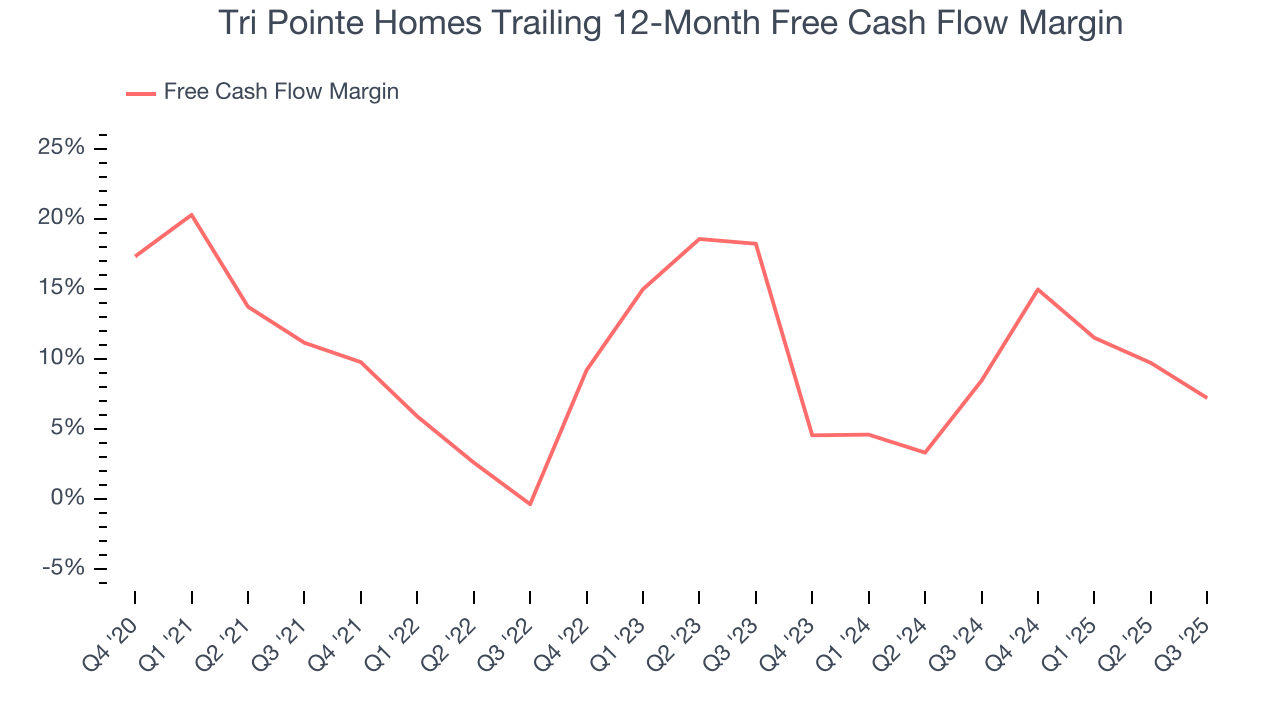
Tri Pointe Homes has shown impressive cash profitability, enabling it to ride out cyclical downturns more easily while maintaining its investments in new and existing offerings. The company’s free cash flow margin averaged 8.1% over the last five years, better than the broader industrials sector.
Taking a step back, we can see that Tri Pointe Homes’s margin dropped by 10 percentage points during that time. If its declines continue, it could signal increasing investment needs and capital intensity.
10. Return on Invested Capital (ROIC)
EPS and free cash flow tell us whether a company was profitable while growing its revenue. But was it capital-efficient? Enter ROIC, a metric showing how much operating profit a company generates relative to the money it has raised (debt and equity).
Although Tri Pointe Homes hasn’t been the highest-quality company lately because of its poor revenue and EPS performance, it historically found a few growth initiatives that worked. Its five-year average ROIC was 12.7%, higher than most industrials businesses.
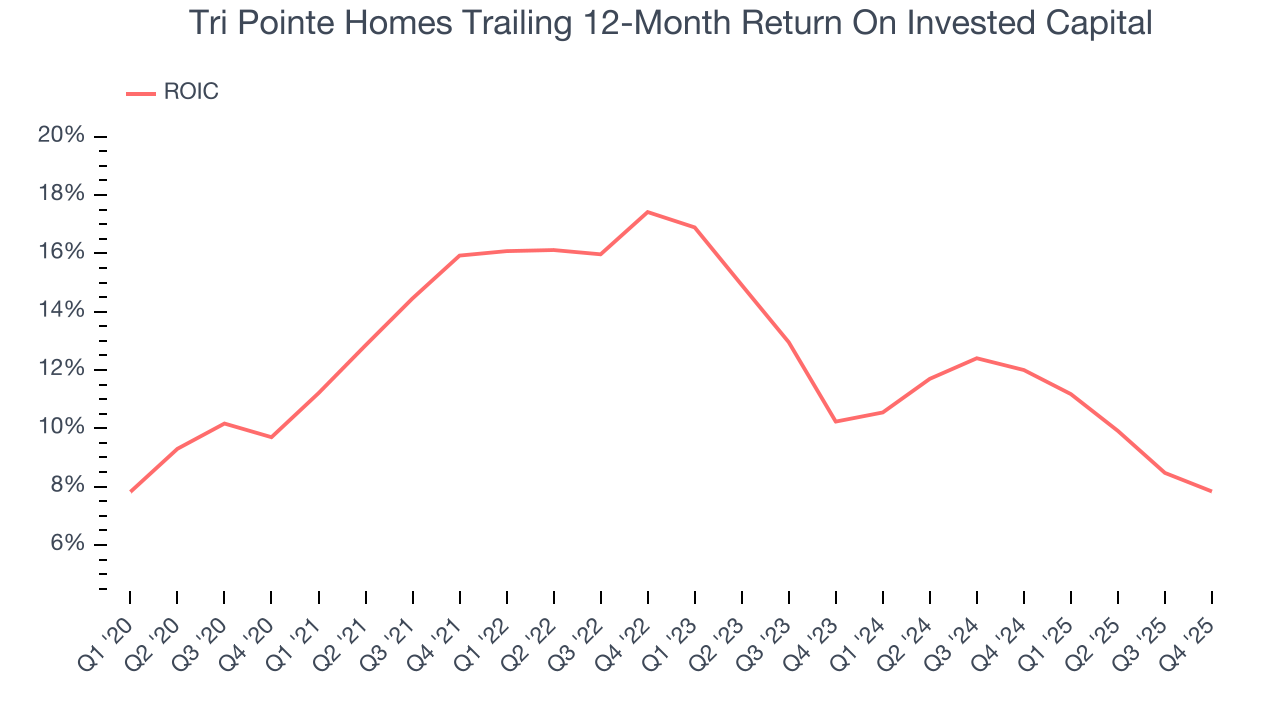
We like to invest in businesses with high returns, but the trend in a company’s ROIC is what often surprises the market and moves the stock price. Over the last few years, Tri Pointe Homes’s ROIC has unfortunately decreased. We like what management has done in the past, but its declining returns are perhaps a symptom of fewer profitable growth opportunities.
11. Balance Sheet Assessment
Tri Pointe Homes reported $982.8 million of cash and $1.10 billion of debt on its balance sheet in the most recent quarter. As investors in high-quality companies, we primarily focus on two things: 1) that a company’s debt level isn’t too high and 2) that its interest payments are not excessively burdening the business.
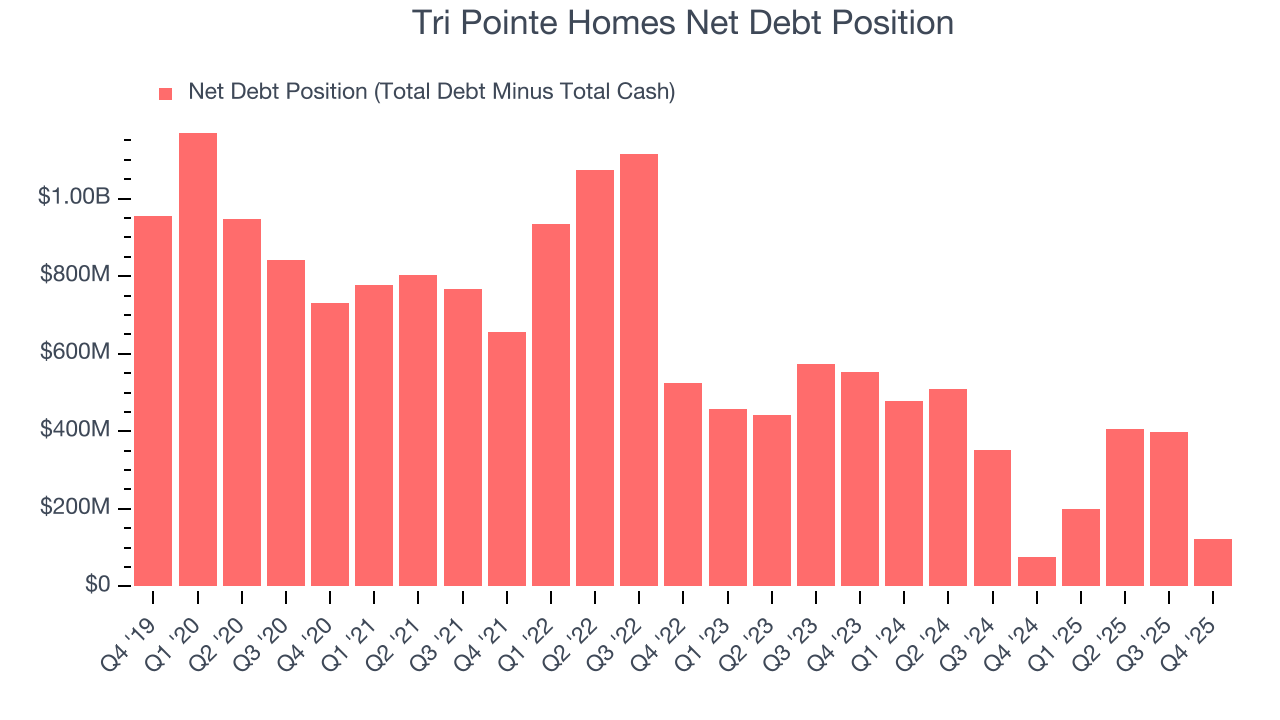
With $491.1 million of EBITDA over the last 12 months, we view Tri Pointe Homes’s 0.2× net-debt-to-EBITDA ratio as safe. The company’s profits give it plenty of breathing room, allowing it to continue investing in growth initiatives.
12. Key Takeaways from Tri Pointe Homes’s Q4 Results
It was encouraging to see Tri Pointe Homes beat analysts’ revenue expectations this quarter. On the other hand, its EPS missed. Overall, this quarter could have been better. The stock remained flat at $46.70 immediately after reporting.
13. Is Now The Time To Buy Tri Pointe Homes?
Updated: March 18, 2026 at 12:06 AM EDT
Before investing in or passing on Tri Pointe Homes, we urge you to understand the company’s business quality (or lack thereof), valuation, and the latest quarterly results - in that order.
Tri Pointe Homes falls short of our quality standards. To begin with, its revenue growth was weak over the last five years, and analysts expect its demand to deteriorate over the next 12 months. While its strong operating margins show it’s a well-run business, the downside is its diminishing returns show management's prior bets haven't worked out. On top of that, its projected EPS for the next year is lacking.
Tri Pointe Homes’s P/E ratio based on the next 12 months is 22.5x. This valuation tells us a lot of optimism is priced in - we think there are better opportunities elsewhere.
Wall Street analysts have a consensus one-year price target of $47 on the company (compared to the current share price of $46.51).