
TransUnion (TRU)
We’re not sold on TransUnion. Its poor returns on capital indicate it barely generated any profits, a must for high-quality companies.― StockStory Analyst Team
1. News


2. Summary
Why TransUnion Is Not Exciting
One of the three major credit bureaus in the United States alongside Equifax and Experian, TransUnion (NYSE:TRU) is a global information and insights company that provides credit reports, fraud prevention tools, and data analytics to help businesses make decisions and consumers manage their financial health.
- ROIC of 5.8% reflects management’s challenges in identifying attractive investment opportunities
- Annual earnings per share growth of 7.5% underperformed its revenue over the last five years, showing its incremental sales were less profitable
- A silver lining is that its market share has increased this cycle as its 11% annual revenue growth over the last five years was exceptional


TransUnion lacks the business quality we seek. We’re redirecting our focus to better businesses.
Why There Are Better Opportunities Than TransUnion


TransUnion’s stock price of $70.55 implies a valuation ratio of 14.6x forward P/E. This multiple is lower than most business services companies, but for good reason.
We’d rather pay up for companies with elite fundamentals than get a bargain on weak ones. Cheap stocks can be value traps, and as their performance deteriorates, they will stay cheap or get even cheaper.
3. TransUnion (TRU) Research Report: Q4 CY2025 Update
Credit reporting company TransUnion (NYSE:TRU) announced better-than-expected revenue in Q4 CY2025, with sales up 13% year on year to $1.17 billion. Guidance for next quarter’s revenue was better than expected at $1.2 billion at the midpoint, 0.7% above analysts’ estimates. Its non-GAAP profit of $1.07 per share was 4.3% above analysts’ consensus estimates.
TransUnion (TRU) Q4 CY2025 Highlights:
- Revenue: $1.17 billion vs analyst estimates of $1.13 billion (13% year-on-year growth, 3.3% beat)
- Adjusted EPS: $1.07 vs analyst estimates of $1.03 (4.3% beat)
- Adjusted EBITDA: $416.7 million vs analyst estimates of $404.1 million (35.6% margin, 3.1% beat)
- Revenue Guidance for Q1 CY2026 is $1.2 billion at the midpoint, roughly in line with what analysts were expecting
- Adjusted EPS guidance for the upcoming financial year 2026 is $4.67 at the midpoint, missing analyst estimates by 3.9%
- EBITDA guidance for the upcoming financial year 2026 is $1.77 billion at the midpoint, below analyst estimates of $1.80 billion
- Operating Margin: 17.4%, in line with the same quarter last year
- Free Cash Flow Margin: 19%, up from 13.2% in the same quarter last year
- Market Capitalization: $13.94 billion
Company Overview
One of the three major credit bureaus in the United States alongside Equifax and Experian, TransUnion (NYSE:TRU) is a global information and insights company that provides credit reports, fraud prevention tools, and data analytics to help businesses make decisions and consumers manage their financial health.
TransUnion's business revolves around collecting, analyzing, and providing access to data that helps organizations assess risk and make informed decisions. The company maintains vast databases of consumer credit information, including payment histories, debt levels, and credit utilization, which it transforms into actionable insights through proprietary analytics.
For businesses, TransUnion offers solutions across the entire customer lifecycle. Financial institutions use TransUnion's credit reports and scores to evaluate loan applications and set interest rates. Insurance companies leverage its data to assess risk and determine premiums. Landlords and employers use its tenant and employment screening services to vet applicants. Retailers and telecommunications companies utilize its identity verification and fraud prevention tools to protect against financial losses.
For example, when a consumer applies for a mortgage, the lender might use TransUnion's credit report to assess the applicant's creditworthiness, while using its fraud detection tools to verify the applicant's identity and prevent potential fraud. Similarly, an insurance company might use TransUnion's data to determine appropriate auto insurance rates based on a customer's risk profile.
TransUnion generates revenue primarily through subscription-based and transaction-based models. Businesses pay to access its databases and analytics tools, while consumers pay for credit monitoring services and identity protection products. The company operates through two main segments: U.S. Markets (including Financial Services, Emerging Verticals, and Consumer Interactive) and International, with operations spanning over 30 countries across North America, Latin America, Europe, Africa, and Asia.
Beyond traditional credit reporting, TransUnion has expanded its capabilities through strategic acquisitions, including Neustar, which enhanced its identity resolution technology, and Sontiq, which strengthened its consumer identity protection offerings. The company's OneTru platform allows it to integrate disparate data fragments in real-time, providing more comprehensive insights to customers.
4. Data & Business Process Services
A combination of increasing reliance on data and analytics across various industries and the desire for cost efficiency through outsourcing could mean that companies in this space gain. As functions such as payroll, HR, and credit risk assessment rely on more digitization, key players in the data & business process services industry could be increased demand. On the other hand, the sector faces headwinds from growing regulatory scrutiny on data privacy and security, with laws like GDPR and evolving U.S. regulations potentially limiting data collection and monetization strategies. Additionally, rising cyber threats pose risks to firms handling sensitive personal and financial information, creating outsized headline risk when things go wrong in this area.
TransUnion's primary competitors include the other two major credit bureaus, Equifax (NYSE:EFX) and Experian (LON:EXPN), along with specialized competitors in various verticals such as FICO (NYSE:FICO) in credit scoring, Verisk Analytics (NASDAQ:VRSK) in insurance analytics, and LifeLock (owned by NortonLifeLock, NASDAQ:NLOK) in consumer identity protection.
5. Revenue Growth
A company’s long-term sales performance can indicate its overall quality. Any business can put up a good quarter or two, but many enduring ones grow for years.
With $4.58 billion in revenue over the past 12 months, TransUnion is one of the larger companies in the business services industry and benefits from a well-known brand that influences purchasing decisions.
As you can see below, TransUnion grew its sales at an impressive 11% compounded annual growth rate over the last five years. This shows it had high demand, a useful starting point for our analysis.
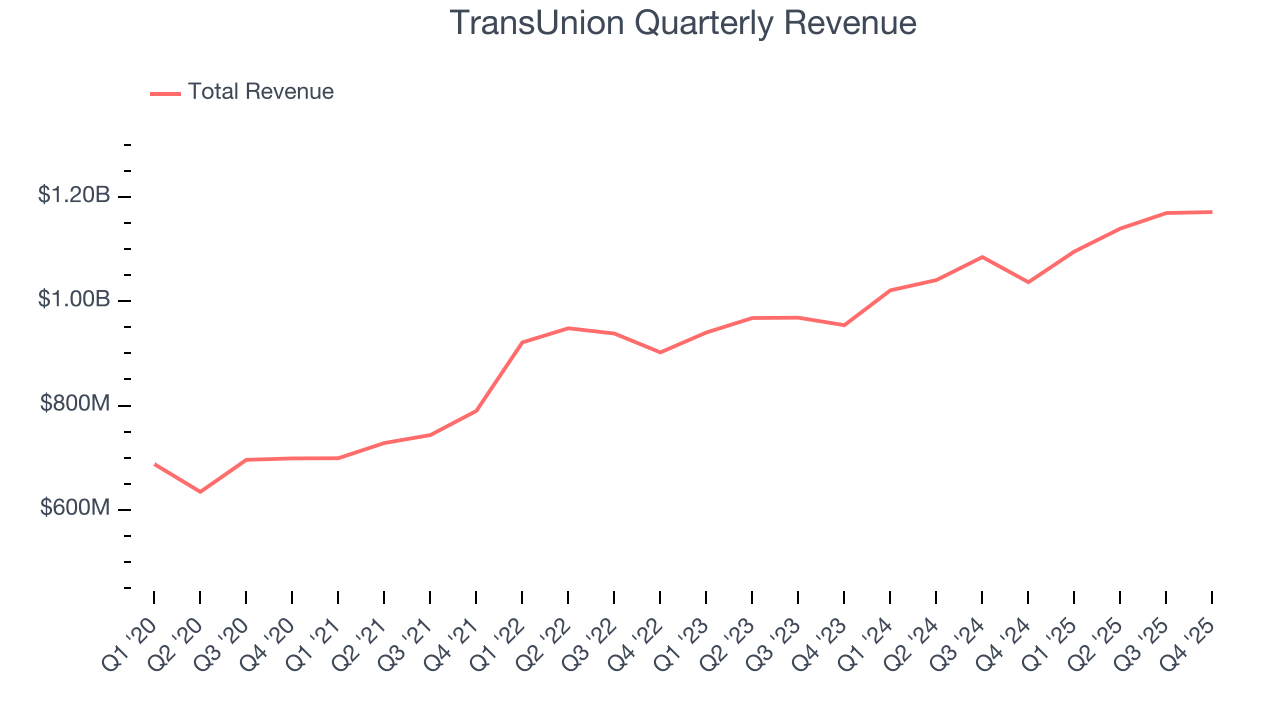
Long-term growth is the most important, but within business services, a half-decade historical view may miss new innovations or demand cycles. TransUnion’s annualized revenue growth of 9.3% over the last two years is below its five-year trend, but we still think the results suggest healthy demand. 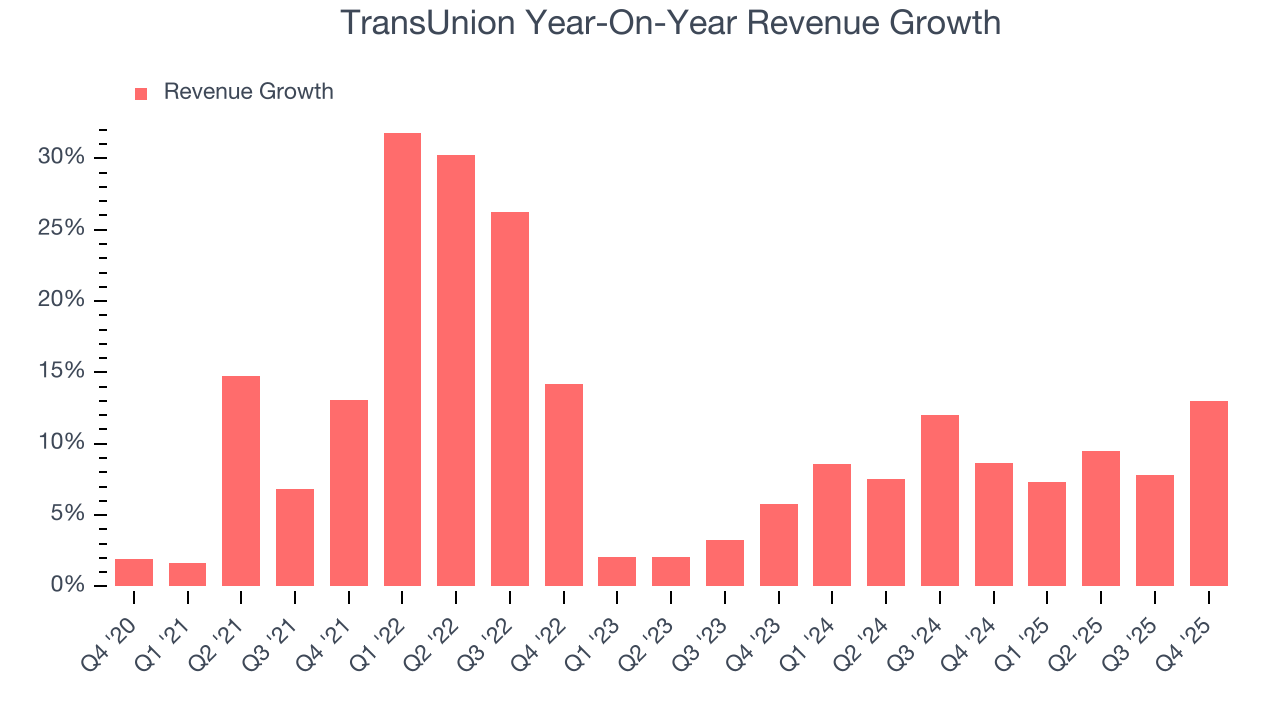
This quarter, TransUnion reported year-on-year revenue growth of 13%, and its $1.17 billion of revenue exceeded Wall Street’s estimates by 3.3%. Company management is currently guiding for a 9.5% year-on-year increase in sales next quarter.
Looking further ahead, sell-side analysts expect revenue to grow 7.4% over the next 12 months, a slight deceleration versus the last two years. Despite the slowdown, this projection is healthy and implies the market sees success for its products and services.
6. Operating Margin
Operating margin is one of the best measures of profitability because it tells us how much money a company takes home after subtracting all core expenses, like marketing and R&D.
TransUnion has been an efficient company over the last five years. It was one of the more profitable businesses in the business services sector, boasting an average operating margin of 15.2%.
Looking at the trend in its profitability, TransUnion’s operating margin decreased by 3.1 percentage points over the last five years. This raises questions about the company’s expense base because its revenue growth should have given it leverage on its fixed costs, resulting in better economies of scale and profitability.
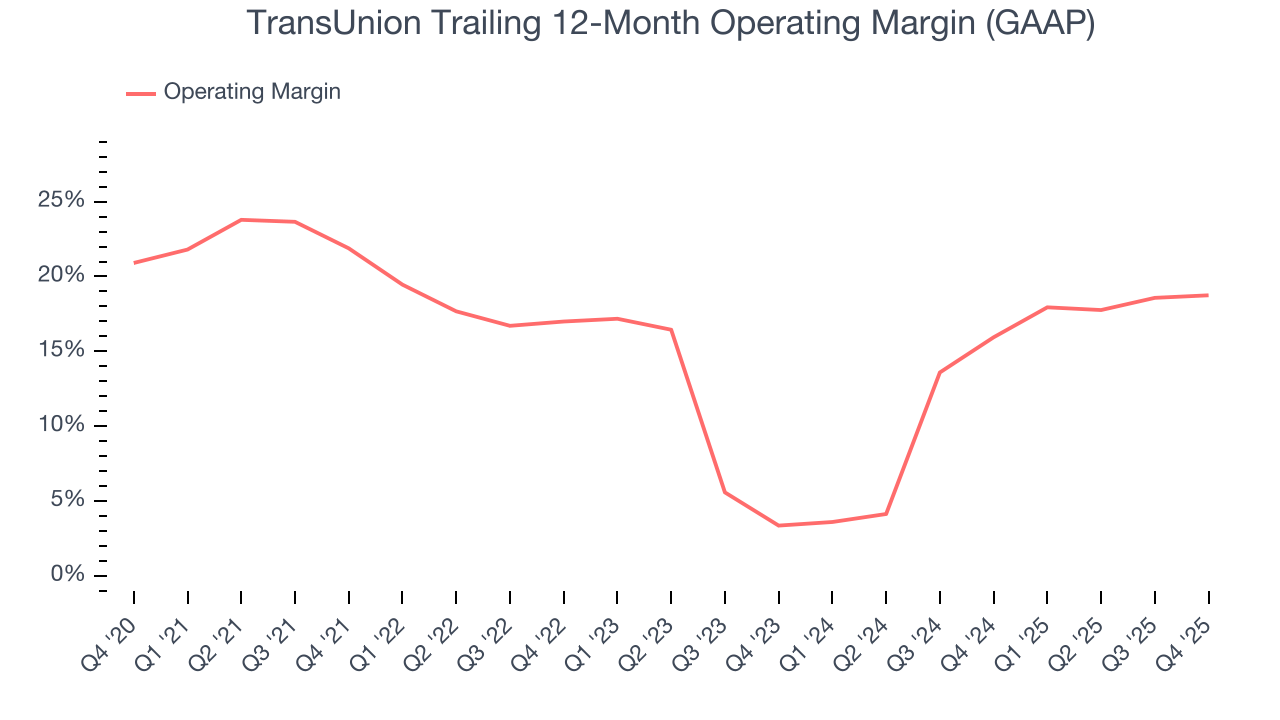
In Q4, TransUnion generated an operating margin profit margin of 17.4%, in line with the same quarter last year. This indicates the company’s overall cost structure has been relatively stable.
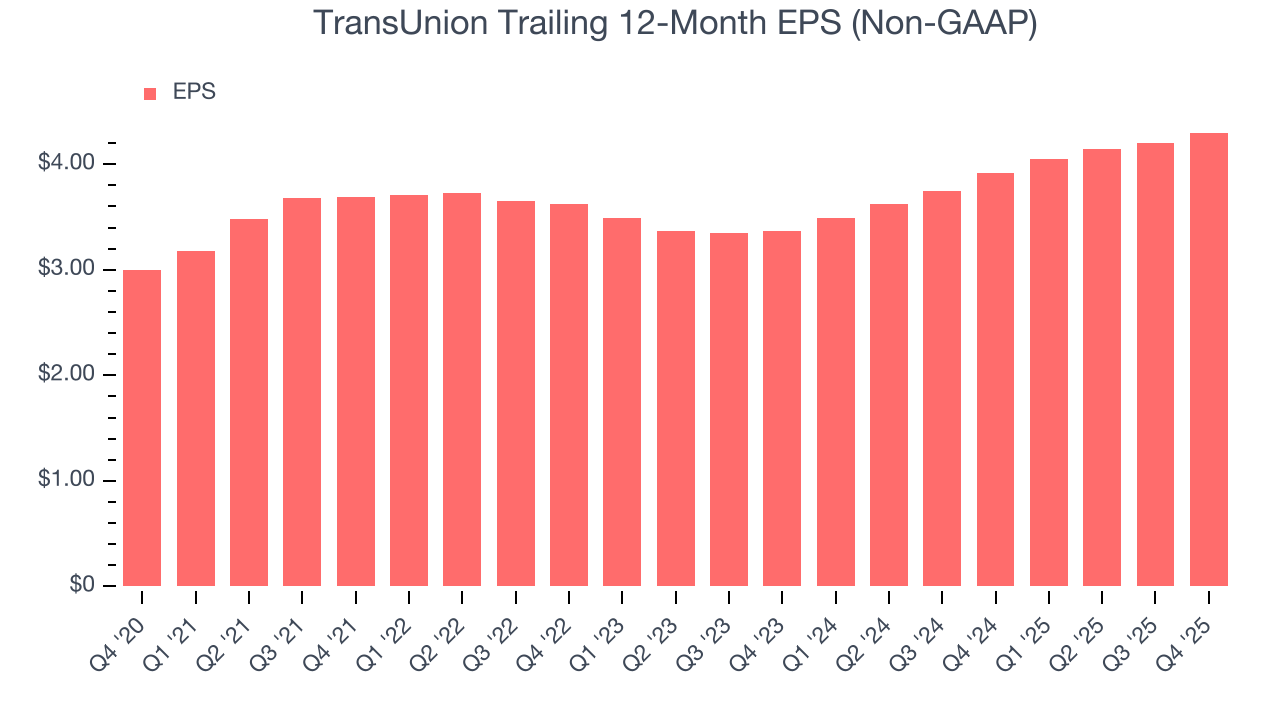
7. Earnings Per Share
We track the long-term change in earnings per share (EPS) for the same reason as long-term revenue growth. Compared to revenue, however, EPS highlights whether a company’s growth is profitable.
TransUnion’s EPS grew at an unimpressive 7.5% compounded annual growth rate over the last five years, lower than its 11% annualized revenue growth. This tells us the company became less profitable on a per-share basis as it expanded due to non-fundamental factors such as interest expenses and taxes.
We can take a deeper look into TransUnion’s earnings to better understand the drivers of its performance. As we mentioned earlier, TransUnion’s operating margin was flat this quarter but declined by 3.1 percentage points over the last five years. This was the most relevant factor (aside from the revenue impact) behind its lower earnings; interest expenses and taxes can also affect EPS but don’t tell us as much about a company’s fundamentals.
Like with revenue, we analyze EPS over a shorter period to see if we are missing a change in the business.
For TransUnion, its two-year annual EPS growth of 13% was higher than its five-year trend. This acceleration made it one of the faster-growing business services companies in recent history.
In Q4, TransUnion reported adjusted EPS of $1.07, up from $0.97 in the same quarter last year. This print beat analysts’ estimates by 4.3%. Over the next 12 months, Wall Street expects TransUnion’s full-year EPS of $4.30 to grow 12.4%.
8. Cash Is King
Free cash flow isn't a prominently featured metric in company financials and earnings releases, but we think it's telling because it accounts for all operating and capital expenses, making it tough to manipulate. Cash is king.
TransUnion has shown robust cash profitability, giving it an edge over its competitors and the ability to reinvest or return capital to investors. The company’s free cash flow margin averaged 10.8% over the last five years, quite impressive for a business services business.
Taking a step back, we can see that TransUnion’s margin dropped by 5 percentage points during that time. It may have ticked higher more recently, but shareholders are likely hoping for its margin to at least revert to its historical level. If the longer-term trend returns, it could signal increasing investment needs and capital intensity.
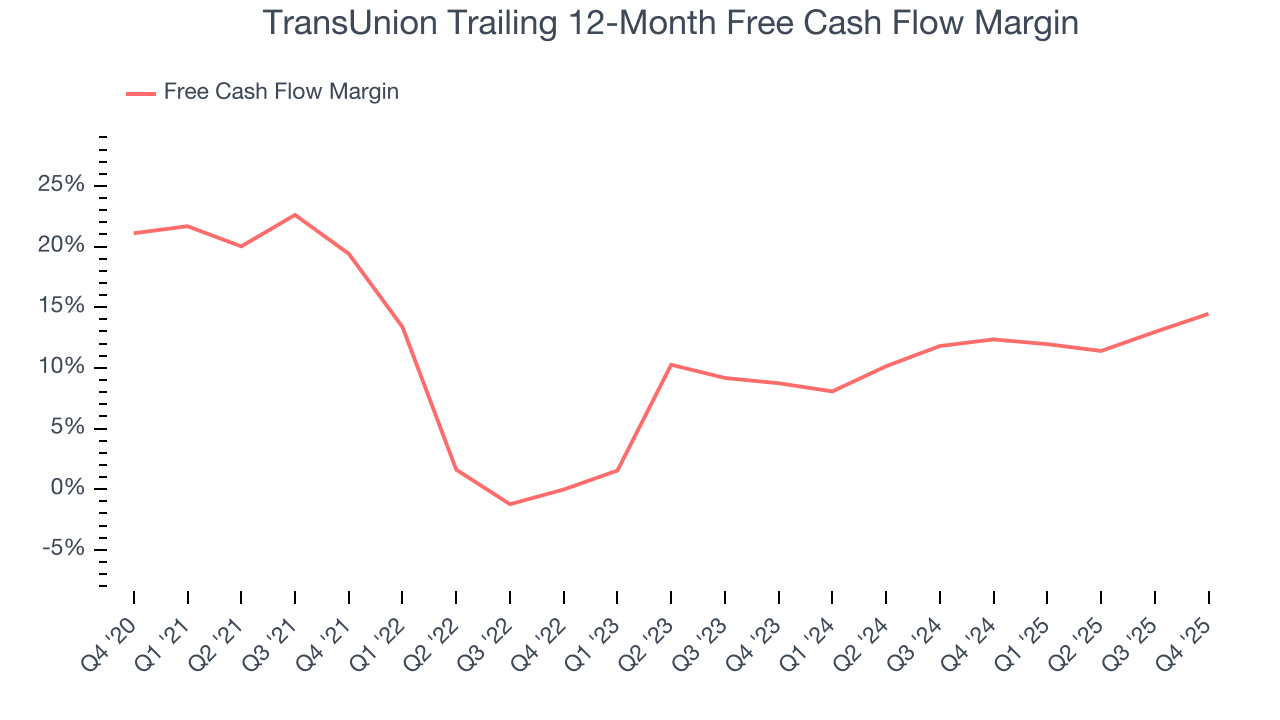
TransUnion’s free cash flow clocked in at $222.8 million in Q4, equivalent to a 19% margin. This result was good as its margin was 5.8 percentage points higher than in the same quarter last year, but we wouldn’t read too much into the short term because investment needs can be seasonal, causing temporary swings. Long-term trends trump fluctuations.
9. Return on Invested Capital (ROIC)
EPS and free cash flow tell us whether a company was profitable while growing its revenue. But was it capital-efficient? Enter ROIC, a metric showing how much operating profit a company generates relative to the money it has raised (debt and equity).
TransUnion historically did a mediocre job investing in profitable growth initiatives. Its five-year average ROIC was 5.9%, somewhat low compared to the best business services companies that consistently pump out 25%+.
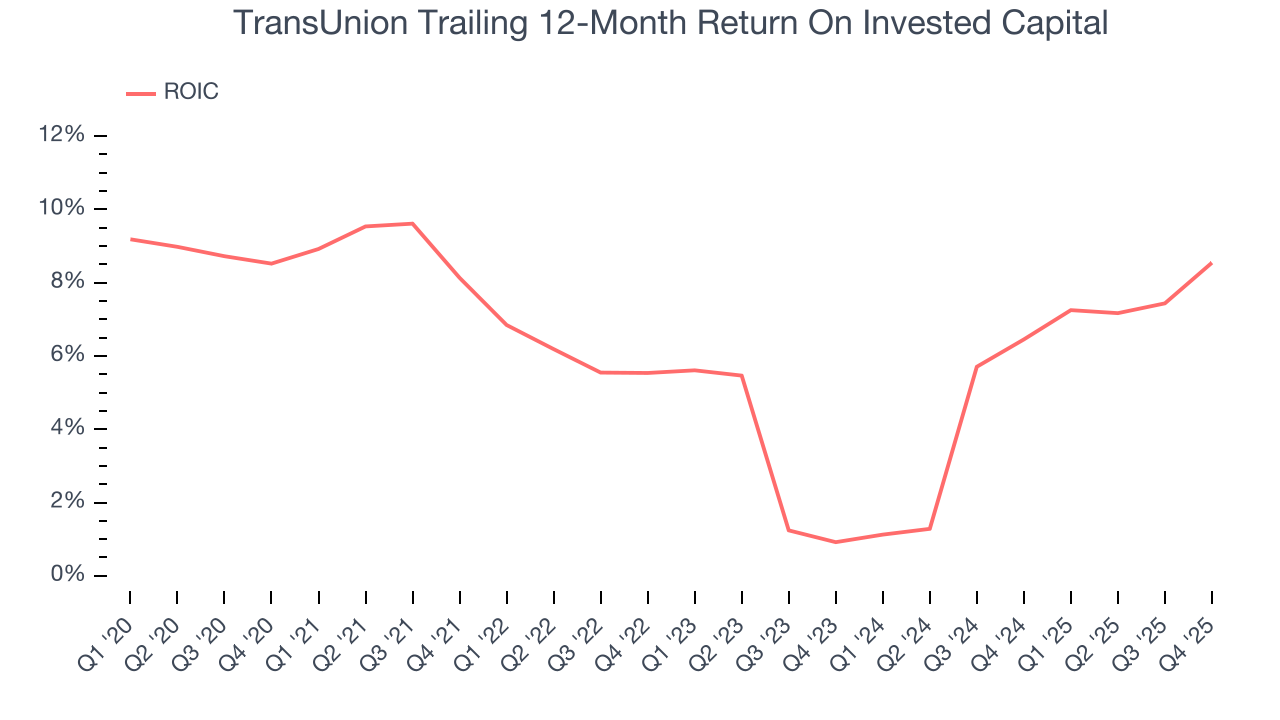
We like to invest in businesses with high returns, but the trend in a company’s ROIC is what often surprises the market and moves the stock price. Unfortunately, TransUnion’s ROIC has stayed the same over the last few years. If the company wants to become an investable business, it must improve its returns by generating more profitable growth.
10. Balance Sheet Assessment
TransUnion reported $853.6 million of cash and $5.10 billion of debt on its balance sheet in the most recent quarter. As investors in high-quality companies, we primarily focus on two things: 1) that a company’s debt level isn’t too high and 2) that its interest payments are not excessively burdening the business.
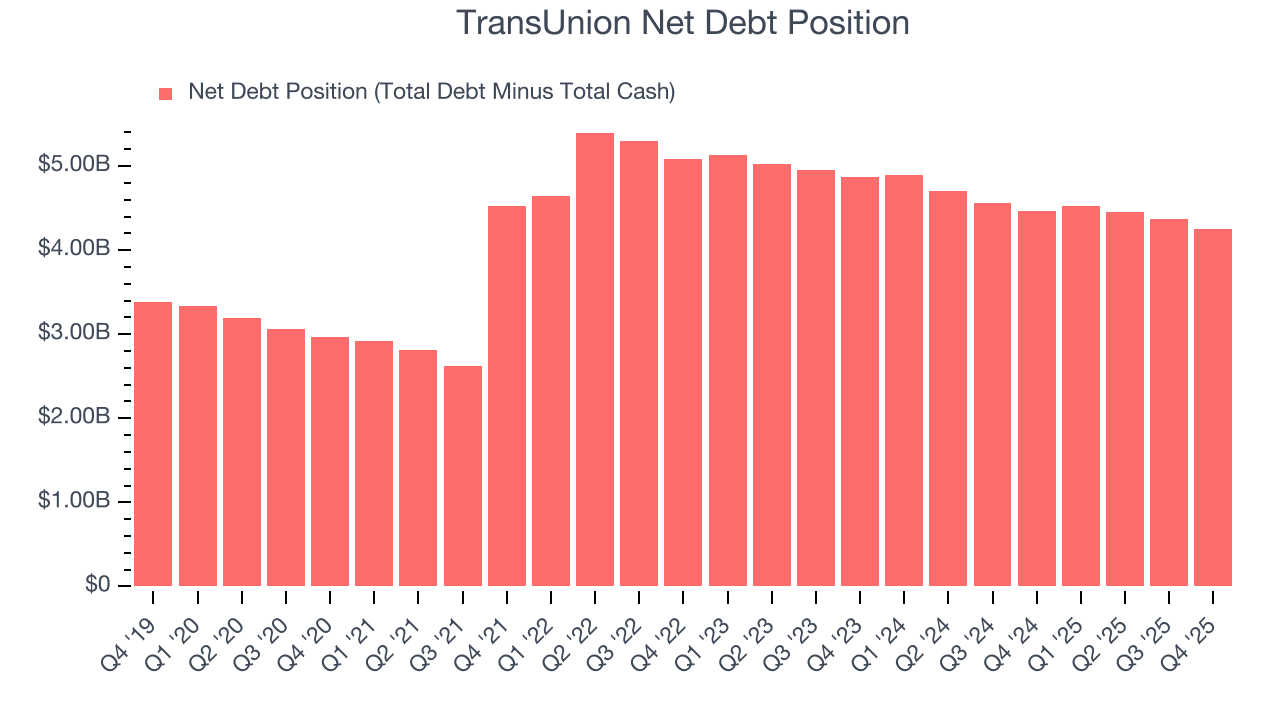
With $1.65 billion of EBITDA over the last 12 months, we view TransUnion’s 2.6× net-debt-to-EBITDA ratio as safe. We also see its $95.1 million of annual interest expenses as appropriate. The company’s profits give it plenty of breathing room, allowing it to continue investing in growth initiatives.
11. Key Takeaways from TransUnion’s Q4 Results
We enjoyed seeing TransUnion beat analysts’ revenue expectations this quarter. We were also glad its EPS outperformed Wall Street’s estimates. On the other hand, its full-year EPS guidance missed and its EPS guidance for next quarter fell short of Wall Street’s estimates. Overall, this was a softer quarter. The stock remained flat at $71.68 immediately after reporting.
12. Is Now The Time To Buy TransUnion?
Updated: March 21, 2026 at 12:07 AM EDT
Before investing in or passing on TransUnion, we urge you to understand the company’s business quality (or lack thereof), valuation, and the latest quarterly results - in that order.
There are some bright spots in TransUnion’s fundamentals, but its business quality ultimately falls short. To kick things off, its revenue growth was impressive over the last five years. And while TransUnion’s cash profitability fell over the last five years, its projected EPS for the next year implies the company’s fundamentals will improve.
TransUnion’s P/E ratio based on the next 12 months is 14.6x. This valuation multiple is fair, but we don’t have much faith in the company. We're pretty confident there are more exciting stocks to buy at the moment.
Wall Street analysts have a consensus one-year price target of $94.60 on the company (compared to the current share price of $70.55).